

Compassionate Eye Foundation/David Oxberry/OJO Images Ltd
Fear is the most selected-for and, therefore, most highly evolved human emotion; almost everyone alive is capable of feeling it. Fear may not be a sufficiently precise timing indicator, but it is definitely a necessary one. We have fear in ‘spades’. In this piece, we visit several measures of fear and compare them to past stock market performance.
The AAII survey bull-bear difference is at an extreme level below -30%; in the past, these levels of fear have marked major market lows (green vertical-lines below).
ANG Traders, StockCharts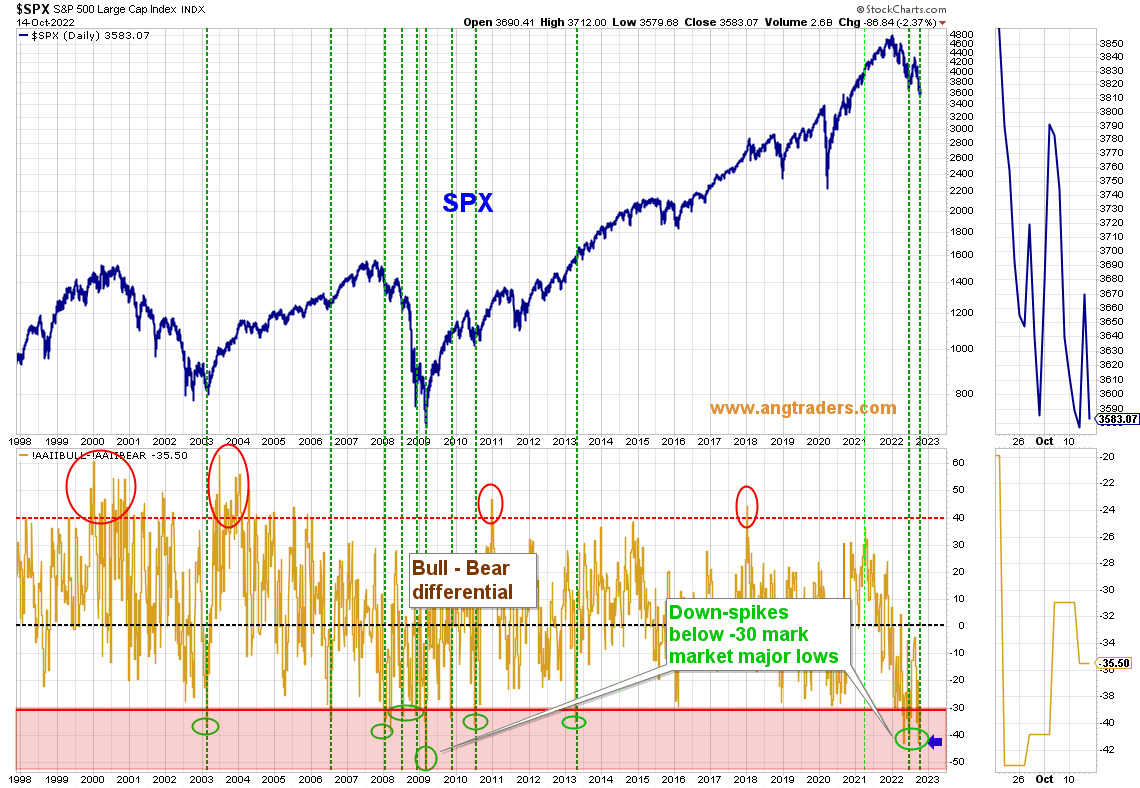
We cannot over-look the similarity between the early 2008 period and today; in 2008, there were three spikes below the -30% level, but the SPX had not bottomed and continued falling through the year-end (pink-rectangles on chart below). However, technical and fiscal analysis (not dealt with in this article) make a repeat of 2008 unlikely…at least over the next couple of months. If there is further weakness in the SPX, we will increase cash levels to match the increased risks.
ANG Traders, StockCharts
The equity-only put:call ratio’s 8-day MA is dropping after the nominal ratio made a post-pandemic high (red oval below). A falling ratio correlates with SPX rallies.
ANG Traders, StockCharts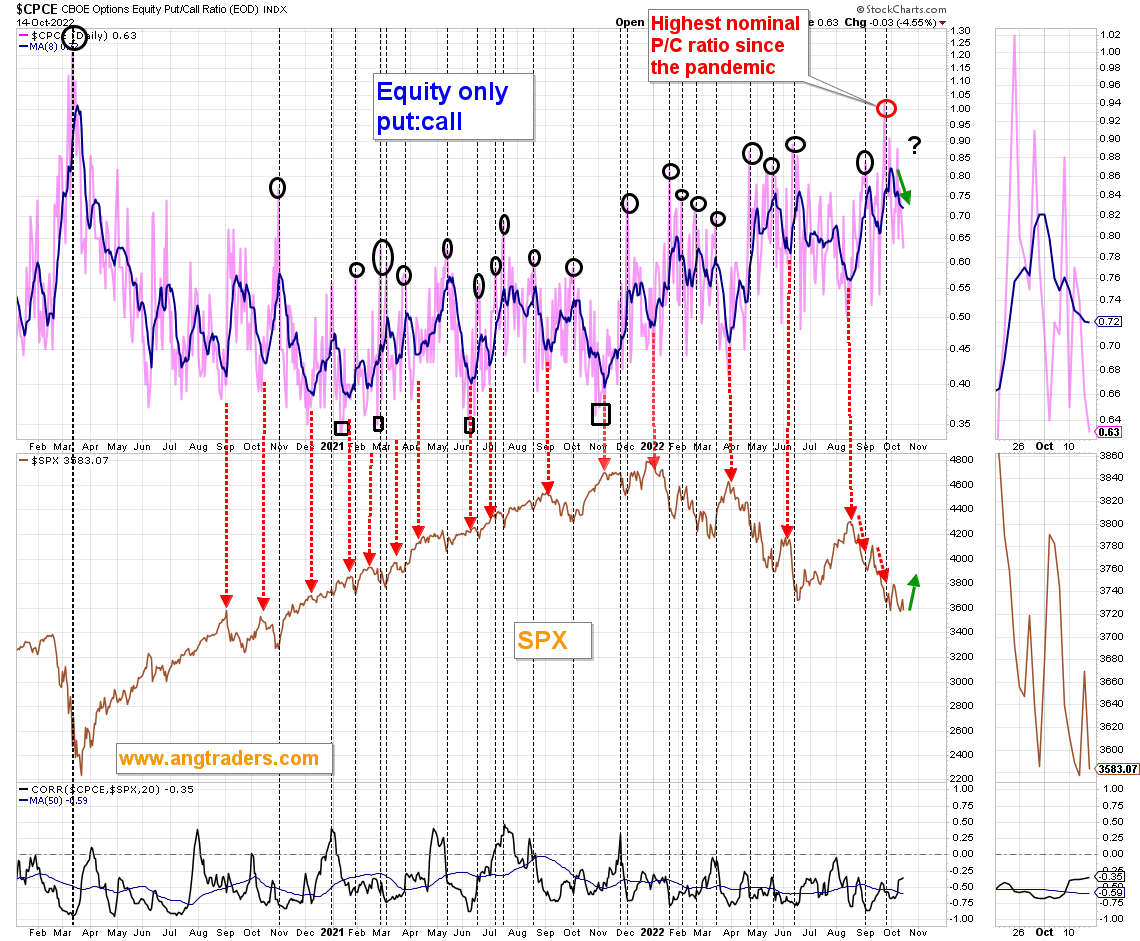
The PE:VIX ratio correlates positively with the SPX. The ratio is ‘trying to decide’ on the direction it will take when exiting the red-wedge (chart below). The majority of sentiment indicators are implying a positive exit from the wedge, but we must keep in mind that a negative path is still possible.
ANG Traders, StockCharts
Maxima in the nominal weekly put:call ratio, when associated with an up-spike in the 10-day MA, correspond to bottoms in the SPX 90% of the time. The latest up-spike, indicates a bottom formation for the SPX (blue highlights on chart below).
ANG Traders, StockCharts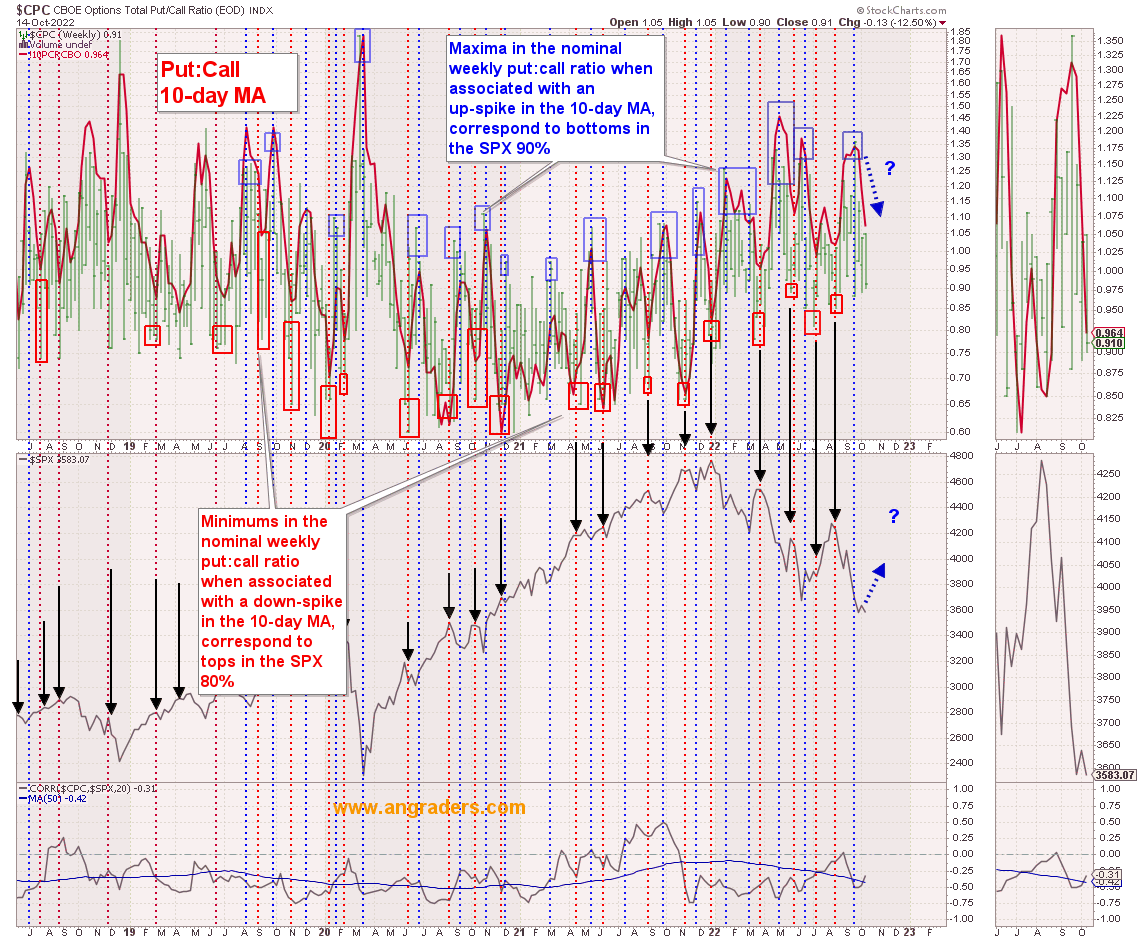
The Rydex bear:bull asset allocation ratio has spiked to levels not seen since the 2018 and 2020 SPX lows. This correlates with subsequent SPX rallies (chart below).
ANG Traders, StockCharts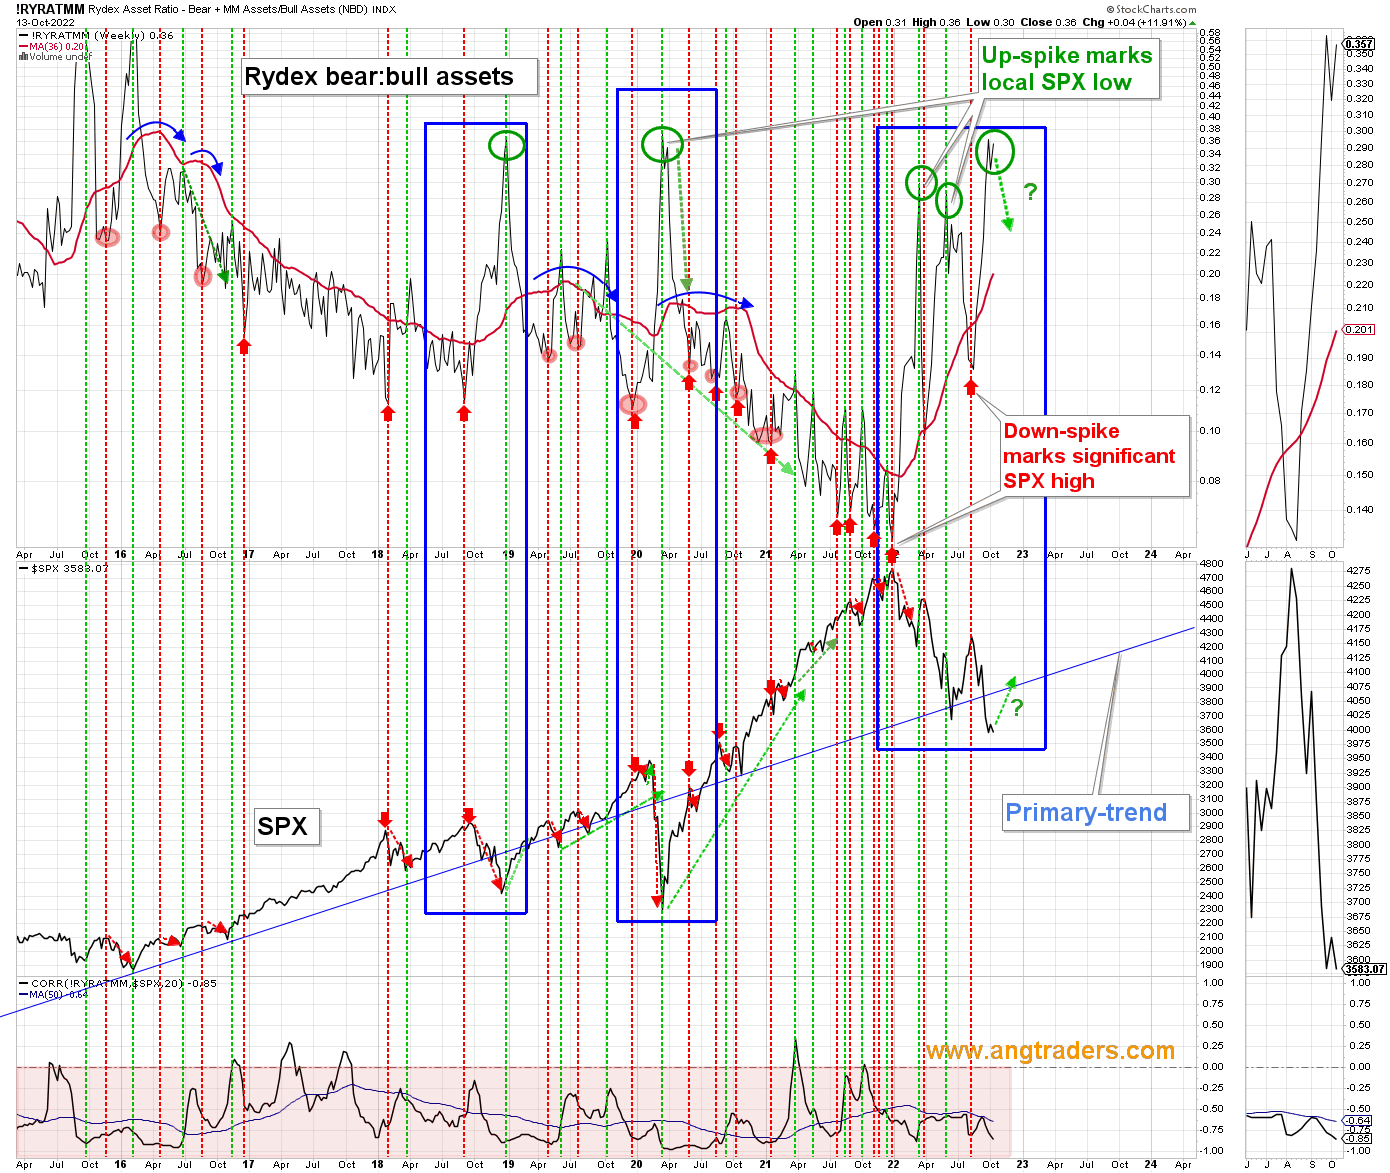
The VIX has crested the secondary (shorter) sine wave and will be dropping down into the trough by Christmas. An SPX rally will accompany the VIX drop (green-arrows below).
ANG Traders, StockCharts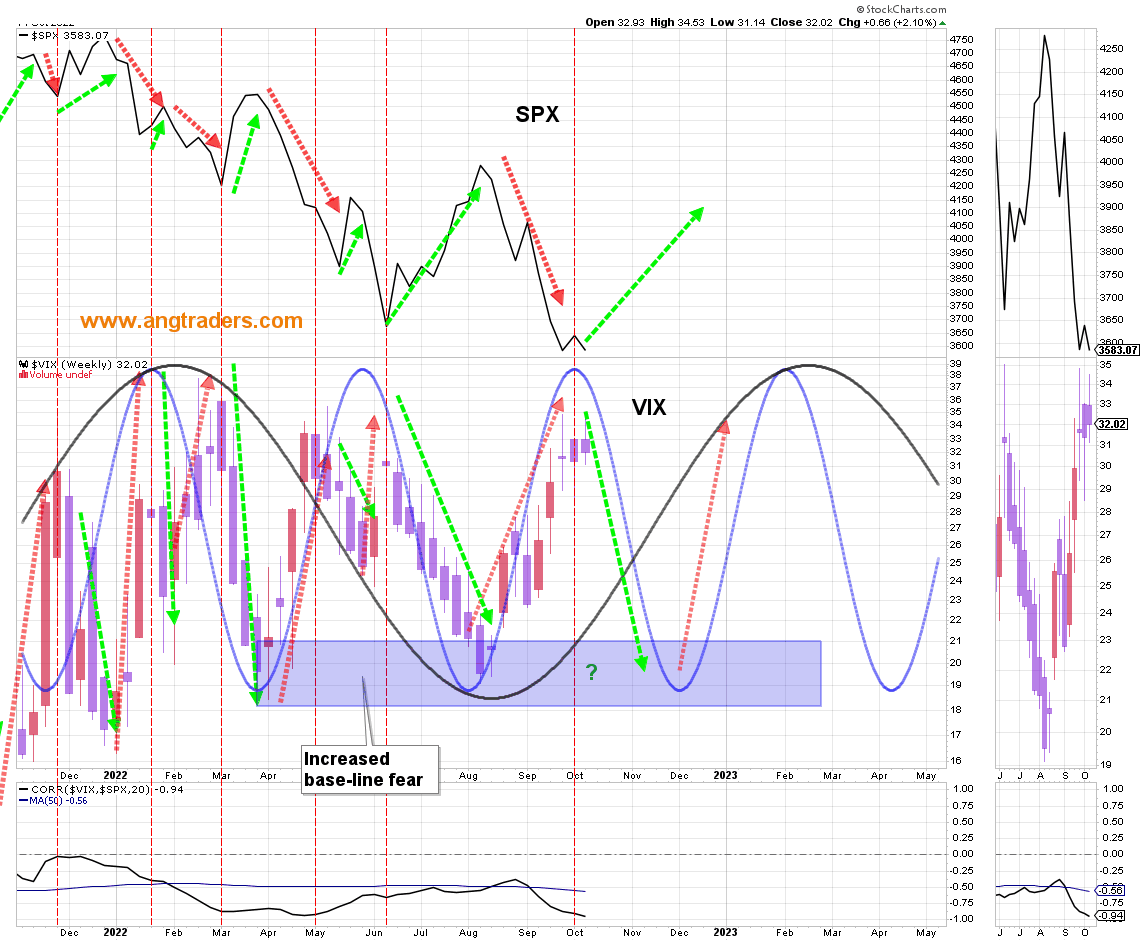
According to SentimenTrader.com past situations when the market was down 20% or more on trading day #195 were followed by positive returns in all time intervals up-to 1-year (chart below)
SentimenTrader.com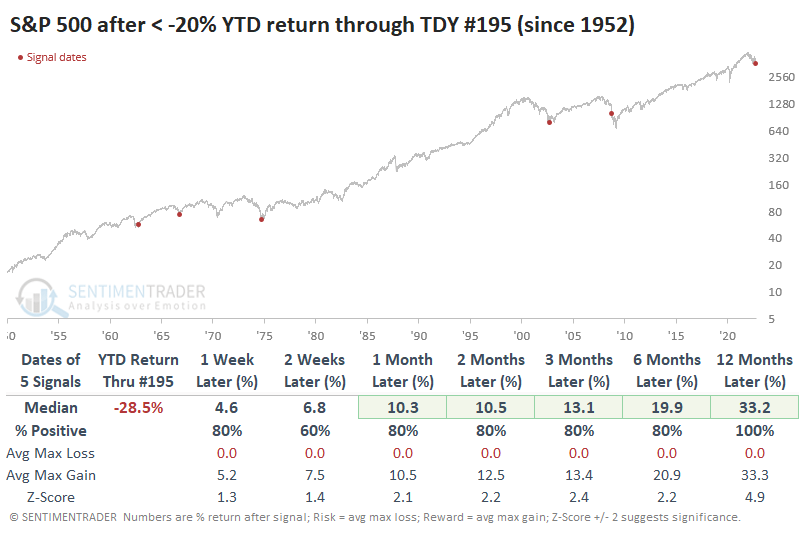
In summary: Fear continues to be rampant among investors. Fear is not a sufficiently precise timing indicator, but it is definitely a necessary factor. The majority of sentiment measures are implying the proximity of an SPX low. There is a smaller likelihood that the market has significantly further to fall, so it makes sense to be long index ETFs, such as IWM, QQQ, and SPY until mid-December.
Take advantage of our 14-day free trial and stay on the right side of the market and Away From the Herd.

“ I am SO VERY thankful for the discovery of this site, and the wisdom and knowledge I have gained ...”
” I have not seen this type of analysis anywhere else. “
“It is probably the only report of its type on the planet when you think about it.”
Take advantage of our 14-day free trial and stay on the right side of the market and Away From the Herd.
Be the first to comment