

Alena Kravchenko/iStock Editorial via Getty Images
Investment Thesis
Today’s article compares the Communication Services Select Sector SPDR ETF (NYSEARCA:XLC) with the Fidelity MSCI Communication Services ETF (NYSEARCA:FCOM). While both funds share many similarities, including a market-cap-weighting scheme and a low expense ratio, I want to highlight some crucial differences, including XLC’s lower price-earnings ratio and FCOM’s superior track record. This article will take you through these differences, highlighting each fund’s exposures, technicals, and fundamentals. To conclude, I’ll name my favorite and why and also provide a list of five other Communication Services ETFs I think you should check out too.
Strategy and Performance Comparison
XLC and FCOM are both market-cap-weighted ETFs, but the primary difference is the size of the companies each is allowed to hold. XLC only has 23 Communication Services companies from the S&P 500, with a minimum market capitalization of $13.1 billion. On the other hand, FCOM selects from a much larger stock universe and holds 106 companies, 24 with market capitalizations under $1 billion.
The market-cap-weighting scheme means that individually, these holdings don’t impact performance by much. However, the impact is substantial when taken together, which helps explain the performance discrepancies over the last eight and a half years. Small- and mid-cap stocks haven’t added additional volatility to FCOM, but returns were 2.94% per year better. These results may surprise investors, given how FCOM’s AUM is a mere $582 million compared to $9.38 billion. FCOM even has the edge on fees (0.08% vs. 0.10%).
Portfolio Visualizer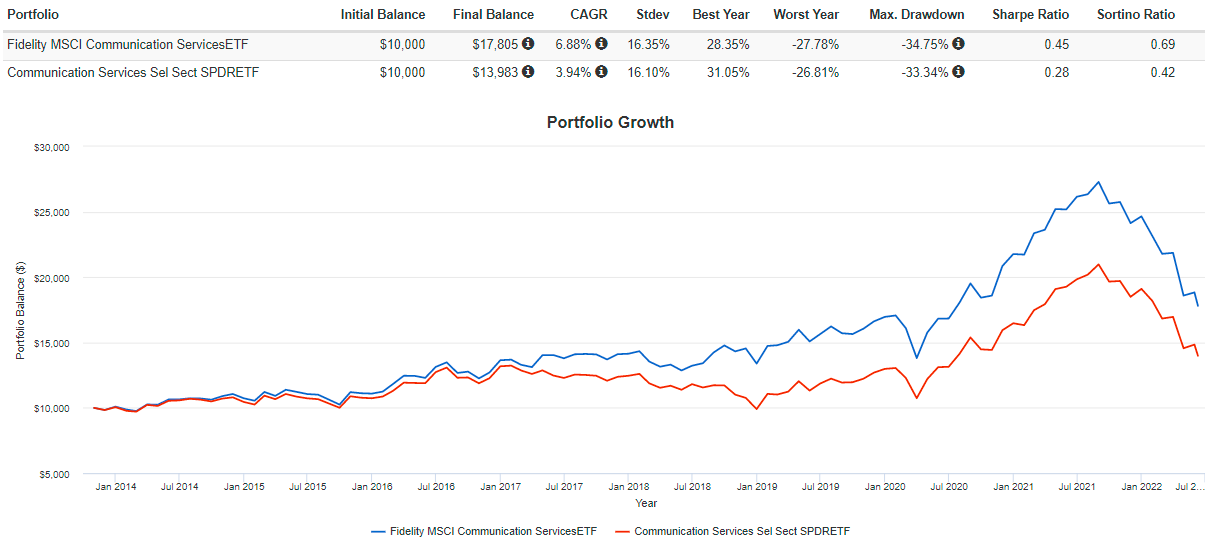
Industry Exposures
The following table breaks down XLC into its top holdings by industry. For clarity, weights are cash-adjusted, and I’ve combined companies with two share classes like Alphabet.
The Sunday Investor
As shown, Interactive Media & Services, comprised of Alphabet, Meta Platforms (META), Twitter (TWTR), and Match Group (MTCH), make up 45.43% of the ETF, followed by Interactive Home Entertainment (11.27%), Cable & Satellite (9.29%), and Integrated Telecommunication Services (9.18%).
FCOM is also heavily concentrated in the same Interactive Media & Services stocks but by about 3% less. Certain stocks like Alphabet, Verizon (VZ), and AT&T (T) have a greater weight in FCOM, which isn’t what you would expect. One reason is that FCOM weights by market capitalization while XLC weights by float-adjusted market capitalization. Another is that the two have different quarterly rebalancing schedules. These seemingly minor differences have added to quite a significant performance difference over the years.
The Sunday Investor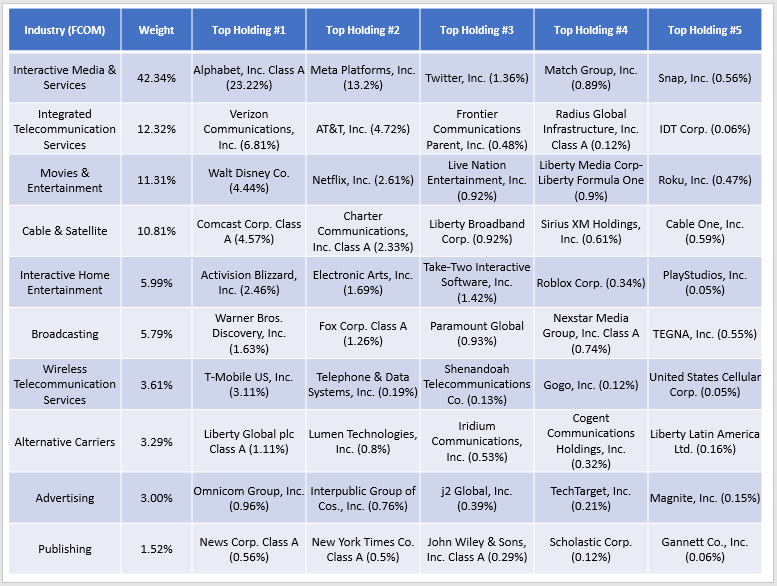
XLC vs. FCOM Analysis
Price and Total Returns: Adjusted To Current Weights
We know that FCOM was the better performer historically, but current allocations matter most to today’s buyers. The table below highlights selected price and total return metrics for XLC’s top 20 holdings.
The Sunday Investor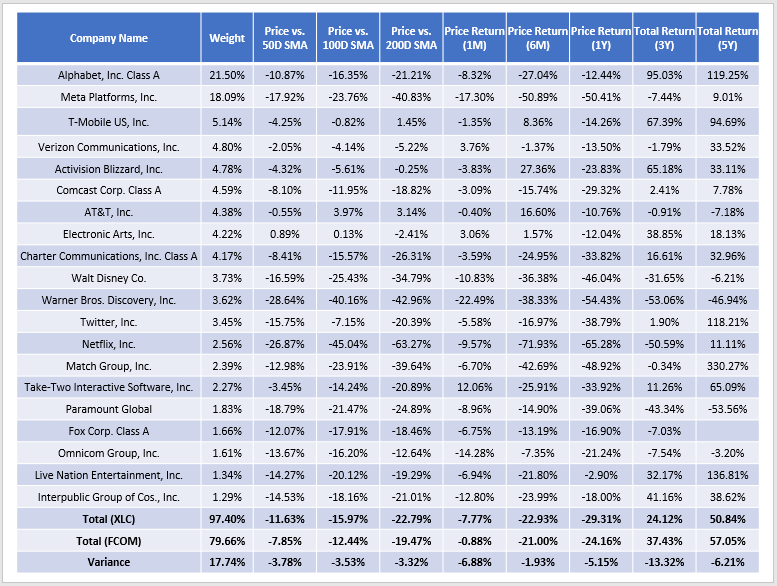
As shown, XLC lags FCOM over all periods, including a 13.32% total return deficit over the last three years and a 6.88% price return deficit over the previous month. Taking the top two stocks as examples, Alphabet looks to be a consistent outperformer over longer periods, while Meta Platforms has generated only a 9.01% return over the last five years. Recall that Meta’s weight in XLC is 4.89% more while Alphabet’s is 1.71% less, so that’s one reason why FCOM has outperformed.
Here are the same metrics for FCOM’s 20 most overweight stocks relative to XLC, and many have held up better than the fund averages. For example, Liberty Formula One (LWONK) and Nexstar Media Group (NXST) are still trading near their 200-day moving average price. There’s certainly value in adding these lesser-known companies to your portfolio. It seems like XLC is more of a value play while FCOM is for investors not expecting a sudden rebound anytime soon.
The Sunday Investor
Size, Growth, Valuation, and Profitability
When uncertainty is high, I tend to favor profitable large-cap, low-volatility portfolios with a nice mix of growth and valuation. I’ve summarized this below for FCOM’s top 20 holdings, with summary metrics in the bottom rows.
The Sunday Investor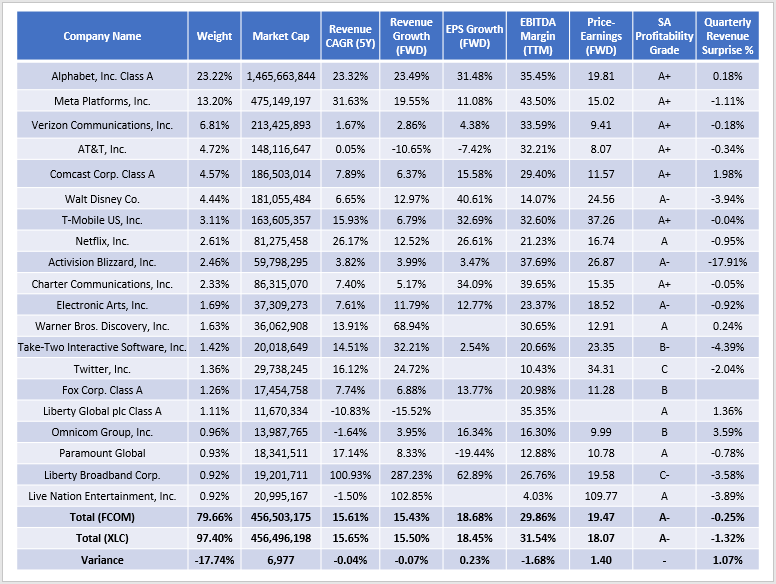
There’s a case to be made that XLC is the more attractive ETF today. Size and profitability are roughly the same, as indicated by each portfolio’s weighted-average market capitalization and Seeking Alpha Profitability Grade. Revenue and earnings growth are also about the same, but XLC is trading 1.40 points less on a forward earnings basis. The reason is primarily because of Meta Platforms’ attractive 15.02 forward P/E. Meta trades at 12.43 earnings on a trailing basis, which is about its lowest ever.
Seeking Alpha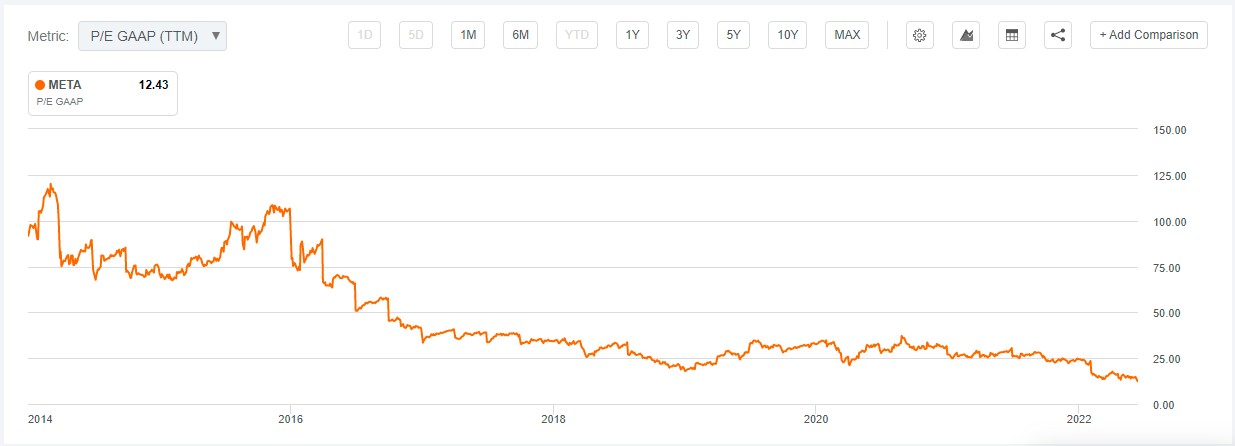
The value opportunity sounds excellent, but analysts have been trying to catch this falling knife for a while now. This year, article ratings on Meta Platforms were 33 strong buys, 77 buys, 21 holds, 15 sells, and two strong sells, yet the stock price is down nearly 50% YTD. The fact is that Meta’s average revenue surprise over the last four quarters is a mere 2.11% compared to 8.17% for the previous four quarters. Analysts have also downgraded the next quarter’s earnings expectations by 22.66% over the last six months. It’s just not a company I can get behind, and not one I want accounting for nearly 20% of an ETF like with XLC.
Investment Recommendation
XLC and FCOM are two low-cost Communication Services sector ETFs that have declined by about 30% this year. While each has pros and cons, I favor FCOM because it overweights Alphabet, underweights Meta Platforms, and appears to have a bit more momentum. On the other hand, value investors may prefer XLC for its lower forward price-earnings ratio and the belief that Meta Platforms is nearing its bottom.
Investors should also consider five other Communication Services ETFs, as shown below. The Vanguard Communication Services ETF (VOX) is the second-largest next to XLC, with $2.93 billion in assets under management and a low 0.10% expense ratio. The SPDR S&P Telecom ETF (XTL) may be an exciting choice for those looking to diversify by size, but naturally, you’ll have to give up some quality in terms of profitability. That may not be the direction you want to go in a prolonged bear market.
Morningstar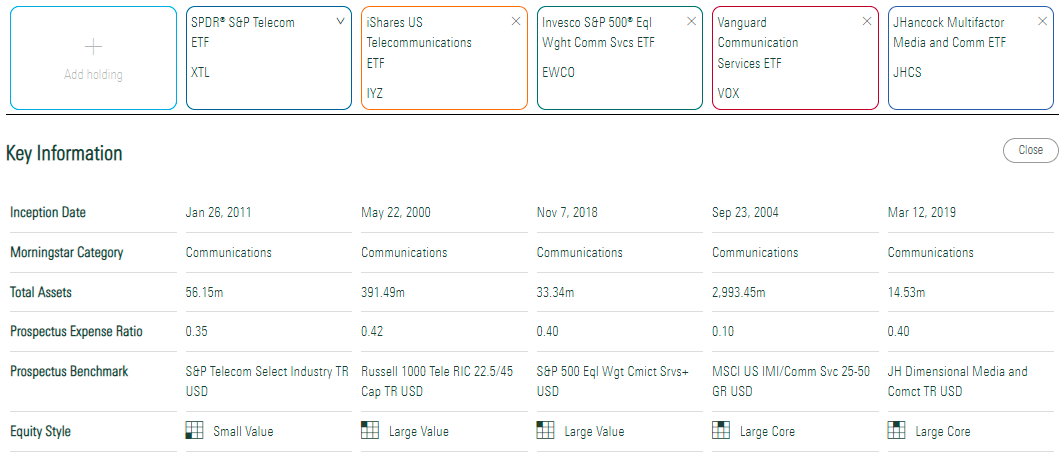
Thank you for reading this review, and if you’d like further information on any of the ETFs mentioned, please feel free to comment below.
Be the first to comment