

Brett_Hondow
Allstate (NYSE:ALL) has fallen 8.4% from the 12-month-high closing price of $142.86 on April 20th and the share price is almost identical to the value from 12 months ago. The decline in the past couple of months is likely to be at least partly because the widely-followed Colorado State University hurricane forecast published on April 7th predicts elevated risks for 2022. In addition, the Q1 results, released on May 5th, missed the consensus expected EPS by 12%.
Seeking Alpha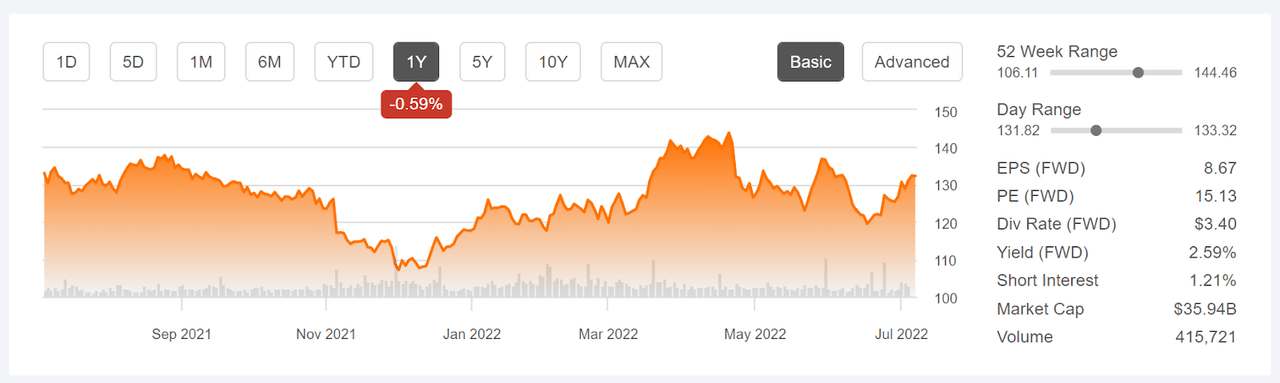
12-Month price history and basic statistics for ALL (Source: Seeking Alpha)
Jefferies analyst Yaron Kinar suggests that P&C insurers can be an attractive bet heading into what is expected to be an active hurricane season because the market tends to overestimate insured damages and because insurance sales tend to increase after a disaster.
So far, in 2022, ALL is substantially outpacing both the property and casualty (P&C) insurance industry (as defined by Morningstar) and the U.S. equity market as a whole. For both the YTD and the past 12 months, ALL and the P&C industry have dramatically beaten the broader market. Higher interest rates tend to boost the expected value of insurance company shares by reducing the net present value of future liabilities. The discount rate applied to the expected future payouts rises with interest rates.
Morningstar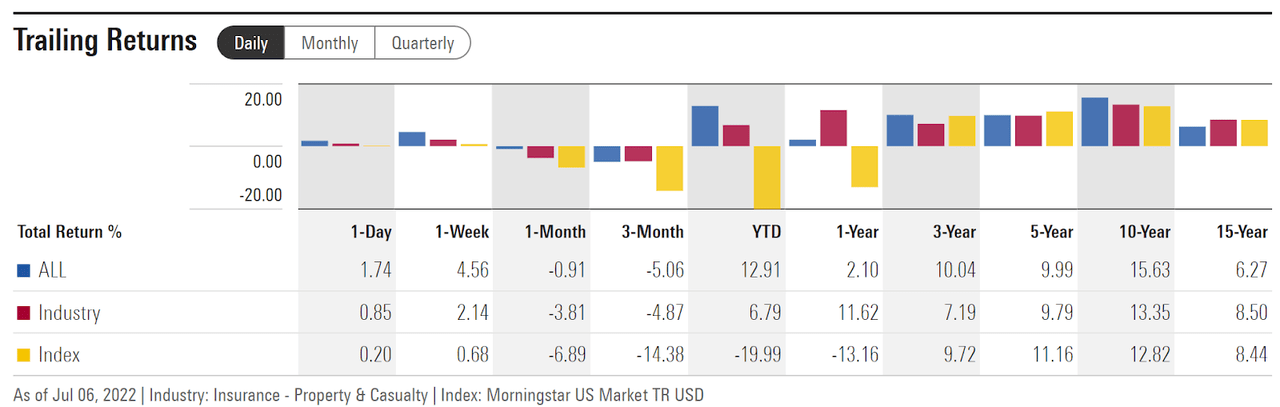
Historical total returns for ALL vs. the Property and Casualty Insurance industry and the U.S. total equity market index (Source: Morningstar)
Over the past 3-, 5-, and 10-year periods, ALL has outperformed the P&C industry and has returned almost as much as the Morningstar’s total U.S. equity index over the 3- and 5-year periods and has beaten the index over the past ten years.
ETrade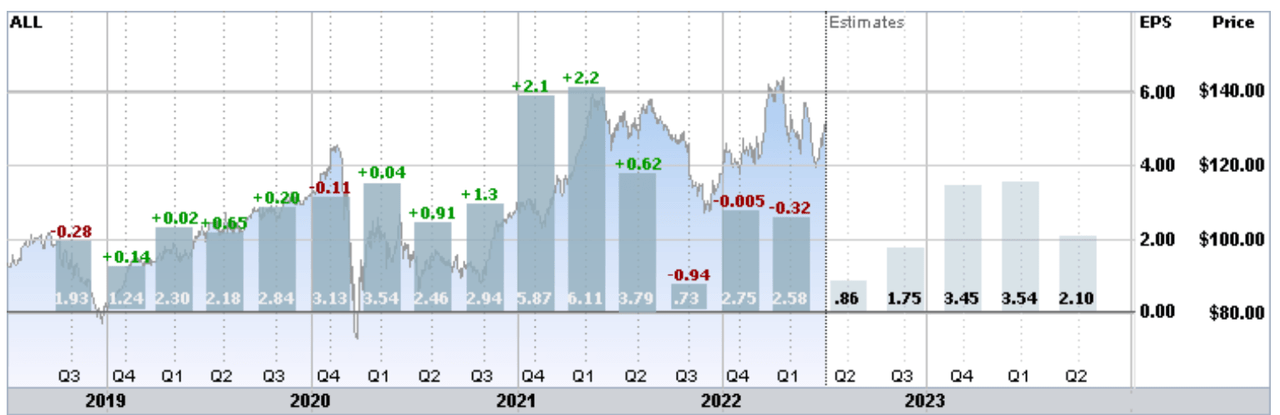
Trailing 4 years and estimated future quarterly EPS for ALL. Green (red) values are amounts by which EPS beat (missed) the consensus expected value (Source: ETrade)
ALL has missed earnings expectations over the past 3 quarters, and the expectations were well below earnings from 2021. Looking ahead, the estimated EPS growth over the next 3 to 5 years is an anemic 5.4% per year. The poor results for Q1 were largely attributable to elevated payouts on auto insurance policies due to increased accident frequency and severity. High payouts on auto policies were also a factor in reducing Q4 earnings, although the EPS was very close to the consensus, and for Q3. The costs associated with auto repair and replacement have risen substantially during the pandemic, and this continues to reduce ALL’s earnings.
It must be noted that ALL currently looks somewhat expensive relative to current earnings. The P/E is well above the stock’s trailing 5-year average P/E.
I last wrote about ALL on October 20, 2021, at which time I maintained my buy rating on the stock. Over the 8 ½ months since, ALL has dramatically outperformed the S&P 500. The attractiveness of ALL started with the low volatility, along with solid returns relative to that volatility. ALL falls into the category that I refer to as portfolio ballast, adding stability to portfolio performance. ALL has a trailing 5-year beta of 0.82 relative to the S&P 500. The Wall Street consensus outlook at that time was bullish, and the consensus 12-month price target implied a total return of about 12.7% over the next year. The market-implied outlook, which represents the consensus view implied by options prices, was also bullish, with moderate volatility.
Seeking Alpha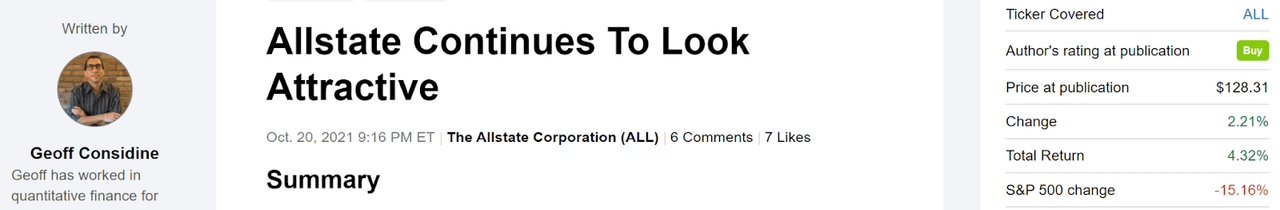
Previous analysis of ALL and subsequent performance vs. the S&P 500 (Source: Seeking Alpha)
For readers who are unfamiliar with the market-implied outlook, a brief explanation is needed. The price of an option on a stock is largely determined by the market’s consensus estimate of the probability that the stock price will rise above (call option) or fall below (put option) a specific level (the option strike price) between now and when the option expires. By analyzing the prices of call and put options at a range of strike prices, all with the same expiration date, it is possible to calculate a probabilistic price forecast that reconciles the options prices. This is the market-implied outlook. For a deeper explanation and background, I recommend this monograph published by the CFA Institute.
I have calculated an updated market-implied outlook to early 2023 and compared this with the current Wall Street consensus outlook in revisiting my rating on ALL.
Wall Street Consensus Outlook for ALL
ETrade calculates the Wall Street consensus outlook using ratings and price targets published by 11 ranked analysts over the past 3 months. The consensus rating for ALL is bullish/buy, and the consensus 12-month price target is 11.3% above the current share price. For comparison, the consensus price target in my analysis in October was 8.3% above the share price at that time. Of the 11 analysts, 4 assign a buy rating, 6 assign a neutral rating and 1 rates ALL as a sell.
ETrade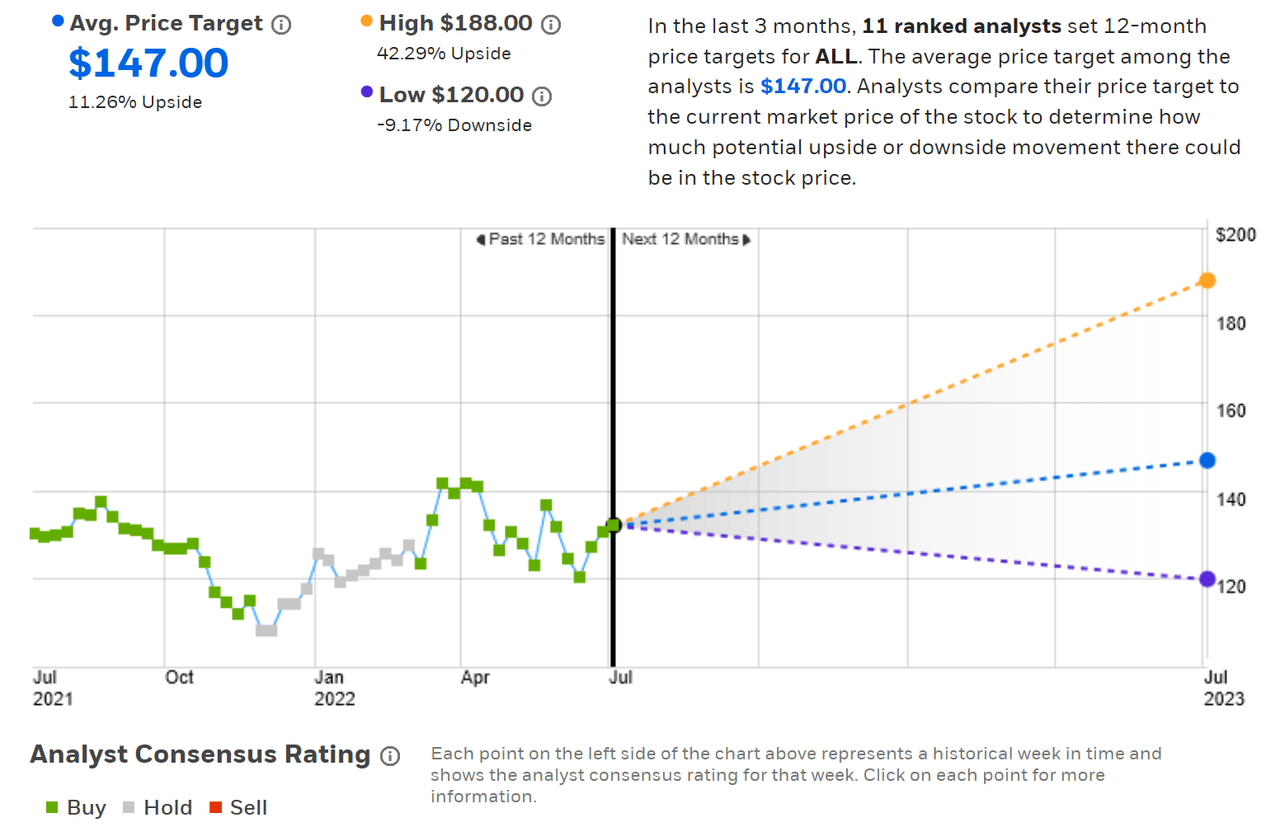
Wall Street analyst consensus rating and 12-month price target for ALL (Source: ETrade)
Seeking Alpha’s version of the Wall Street consensus outlook is calculated using price targets and ratings from 20 analysts who have published opinions over the past 90 days. The consensus rating is bullish and the consensus 12-month price target is 10.6% above the current share price.
Seeking Alpha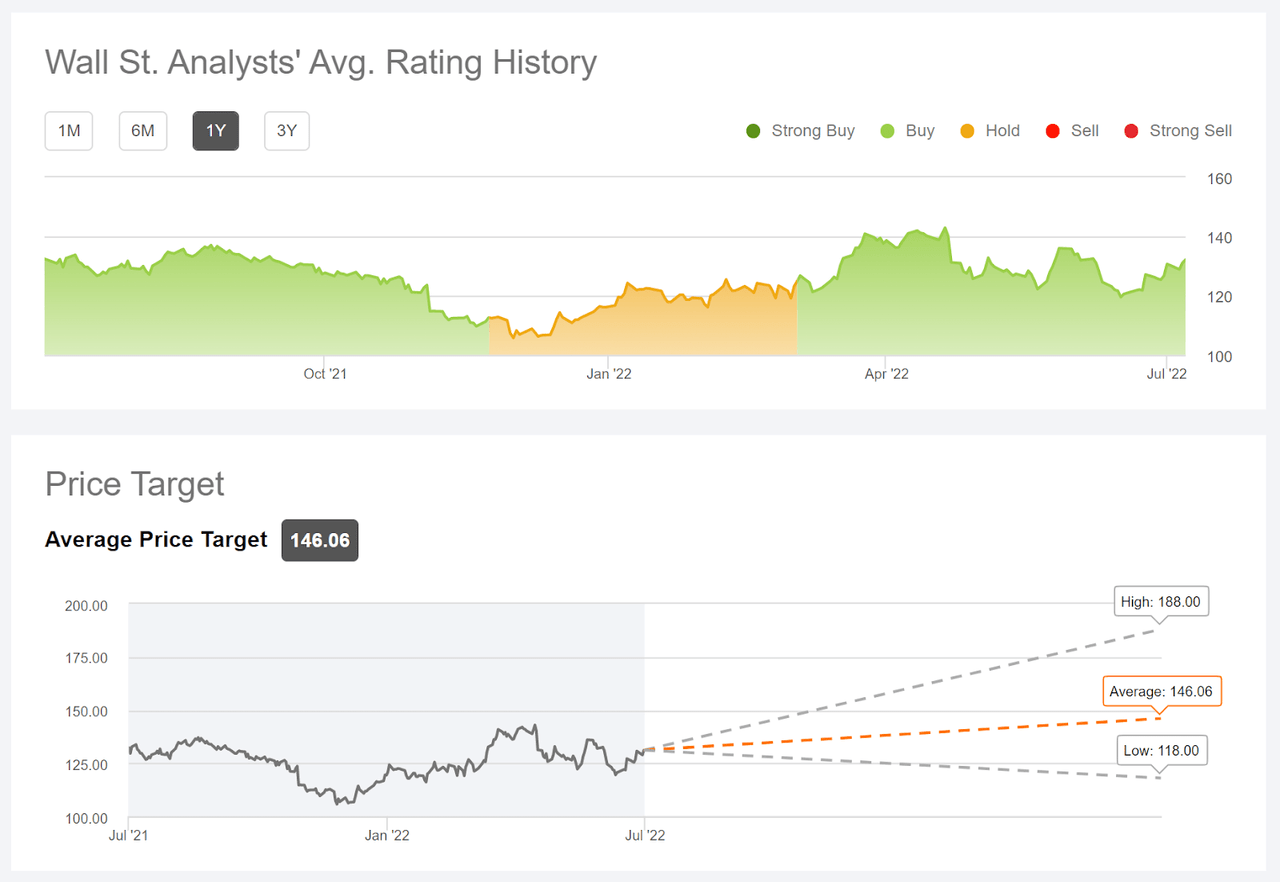
Wall Street analyst consensus rating and 12-month price target for ALL (Source: Seeking Alpha)
The consensus price targets from Seeking Alpha and ETrade are very close, which is encouraging that the results are not sensitive to the specific sample of analysts. Combined with the 2.6% dividend yield, the expected total return implied by the consensus price target (averaging the Seeking Alpha and ETrade results) is 13.6%.
Market-Implied Outlook for ALL
I have calculated the market-implied outlook for the 6.4-month period from now until January 20, 2023, using the prices of put and call options that expire on this date. I chose this specific expiration date to provide a view through the end of the year. The options trading volume for ALL is low, reducing the weight that I assign to the market-implied outlook in forming my overall opinion.
The standard presentation of the market-implied outlook is a probability distribution of price return, with probability on the vertical axis and return on the horizontal.
Geoff Considine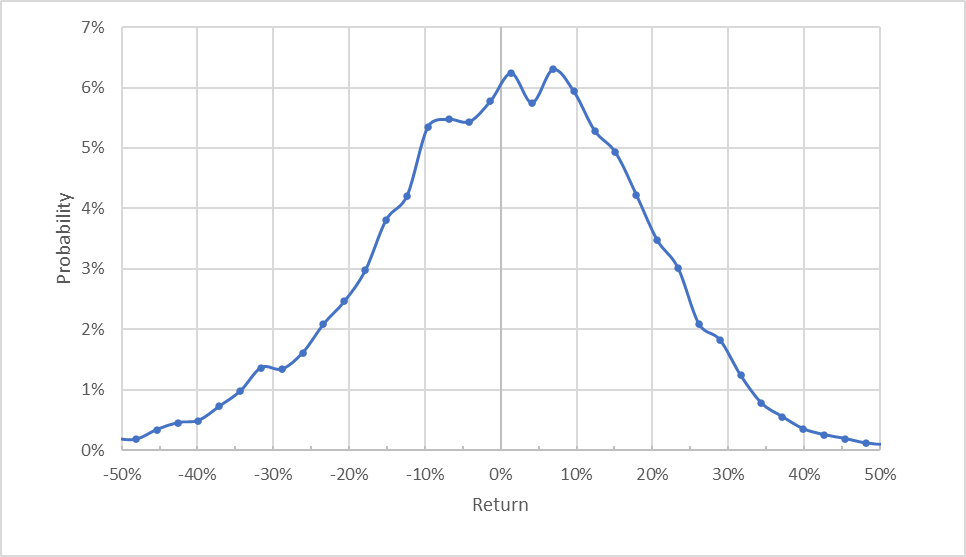
Market-implied price return probabilities for ALL for the 6.4-month period from now until January 20, 2023 (Source: Author’s calculations using options quotes from ETrade)
The outlook for the next 6.4 months is generally symmetric, although the most-probable outcomes favor positive returns. The peak probability corresponds to a price return of 6.9% over this period. This peak is not well-defined, however. The primary observation is that the distribution shows elevated probabilities of positive returns. The expected volatility calculated from this outlook is 28%. The expected volatility has risen, as compared to the value from October, 23%.
To make it easier to compare the relative probabilities of positive and negative returns, I rotate the negative return side of the distribution about the vertical axis (see chart below).
Geoff Considine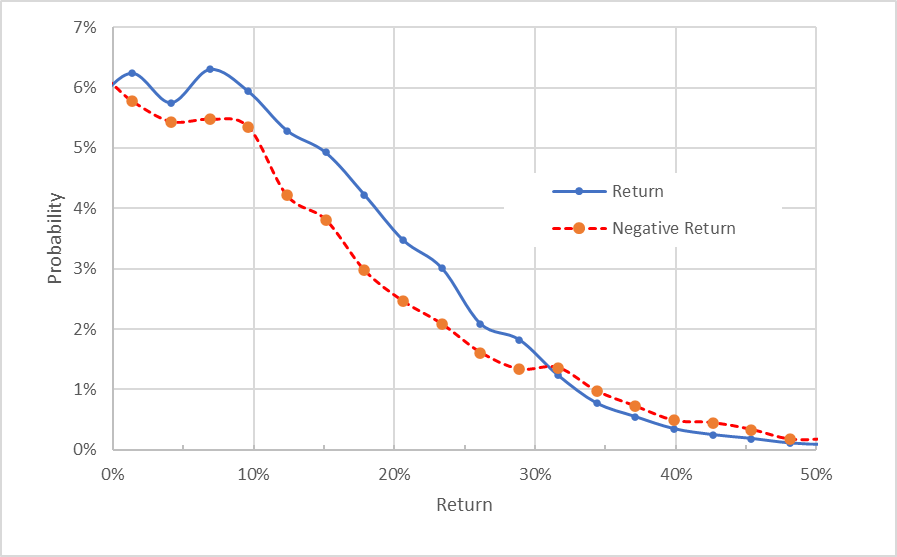
Market-implied price return probabilities for ALL for the 6.4-month period from now until January 20, 2023. The negative return side of the distribution has been rotated about the vertical axis (Source: Author’s calculations using options quotes from ETrade)
This view emphasizes that the probabilities of positive returns are consistently higher than for negative returns of the same magnitude, across a wide range of the most probable outcomes (the solid blue line is above the dashed red line over the left ⅗ of the chart above). This is a bullish market-implied outlook to early 2023.
Theory indicates that the market-implied outlook is expected to have a negative bias because investors, in aggregate, are risk-averse and thus tend to pay more than fair value for downside protection. There is no way to measure the magnitude of this bias, or whether it is even present, however. The expectation for a negative bias strengthens the bullish interpretation of this outlook.
Summary
While ALL has missed the consensus expected EPS over the past 3 quarters, the explanation for the lower-than-expected earnings is reasonable. Auto accidents have increased in frequency and severity as Americans have been driving more as they return to the office and travel. In addition, the costs of auto parts and cars have increased substantially. The expectation for a higher-than-average number of hurricanes this year is also a headwind for the stock. The Wall Street consensus outlook continues to be bullish, however, with a consensus 12-month price target that implies a total return of 13.6% over the next 12 months. As a rule of thumb for a buy rating, I look for an expected return that is at least ½ the expected annualized volatility (28%). ALL falls just below this threshold. The market-implied outlook to early 2023 continues to be bullish. I am maintaining my overall bullish / buy rating for ALL.
Be the first to comment