

primeimages/iStock via Getty Images
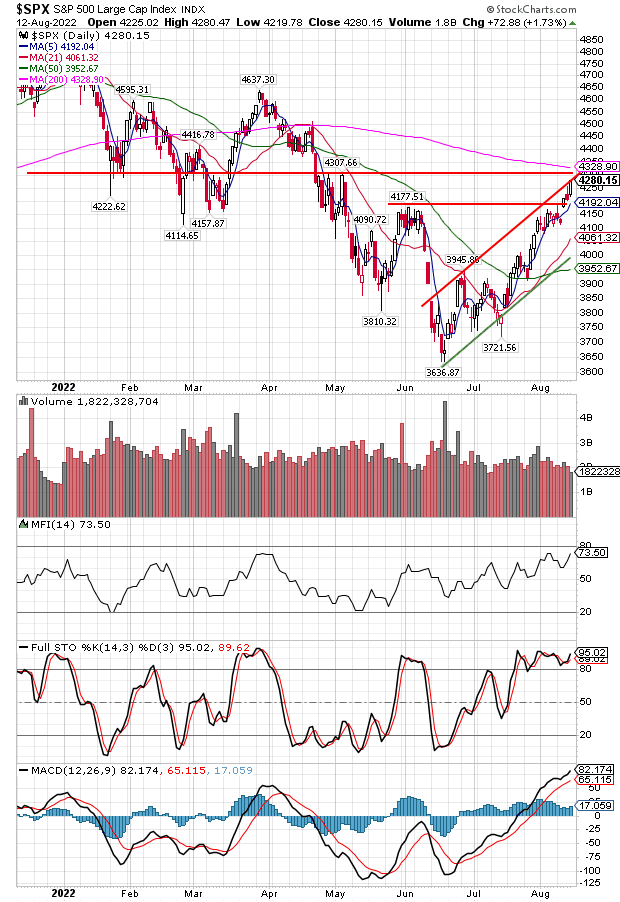
For some equity market strategists, their primary focus in evaluating the market’s future direction is the price action of the market itself as well as the price action of individual stocks. With this noted, this past week’s performance of the S&P 500 Index, up 3.25% and up in four of the last five weeks, has resulted in the index price moving through important technical levels. As the below chart shows, the top panel shows an uptrend trend channel with the price of the S&P 500 Index reaching upper resistance, but having closed above June’s high of 4,177.
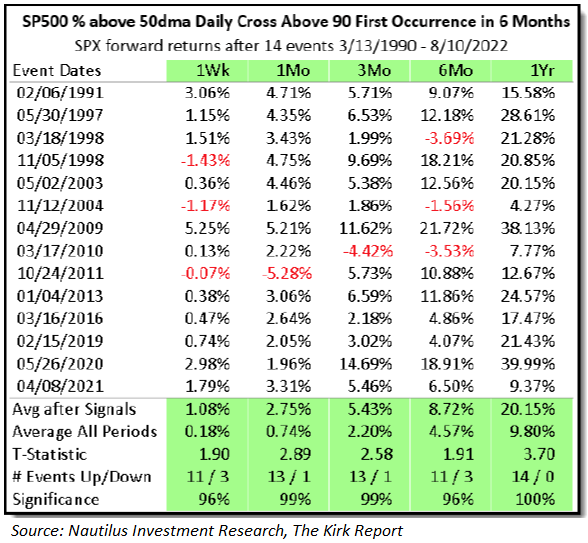
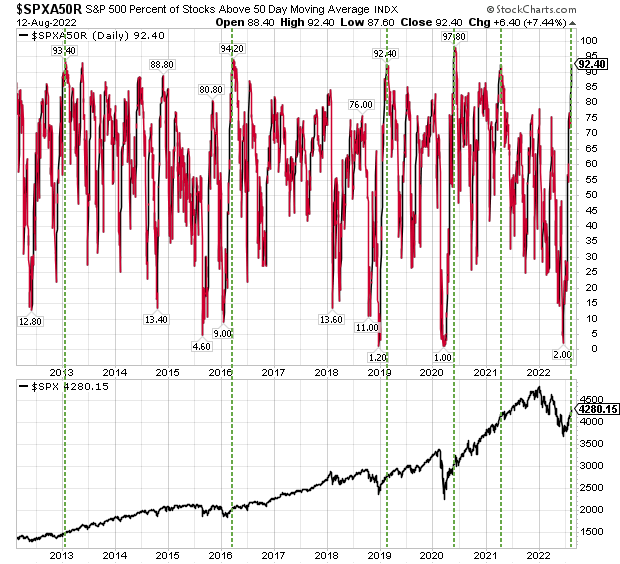
Since the S&P 500 Index’s June low, the market price has rebounded 16.7%. With this move higher in the market, over 90% of the stocks in the index are now trading above their 50-day moving average. As the below table shows, since 1990, this first time move higher above 90% has occurred fourteen times. In each of those instances, the index has been higher one year later 100% of the time. What might be in store for the market with 90% of S&P 500 Index stocks trading above their 50-day moving average?
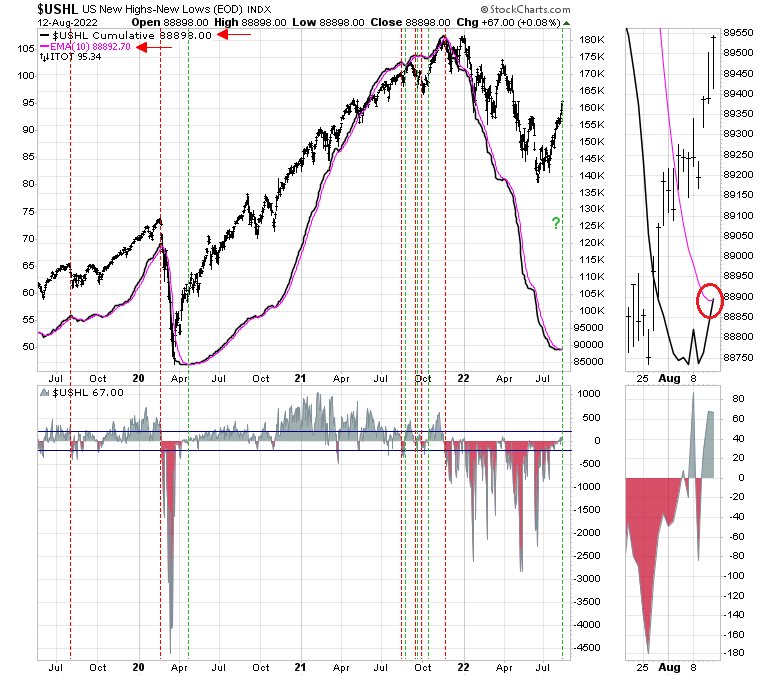
And one more positive technical indicator providing insight into the current market’s momentum is the chart below. The smooth black line on the chart is showing the cumulative new high less new lows index. This index has crossed above its 10-day exponential moving average, the pink line, and historically this has been a bullish indication for further stock price advances. Follow-through is needed on this indicator, but it is another favorable technical development for the market. The other black line on the chart represents the iShares Core S&P Total U.S. Stock Market ETF (ITOT).
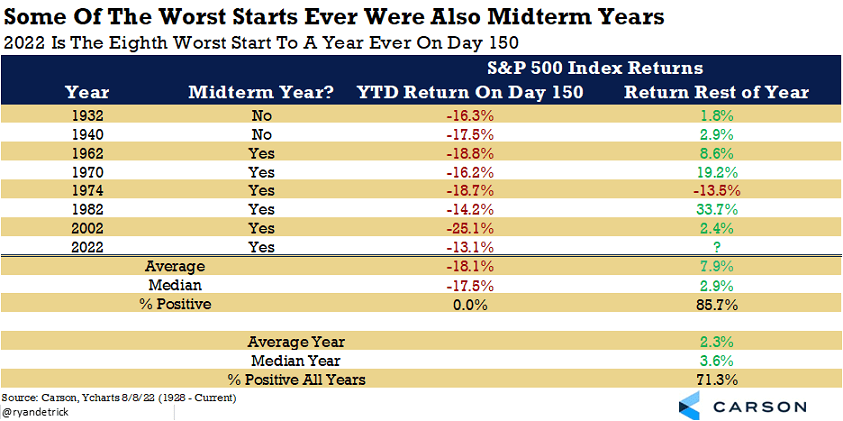
In summary, much has been written recently about the fact this market rebound from the June low is simply a bear market bounce. Certainly, this might be the case and the current market does seem a bit overbought. A near-term consolidation or pullback would not be at all surprising and a healthy market occurrence. Ryan Detrick of Carson Group recently noted though that this year’s market return through August 8 is the eighth worst start to a year since 1932. Six of these eight years are mid-term election years and only one of the seven years saw the entire year generate a negative return.
And, as Charles Kirk of The Kirk Report notes in his weekly technical strategy report this week, “the price action continues to show the kind of strong, sustained and significant improvement following prior major market bottoms. If this rally is going to falter and fail, we should start to see significant signs of it in the price action here and around this next pivot area resistance at S&P 4300 and especially with this new secondary reversal play [higher] which has laid the foundation for a move back toward the early January high.” In short, the market technicals are favorable and a positive finish to the year is not out of the realm of possibilities. The equity market will not achieve this result in a straight line higher though.
Editor’s Note: The summary bullets for this article were chosen by Seeking Alpha editors.
Be the first to comment