

Dow Jones, Nasdaq 100, Treasury Yields, Yield Curve Steepening, Federal Reserve – Talking Points:
- Equity markets lost ground during APAC trade as disappointing US jobs figures weighed on market sentiment.
- The notable widening of the spread between 2-year and 10-year Treasuries could weigh on US benchmark indices.
- Fading momentum suggests a short-term pullback could be on the cards for the Dow Jones and Nasdaq 100.
Asia-Pacific Recap
Equity markets slipped lower during Asia-Pacific trade as a unexpected rise in US jobless claims and climbing bond yields weighed on risk appetite. Australia’s ASX 200 plunged 1.34% on disappointing retails sales data, and Japan’s Nikkei 225 fell 0.72%.
In FX markets, the cyclically-sensitive AUD and NZD largely outperformed their major counterparts, while the haven-associated JPY and USD drifted marginally lower. Gold and silver prices lost ground as yields on US 10-year Treasuries crept back above 1.3%.
Looking ahead, retail sales out of Canada headline the economic docket alongside US manufacturing PMI figures for the month of February.
Climbing Yields May Put Pressure on Equity Prices
US benchmark equity indices could come under increasing pressure in the coming days, as yields on US Treasuries continue climbing higher.
Indeed, the spread between 2-year and 10-year maturities has widened substantially over the last few weeks, on the back of rising inflation expectations, the prospect of additional fiscal stimulus and positive developments in the fight against Covid-19.
However, this could trigger a short-term correction in risk assets, given the 19 basis point rise seen in real rates since the start of the month.
2s10s Yield Curve vs S&P 500 Index

Chart created using Tradingview
That being said, these dynamics may prove short-lived, with the Federal Reserve reiterating its commitment to continue purchasing at least $80 billion of Treasury securities and $40 billion of agency-mortgage-backed securities a month “until substantial progress has been made towards the Committee’s maximum employment and price stability goals”.
Chairman Jerome Powell also stated that its extremely unlikely that the central bank “even think about withdrawing policy support” in the foreseeable future, considering the significant slack still exhibited in the labour force. The number of Americans filing initial jobless claims rose for the second straight week, with 861,000 claims submitted (exp 765,000).
Nevertheless, with the House expected to vote on President Biden’s proposed $1.9 trillion stimulus package next week, yields may extend their recent gains and in turn limit the potential upside for the benchmark Dow Jones and Nasdaq in the coming days.
Dow Jones Futures Daily Chart – RSI Divergence Hints at Near-Term Pullback
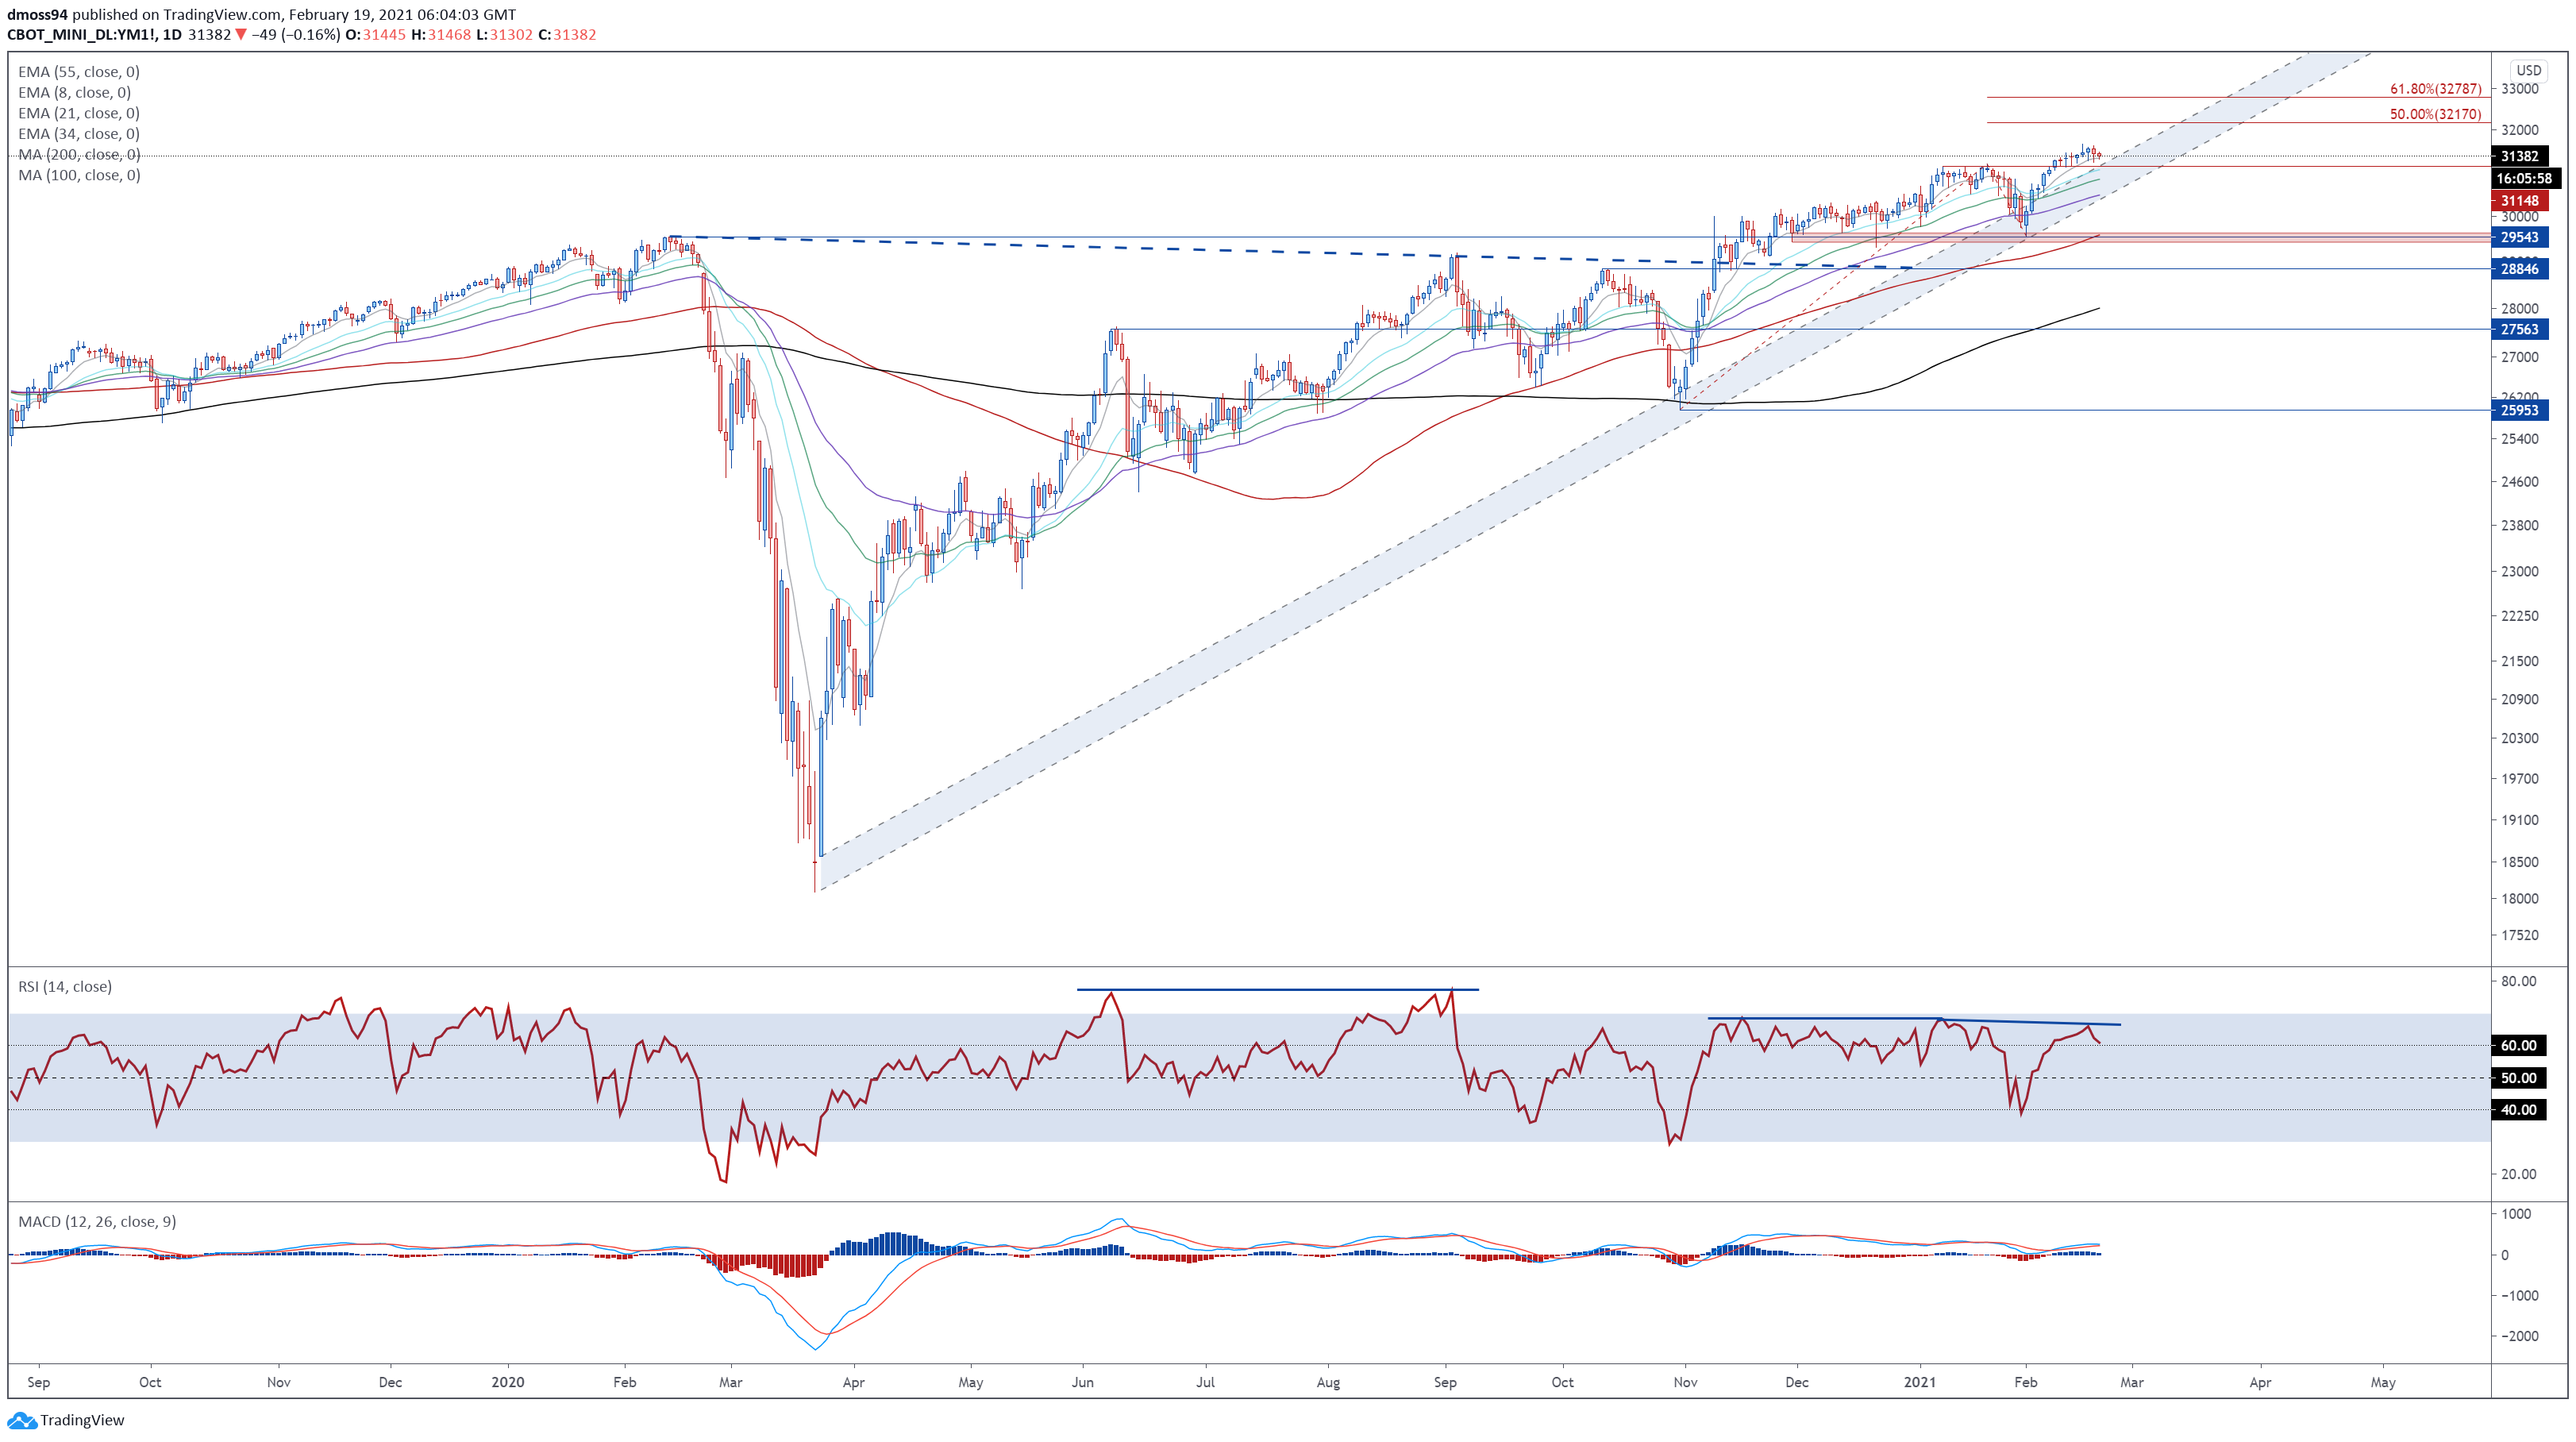
DJIA futures daily chart created using Tradingview
From a technical perspective, the formation of a Hanging Man candle just shy of psychological resistance at 31500 suggests that a short-term pullback could be on the cards.
A bearish crossover on the MACD indicator, in tandem with bearish RSI divergence, also hints at fading bullish momentum.
Sliding back below the 8-EMA (31336) could generate a downside push to retest former resistance-turned-support at the January high (31188). Hurdling that may pave the way for a more extended pullback towards the trend-defining 55-EMA (30483).
However, a daily close above 31600 would probably signal the resumption of the primary uptrend and bring the 50% Fibonacci (32170) into the crosshairs.
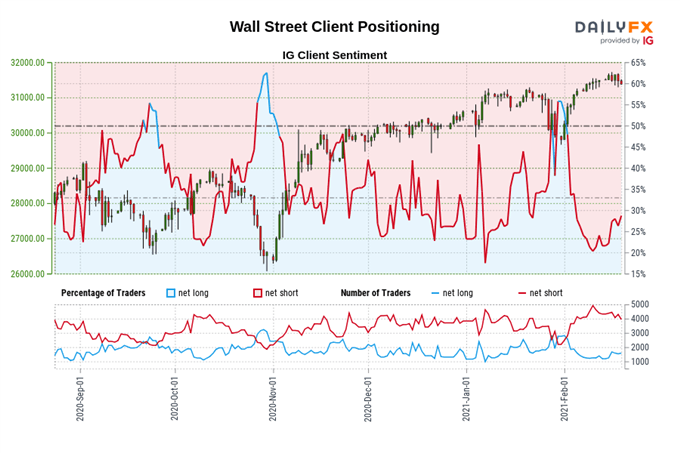
The IG Client Sentiment Reportshows 28.89% of traders are net-long with the ratio of traders short to long at 2.46 to 1. The number of traders net-long is 6.37% higher than yesterday and 16.67% higher from last week, while the number of traders net-short is 9.96% lower than yesterday and 13.17% lower from last week.
We typically take a contrarian view to crowd sentiment, and the fact traders are net-short suggests Wall Street prices may continue to rise.
Yet traders are less net-short than yesterday and compared with last week. Recent changes in sentiment warn that the current Wall Street price trend may soon reverse lower despite the fact traders remain net-short.
Nasdaq 100 Futures Daily Chart – Perched Precariously Above Key Support
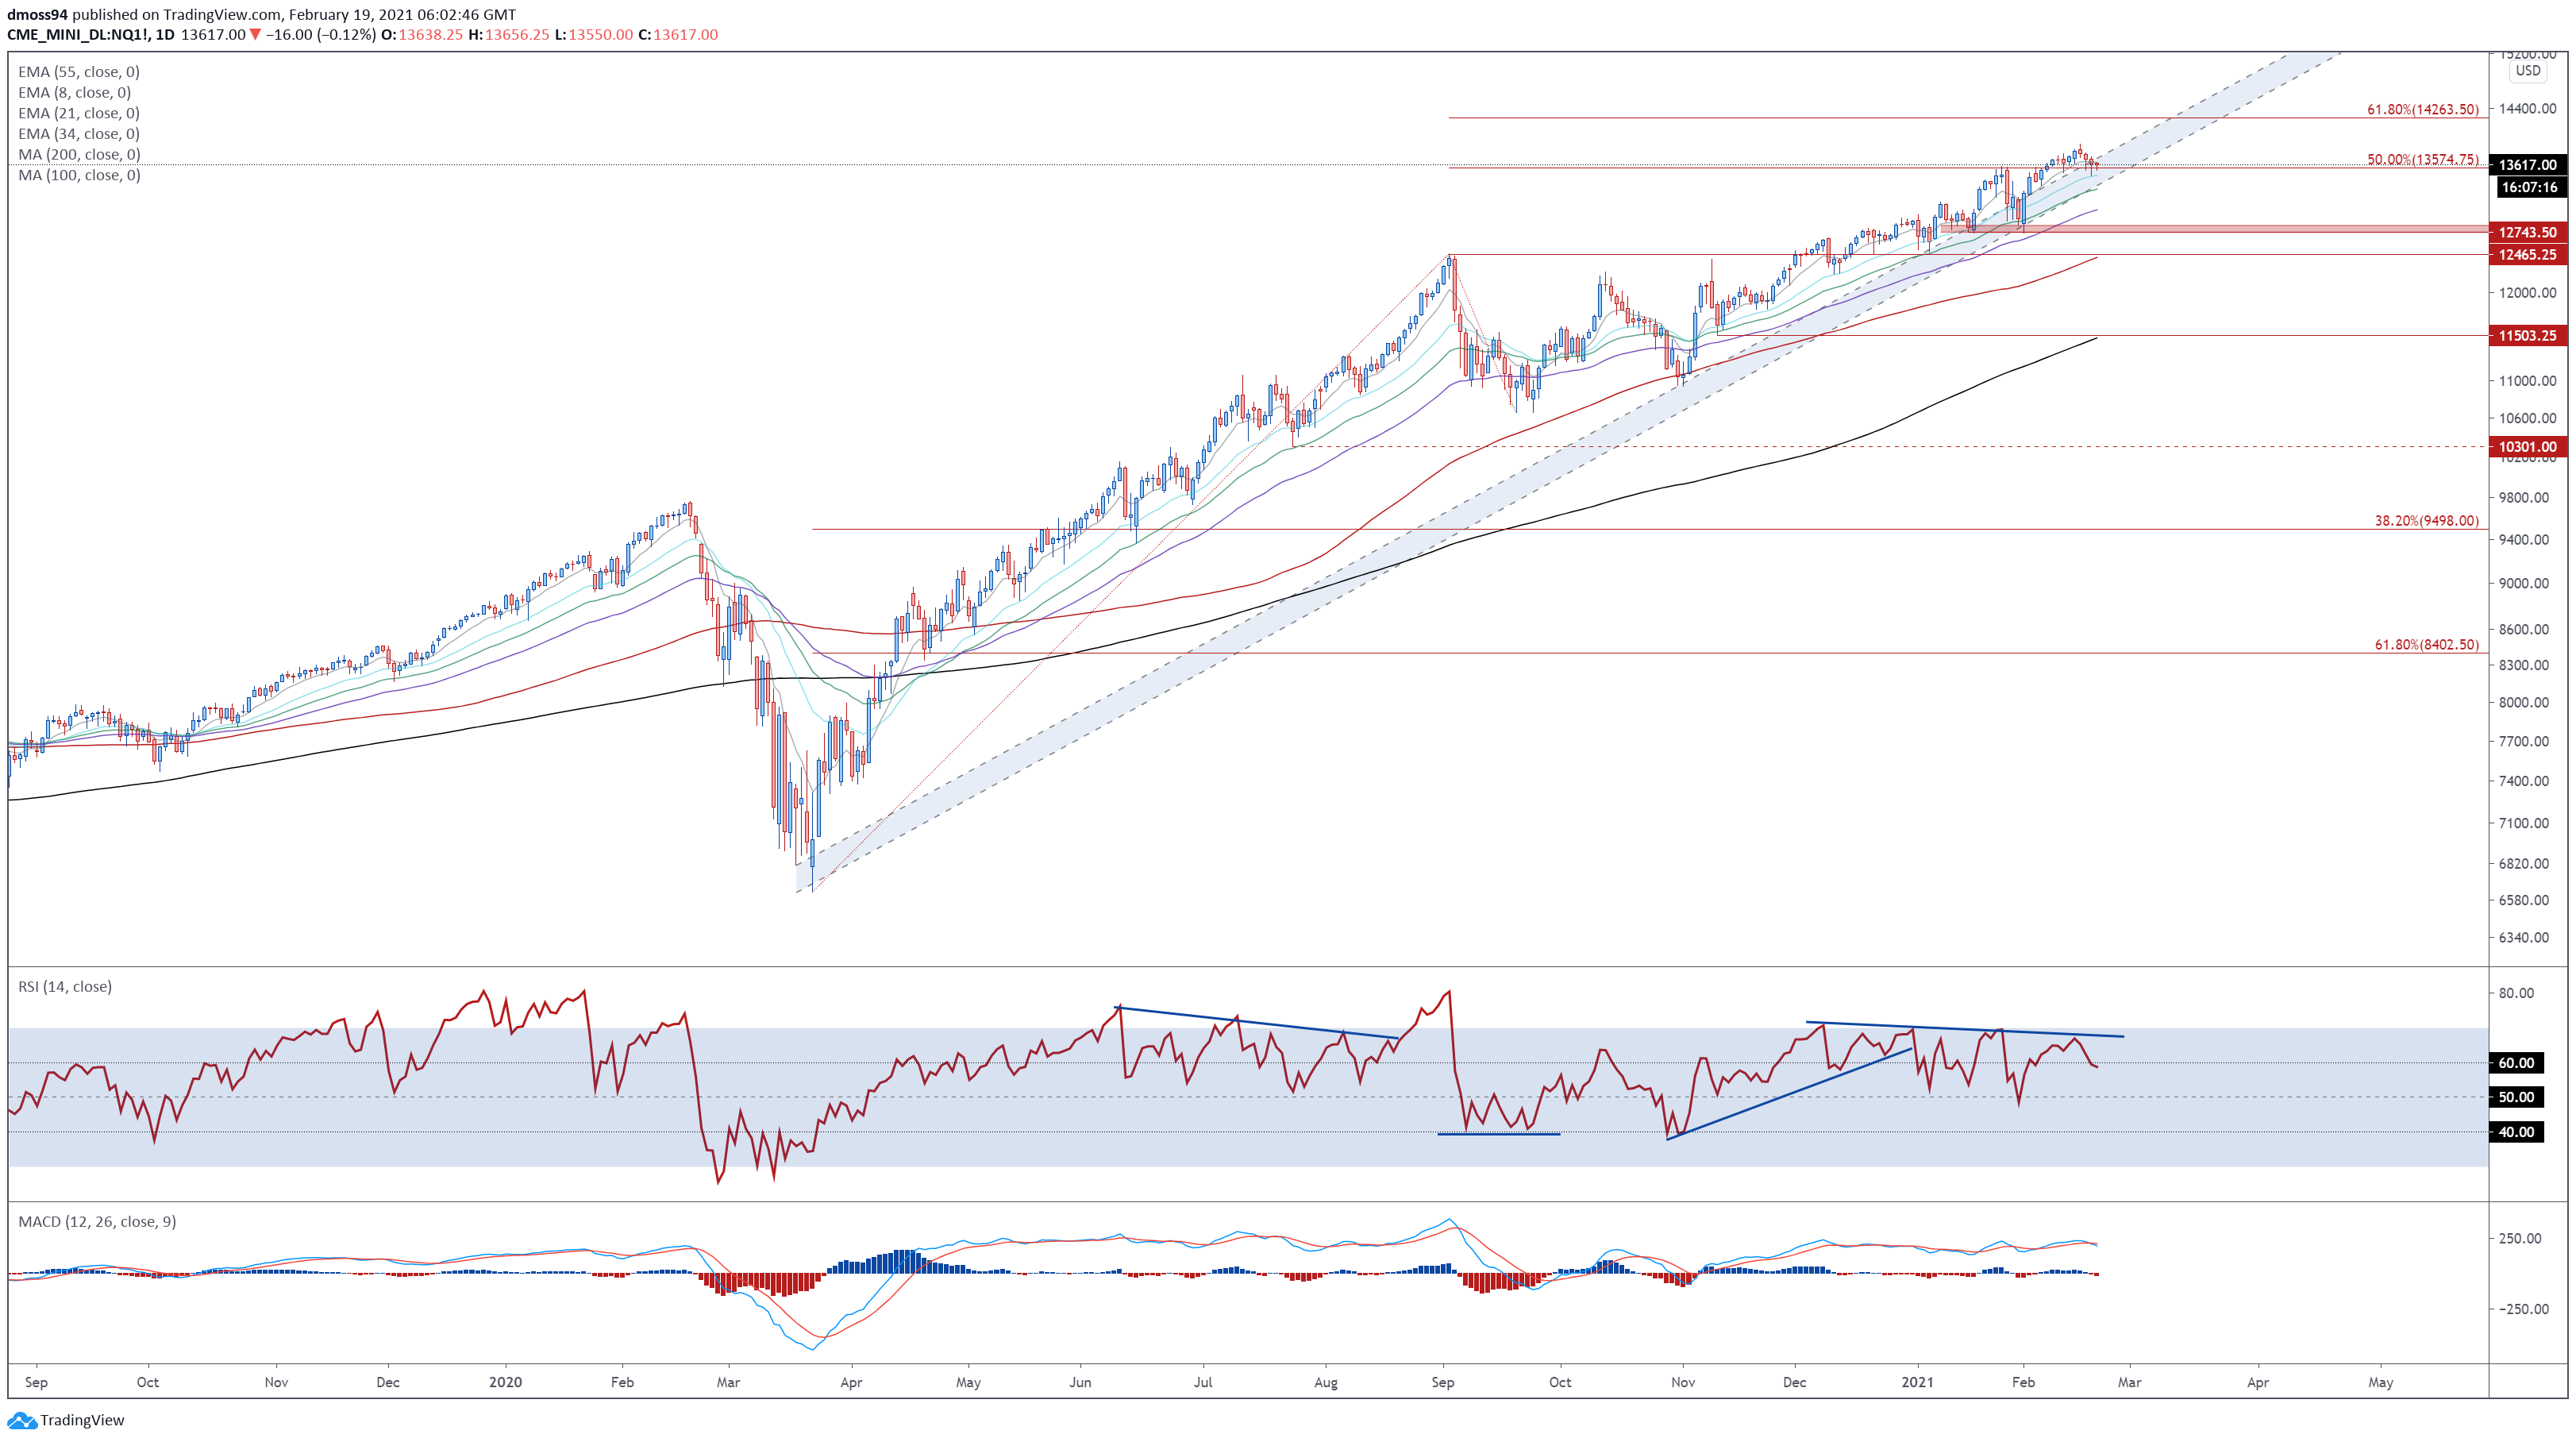
Nasdaq 100 futures daily chart created using Tradingview
The tech-heavy Nasdaq 100 also looks at risk of a near-term pullback, as price slides back to key support at the 50% Fibonacci (13575).
A bearish MACD crossover and RSI divergence suggest that recent topside push could be running out of steam, leaving it vulnerable to a correction lower in the coming days.
With that in mind, a daily close below the 21-EMA (13480) may encourage would-be sellers and pave the way for a challenge of confluent support at the uptrend extending from the March 2020 nadir and the 34-EMA (13298).
A convincing breach of that brings the trend-defining 55-EMA (13029) into the crosshairs. However, if 13500 remains intact, price could rebound back towards the record high set on February 16 (13900).
— Written by Daniel Moss, Analyst for DailyFX
Follow me on Twitter @DanielGMoss

Recommended by Daniel Moss
Top Trading Lessons
Be the first to comment