

Brandon Bell
The Chart of the Day belongs to the energy company Exxon Mobil (XOM). I found the stock by sorting Barchart’s All Time High list first by the most frequent number of new highs in the last month and having a Trend Spotter buy signal then used the Flipchart feature to review the charts for consistent price appreciation. Since the Trend Spotter first signaled a buy on 10/5 the stock gained 6.80%.
XOM Price vs Daily Moving Averages ( )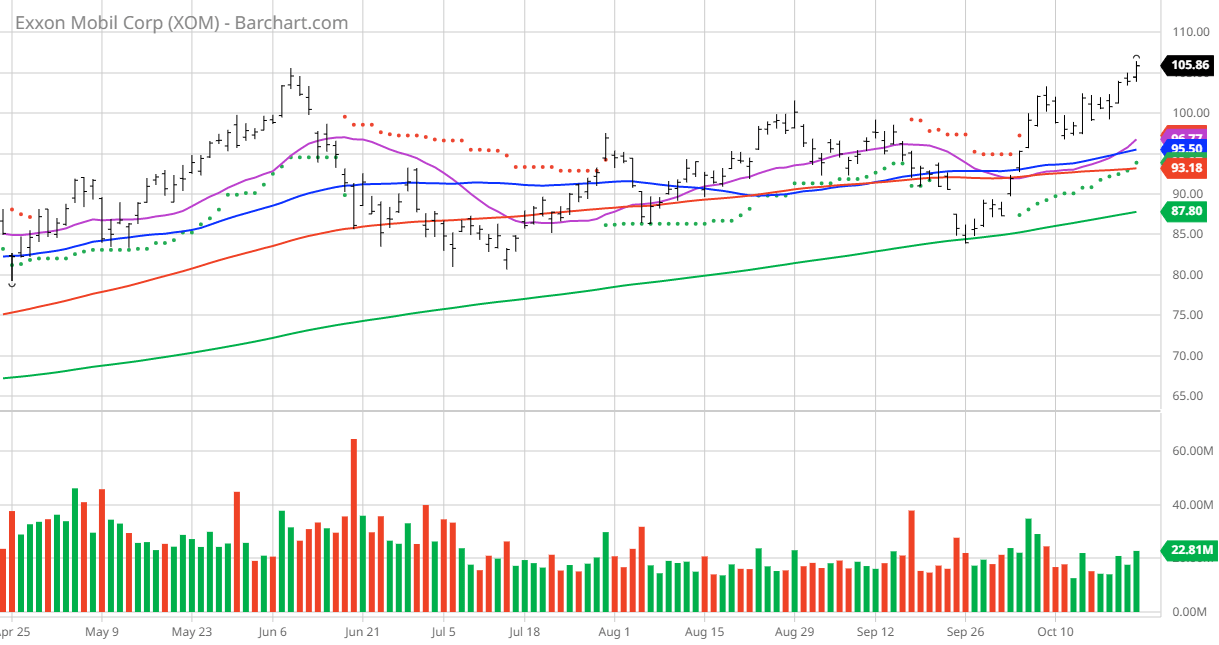
Exxon Mobil Corporation explores for and produces crude oil and natural gas in the United States and internationally. It operates through Upstream, Downstream, and Chemical segments. The company is also involved in the manufacture, trade, transport, and sale of crude oil, natural gas, petroleum products, petrochemicals, and other specialty products; manufactures and sells petrochemicals, including olefins, polyolefins, aromatics, and various other petrochemicals; and captures and stores carbon, hydrogen, and biofuels. As of December 31, 2021, it had approximately 20,528 net operated wells with proved reserves. The company was founded in 1870 and is headquartered in Irving, Texas.
Barchart’s Opinion Trading systems are listed below. Please note that the Barchart Opinion indicators are updated live during the session every 20 minutes and can therefore change during the day as the market fluctuates. The indicator numbers shown below therefore may not match what you see live on the Barchart.com website when you read this report.
Barchart Technical Indicators:
- 100% technical buy signals
- 67.00+ Weighted Alpha
- 68.76% gain in the last year
- Trend Spotter buy signal
- Above its 20, 50 and 100 day moving averages
- 8 new highs and up 16.32% in the last month
- Relative Strength Index 66.99%
- Technical support level at 104.41
- Recently traded at 105.86 with 50 day moving average of 95.50
Fundamental factors:
- Market Cap $441 billion
- P/E 10.53
- Dividend yield 3.39%
- Revenue expected to increase 62.60% this year but be down 3.20% next year
- Earnings estimated to increase 141.60% this year, decrease 15.20% next year and continue to compound at an annual rate of 25.52% for the next 5 years
Analysts and Investor Sentiment — I don’t buy stocks because everyone else is buying but I do realize that if major firms and investors are dumping a stock it’s hard to make money swimming against the tide:
- Wall Street analysts have 6 strong buy, 8 buy, 14 hold and 1 under perform opinion on the stock
- The Analyst’s price targets are from 77.00 to 134.00 with an average of 107.96
- The individual investors following the stock on Motley Fool voted 8,066 to 564 for the stock to beat the market with the more experienced investors voting 1,308 to 90 for the same result
- 440,470 investors are monitoring the stock on Seeking Alpha
Ratings Summary
Factor Grades
Quant Ranking
Sector
Industry
Ranked Overall
Ranked in Sector
Ranked in Industry
Quant ratings beat the market »
Dividend Grades
Be the first to comment