

Brandon Bell/Getty Images News
The Thesis
Exxon Mobil (NYSE:XOM) has surged over the past year, crushing the S&P 500, and leaving investors to wonder, “Is now the time to sell high?”
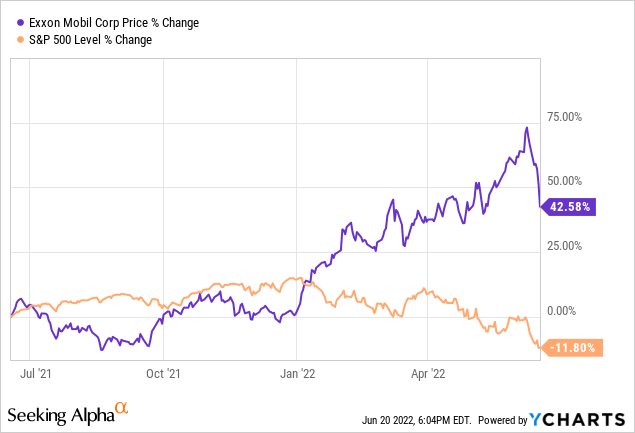
To sell or not to sell is a complicated question, but investors can make prudent decisions by analyzing the facts. As XOM shares surge, we estimate returns of just 6% per annum in the decade ahead.
Oil, The Past And The Future
Exxon Mobil was once the most valuable company in the world, but it has since been usurped by big tech. Could Exxon wear the big-cap crown once again? As the market crashes, the pendulum swings.
Largest companies in the world by market cap (2009):
Largest Companies In The World By Market Cap – 2009 (Visual Capitalist)
While in 2020 we saw all supply and no demand, the pendulum has since shifted dramatically. Big oil underinvested in exploration over what was a turbulent decade for the industry. Now it seems the world is running out of oil again, and it is. The world is projected to run out of oil by 2052. Meanwhile, with gasoline prices soaring, Joe Biden is urging oil companies to boost supply.
History of Brent Crude prices:
Brent Crude Prices (Statista)
Oil prices are still around where they were back in 2012. Since then, the M2 money supply in the United States has increased 220%. Does that mean the price of oil can go 220% higher? We hope not; that would be terrible for the world economy. But it is fair to say that oil is unlikely to go back to its lows of 2016 and 2020.
A Comparative Analysis
Excluding Saudi Aramco (ARMCO), these are the world’s largest oil and gas companies by market cap:
| As of Jun 17, 2022 | Shell (SHEL) | Chevron (CVX) | Exxon (XOM) | PetroChina (PTR) |
| Forward P/E | 5.2 | 8.8 | 8.4 | 5.1 |
| Price to Book | 1.1 | 2.0 | 2.1 | 0.5 |
| Free Cash Flow Yield | 16.7% | 8.5% | 11% | 15.5% |
| Dividend Yield | 3.6% | 3.8% | 4.1% | 6.4% |
| Working Capital | $39 Billion | $13.5 Billion | $5 Billion | $0 |
As you can see, you have to pay a premium to own the U.S. companies. However, Exxon and Chevron carry less long-term debt on their balance sheets. They also have more proven oil reserves:
Proven Oil Reserves By Company (Statista)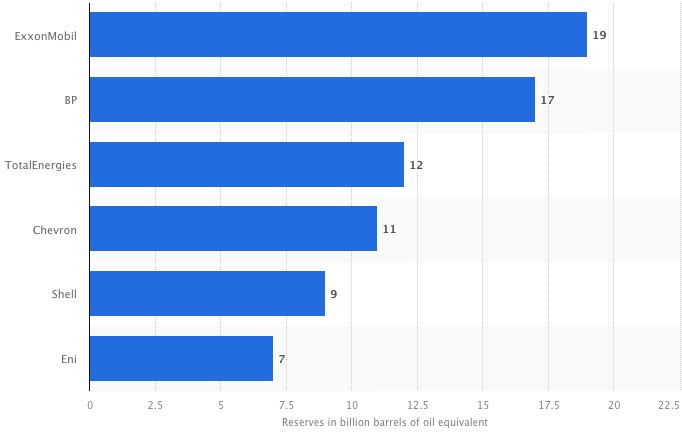
These oil reserves represent the longevity of each company’s current upstream business. However, this is not the be-all and end-all of an oil and gas company as it does not include the downstream side of the business, nor its energy transition initiatives.
Exxon’s Cash Flow Kingdom
Exxon’s Earnings By Segment (2021):
ExxonMobil’s Earnings By Segment (Annual Report)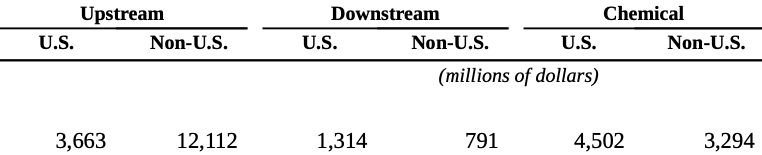
- Note: The above does not include the corporate and financing segment.
Exxon has an integrated business model, owning both the upstream and the downstream. During periods of high oil prices, like today, most of the company’s profits come from the upstream segment (exploration and production). However, during periods of low oil prices, like 2016, most of the company’s profits come from the downstream segment (refining and distribution). Exxon should in theory have positive cash flows in either environment. During the pandemic shutdowns of 2020, however, people stopped using petroleum products altogether causing Exxon to report negative free cash flow.
ExxonMobil’s Net Income History (Macrotrends)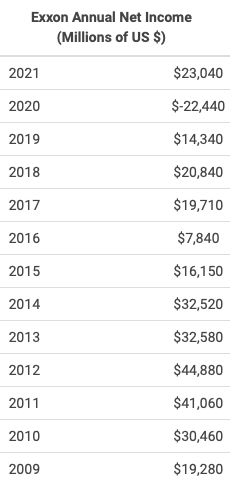
Exxon Mobil looks cheap on a forward P/E basis, but commodity companies are notoriously cyclical. The cyclically adjusted price to earnings (CAPE) ratio for the company is 19x. If we use the average free cash flow over the past 10 years, Exxon looks even more expensive, with a CAPE ratio of 29x. Historically, this indicates a real long-term return of 3% per annum.
- We believe the company’s net income of $25.8 billion is a better representation of its true earnings than the company’s free cash flow of $40.1 billion.
Exxon has been grossly underspending on capital expenditures, totalling just $13.6 billion over the past 12 months. Meanwhile, the company has depreciation and amortization of $24.5 billion. From 2022 to 2027, the company is guiding towards CapEx in the range of $20 billion to $25 billion.
Long-term Returns
Our 2032 price target is $109 per share, indicating a return of 6% per annum with dividends reinvested.
Exxon’s net income over the past 12 months was $25.79 billion, amounting to earnings of $6.12 per share on the current shares outstanding. Brent Crude was between $65 and $125 over this period, which is a pretty reasonable range to begin our projection from. Keep in mind that oil prices can go lower intermittently. Exxon’s break-even price is reported to be around $41 per barrel.
The Balance expects oil prices of $66 per barrel in 2025, $89 in 2030, and $132 in 2040. This indicates we may be at a near-term peak in the price of the commodity. With electric vehicles taking to the road, oil demand will eventually peak; estimates range from 2025-2035. However, as the world runs out of the precious resource, the price should continue to rise as a result of scarcity.
We estimate EPS growth of 4.5% per annum, resulting in 2032 earnings of $9.50 per share. This is the result of a low buyback yield and oil demand peaking around 2030. We have assigned a terminal multiple of 11.5 for a business that will benefit from high prices on its remaining reserves, but will need to reinvent itself as the industry faces secular decline.
Conclusion
Exxon Mobil faces a complicated future. With a break-even price of $41 per barrel and Brent Crude prices hovering around $115 per barrel, XOM is headed for huge profits in 2022. However, if we look closer, we see an industry headed for secular decline. Exxon has huge oil reserves and a fantastic integrated model. But, as the price of XOM follows oil up, future returns get squeezed. We have a “hold” rating on the stock and estimate returns of just 6% per annum in the decade ahead.
Be the first to comment