

JHVEPhoto/iStock Editorial via Getty Images
Company Snapshot
Exxon Mobil (NYSE:XOM) is one of the foremost energy companies with a presence across the entire value chain. XOM’s integrated business model across upstream, downstream, chemical, and low-emission businesses brings a degree of resilience to the operating model. The company currently reports under three divisions- Upstream, Product Solutions, and Low Carbon Solutions.
What Is XOM’s Bullish View?
XOM is in an admirable position at the moment as they were prescient enough to still invest $13bn in exploration and development activities in 2020 when most other competitors were laying low. On account of that foundation, XOM has been able to ramp up production with great alacrity and take advantage of the attractive average realizations that have been prevalent in the energy space in 2022. XOM looks well poised to exploit conditions here for the foreseeable future, as additional investments in the upstream industry are still not quite keeping pace with the rate at which existing resources are being depleted.
In H1, XOM’s Permian basin production was up by 130kbbl/day and will likely witness 25% of growth for the second successive year by the end of FY22. In Guyana as well, note that their Liza Phase 2 production kicked off in Q1, and alongside Liza Phase 1, they currently have a total capacity of 340kbbl/day. A third project-Payara is running ahead of schedule and is due to come on board before the end of FY23. All in all, the company’s Guyana ventures have proven to be very useful as the total number of discoveries has exceeded 25.
One can also commend XOM for the quality of its investments, and the value it extracts from them; a proxy here would be the Return on Capital Employed (ROCE) metric, which is currently in double-digit terms, and also best-in-class, well ahead of other peers who only witness single-digit ROCEs.
Investor Day Presentation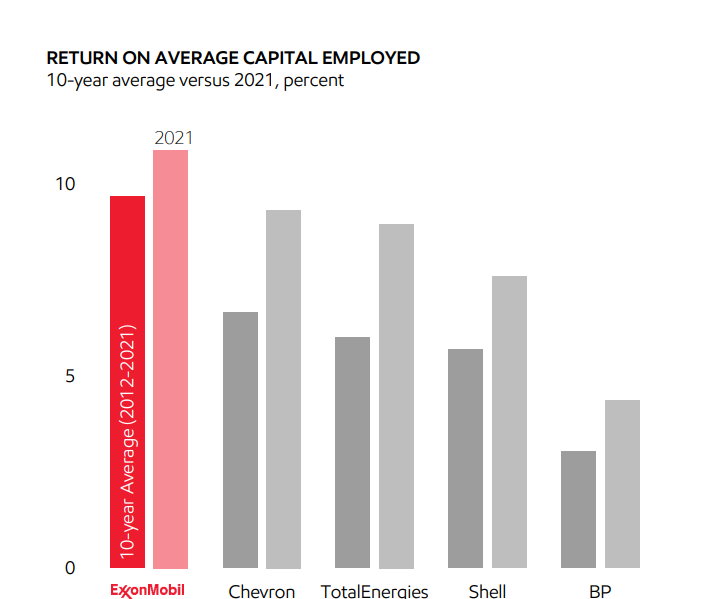
I’d like to think that this could well continue, as their upcoming upstream investment plans are oriented towards projects that can at least provide returns of 10% when crude is less than or equal to $35/bbl; All in all, XOM’s goal is to get to 14% ROCE by 2025 (17% by 2027).
On account of the elevated price realizations this year, and the volume uptake that XOM has been witnessing, cash flow generation too is a highly attractive facet (last year XOM generated $48bn in operating cash flow and intends to generate another $40bn this year). Considering the heightened level of operating cash flow that is being generated, I’d like to think that the XOM stock offers good value. Admittedly, XOM is not the only major integrated O&G stock to trade at a P/OCF (Price/operating cash flow per share) discount versus its long-term average (9.6x), but the discount is still more attractive than the peer set discount average of 33% (only BP and TotalEnergies trade at deeper discounts).
YCharts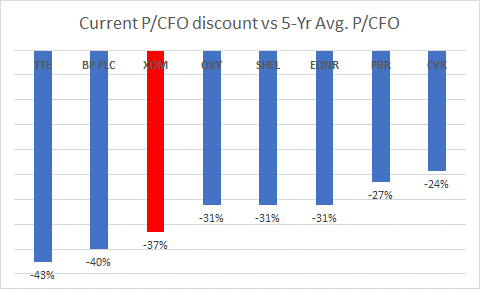
The strong operating cash flow generation also enables Exxon to comfortably meet its CAPEX requirements leaving ample FCF. Incidentally, at the current share price, Exxon’s FCF yield is at an impressive level of 12.6%, the highest it’s been in 10 years, and exactly 3x higher than its 5-year average
YCharts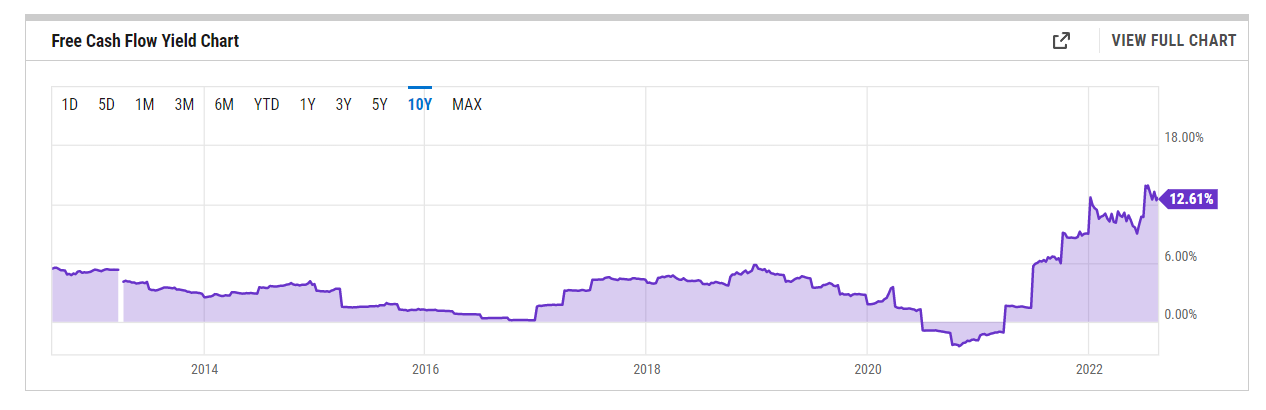
It’s also fair to say that Exxon has the balance sheet to withstand a prolonged down cycle (if it were to happen, which is not the base case). Last year they paid down $20bn worth of long-term debt (and this year they intend to pay down another $2bn), and currently, their debt to capital ratio is only at 20%, which is at the lower end of their target range of 20-25%. Exxon currently has $19bn of cash on its books, this is almost 3x as much as what they had at the start of the year! It now appears that the management is not satisfied with that and is looking to build an even greater cash buffer to the tune of $20-$30bn. All in all, do consider that the net financial debt is currently down to $28bn, the lowest it’s been since Q1-15.
YCharts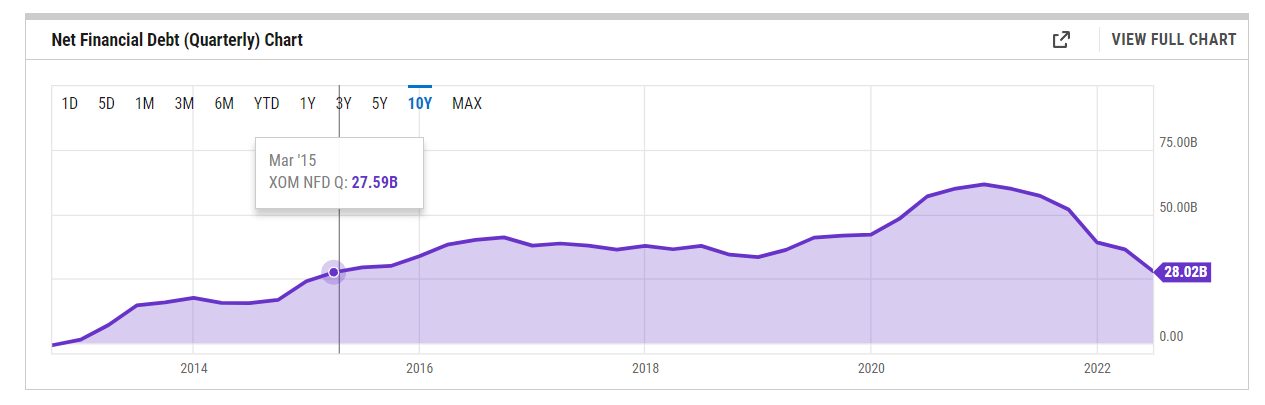
The Inflation Reduction Act (IRA) which recently came into play last week should also be supportive for XOM’s stature in the States.
Firstly, earlier versions of the bill had suggested that there would be increased penalties for abandoning wells on Federal lands; that did not come to pass. In addition to that, Biden’s plans to halt the Federal leasing program have not come to fruition; the IRA now has a provision that calls for the Federal government to not only auction oil and gas (O&G) leases on Federal land and the Gulf of Mexico, but to also give auction precedence to O&G entities before they auction their acreages for wind and solar parties.
Longer-term as well, this bill which includes large tax credits, would augment XOM’s parallel objectives in deepening its impetus in the low-carbon universe and could make it a very prominent player here. Currently, XOM is deploying resources in avenues such as biofuels and carbon capture, where ROIs are understandably low and gestation periods are longer. Smaller companies won’t quite be able to deploy ample funds here, but a company like XOM can always lean on their traditional business and bankroll this initiative. These recent tax breaks only sweeten the pot.
What Is XOM’s Bearish View?
There’s little doubt that the economic conditions in the world’s largest importer of oil (China), have gone for a toss; you can’t dismiss the impact this will have on aggregate demand. Then, on the supply side, do consider that the number of rigs in the US is now not too far away from the pre-pandemic range.
US Rig count (YCharts)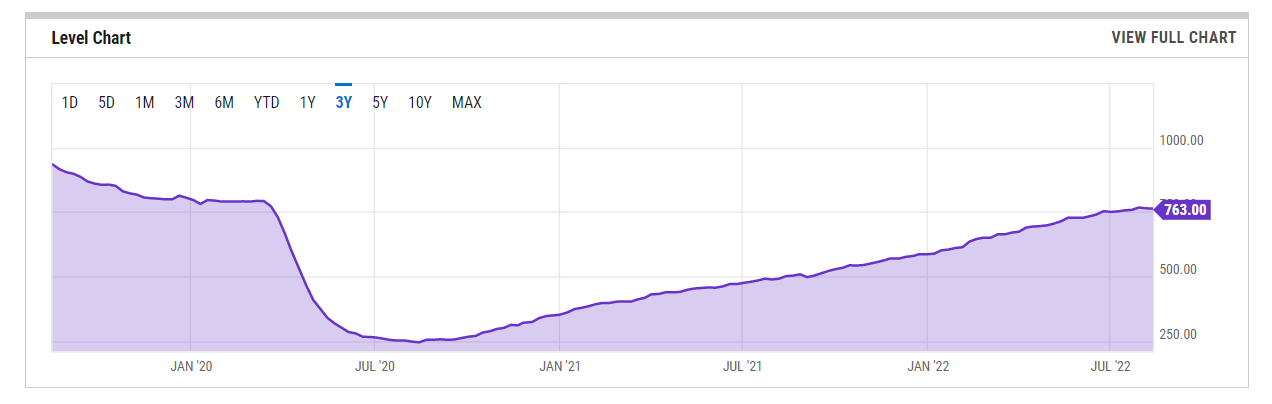
I would also point to recent developments with Iran’s nuclear deal which appears to be back on the table. If this passes, then you’re initially likely to see additional supply worth 2.5 million barrels per day (which could potentially increase to 3.5 million barrels per day over time).
And the issues aren’t linked to crude alone; think about XOM’s chemical business where volumes were impacted on account of the Chinese lockdowns. The ongoing stop-start nature of the Chinese economic progress isn’t going to move the dial significantly. XOM management also spoke about ” large chunks” of supply coming on board in the chemical industry, both in North America and China. All in all, it’s worth noting that chemical margins have come off significantly from what we saw last year, and it is currently very close to the lower end of the broad 10-year annual range.
Also consider that XOM is in the midst of carrying out a long-term structural cost reduction program, whereby the management plans to bring through $9bn of aggregate savings by 2023. However, even if this were to come to fruition, do consider that Exxon will still continue to witness earnings de-growth in FY23 and FY24. For instance, in FY23, consensus estimates point to an EPS of only $10.48 (FY24: $8.65), this would imply annual de-growth of ~17%. In effect, the declining trajectory of the EPS base makes the XOM stock an expensive proposition on a forward P/E basis. At the current share price, an FY23EPS of $10.48 translates to a forward P/E of 8.72x, which is 48% greater than the 5-year average forward P/E multiple of 5.9x.
YCharts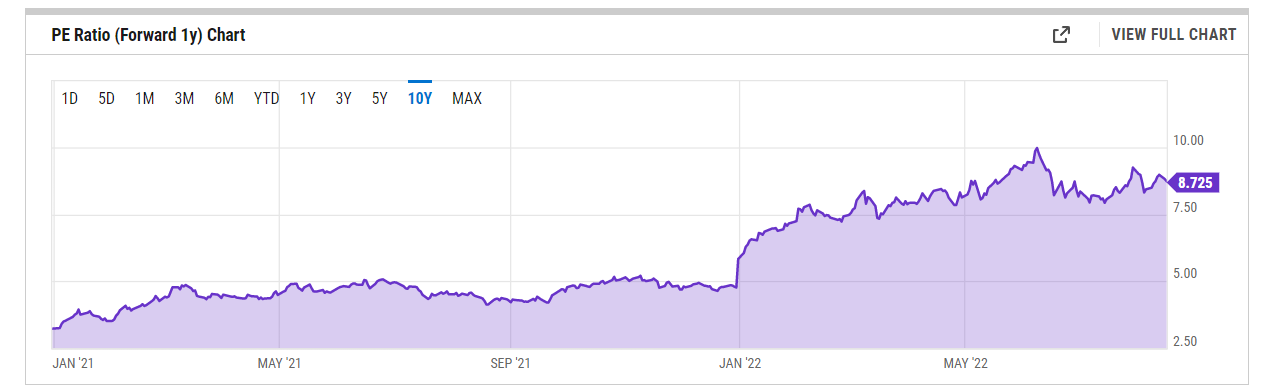
Whilst XOM’s current cash flow generating ability ought to be appreciated, questions can certainly be raised about the company’s hesitance to channelize this largesse via greater distributions. It’s not as though the company is struggling to fund its internal priorities. Take, for instance, the CAPEX coverage. Over the last five years, the quarterly CAPEX cover via XOM’s quarterly operating cash flow has typically only averaged a little over 2x. However, in recent quarters, that cover has even managed to cross the 5x mark!
YCharts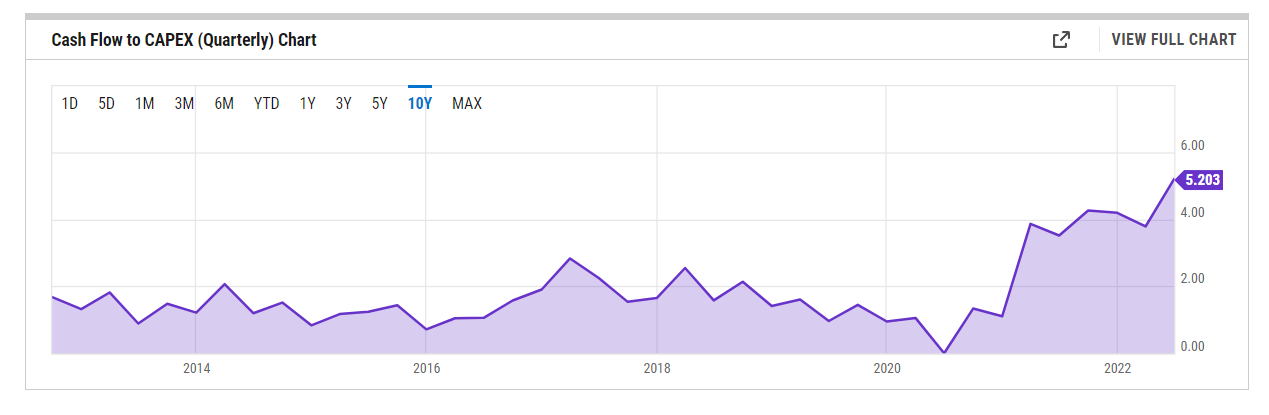
Their dividend outflow over the last three years has come in at less than $15bn per annum. As of H1-22, they’ve spent less than $7.5bn on dividends so one can expect even this year’s outflow to be in the ballpark of that $15bn range. Now, according to their Investor Day Presentation earlier this year, they intend to generate over $40bn in operating cash flows for FY22, which is over 2.6x the level of dividends! XOM’s miserly mindset towards distributions is even more galling when you consider that they recently announced divestments to the tune of $3bn; couldn’t at least half of this been directed towards shareholders?
Even if you happen to be content with XOM’s dividend policy, it’s not as though the current price point is the most optimal point to get in. At the current price point, the dividend yield only works out to 3.85%, which is a good 150bps lower than XOM’s 5-year average dividend yield of 5.35%. Besides, when you bring other peers from the integrated oil and gas universe into the equation, XOM’s yield is a lot less appealing, as the current average yield for the industry is a lot higher at 5.67%!
Technically as well, I don’t believe it makes great sense to be entering the XOM stock at this juncture; firstly, what we have, is a rather steep ascending channel, with the price now closer to the upper boundary of the channel. Also, history has shown us that when the XOM stock enters the $90-$105 range, there’s never been any follow-through (we’ve seen this play out most notably in 2007/2008, 2013/2014, and 2016) and the price action typically reverses from here.
Investing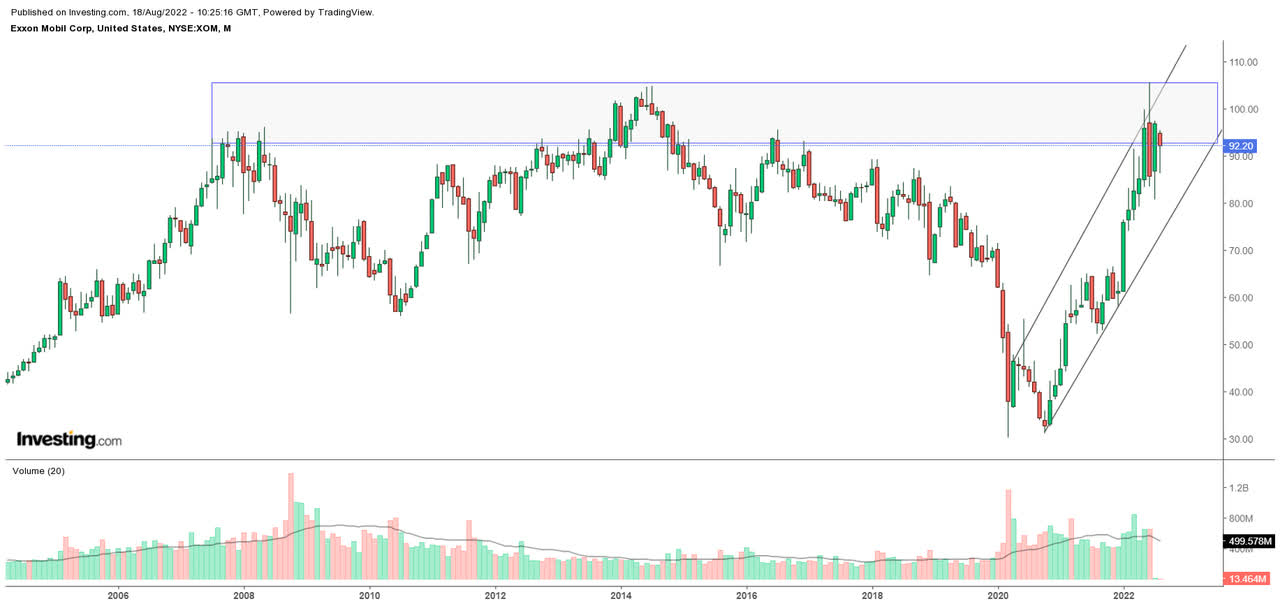
Besides, when you juxtapose the XOM stock’s relative strength versus the broad energy sector (as represented by the Vanguard Energy ETF), I don’t see any great incentive to rotate to XOM, as the RS ratio is now trading a little above the mid-point of the long-term range.
StockCharts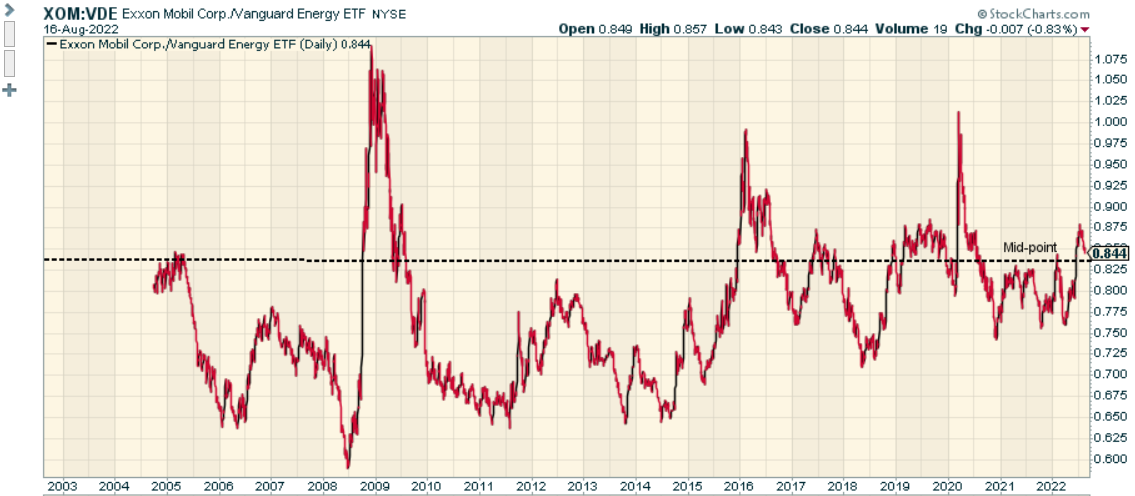
Finally, also consider that the smart money has recently decided to trim their positions in XOM; data from YCharts show that 4473 institutions owned 4.025bn shares at the start of Q2-2022. At the start of August, the number of institutions owning the XOM stock was down to 4286, even as the aggregate shares owned dropped to 4.015bn. It appears that sentiment has shifted in this counter.
Closing Thoughts – Is Exxon Mobil Stock A Buy, Sell, Or Hold?
One can always extract a plethora of positive and negative sub-plots from the gigantic world of Exxon Mobil, and whilst I may not have covered all of them, I hope I’ve managed to make reasonable arguments for both the bulls and the bears.
To conclude, whilst Exxon Mobil currently appears to have the wind in its sails and a lot of attractive qualities, at this relatively elevated price point, I wouldn’t be too enthused to commence a long position in XOM stock. I rate Exxon Mobil stock as a HOLD.
Be the first to comment