

Brandon Bell
Introduction
Exxon Mobil Corporation (NYSE:XOM) announced its earnings for the third quarter of 2022 on October 28, 2022.
Note: This article is an update of my article published on July 26, 2022. I have followed XOM quarterly on Seeking Alpha since January 2017.
1 – 3Q22 results snapshot
Exxon Mobil posted adjusted quarterly earnings of $4.45 per share, beating analysts’ expectations, compared to $1.58 per share last year.
Total revenues of $112.07 billion also beat expectations. They were up significantly from the year-earlier figure of $73.79 billion.
The better-than-expected earnings were due to higher realized commodity prices, oil-equivalent production, and strong refining margins. The company said it achieved the best-ever quarterly refining throughput in North America and the highest globally since 2008.
The company is also investing in carbon capture. Exxon Mobil signed the largest-of-its-kind commercial agreement to capture and permanently store up to 2 million tons of CO2 emissions annually.
Asset sales and divestments resulted in $2.7 billion in cash proceeds during the quarter, bringing year-to-date proceeds to nearly $4 billion.
Finally, XOM declared a fourth-quarter dividend of $0.91 per share, an increase of $0.03 per share. The company repurchased year-to-date $10.5 billion in shares, consistent with the company’s plan to repurchase up to $30 billion of shares through 2023.
In short, it was an exceptional quarter.
CEO Darren Woods said in the conference call:
Overall, I’m pleased with our third quarter operational and financial results. Higher natural gas realizations, strong refinery throughput, robust refining margins and rigorous cost control drove our earnings improvement.
3Q22 Highlights:
XOM 3Q22 Highlights (XOM Press release)
Below is shown the EPS since 1Q18.
XOM Quarterly Earnings diluted history (Fun Trading)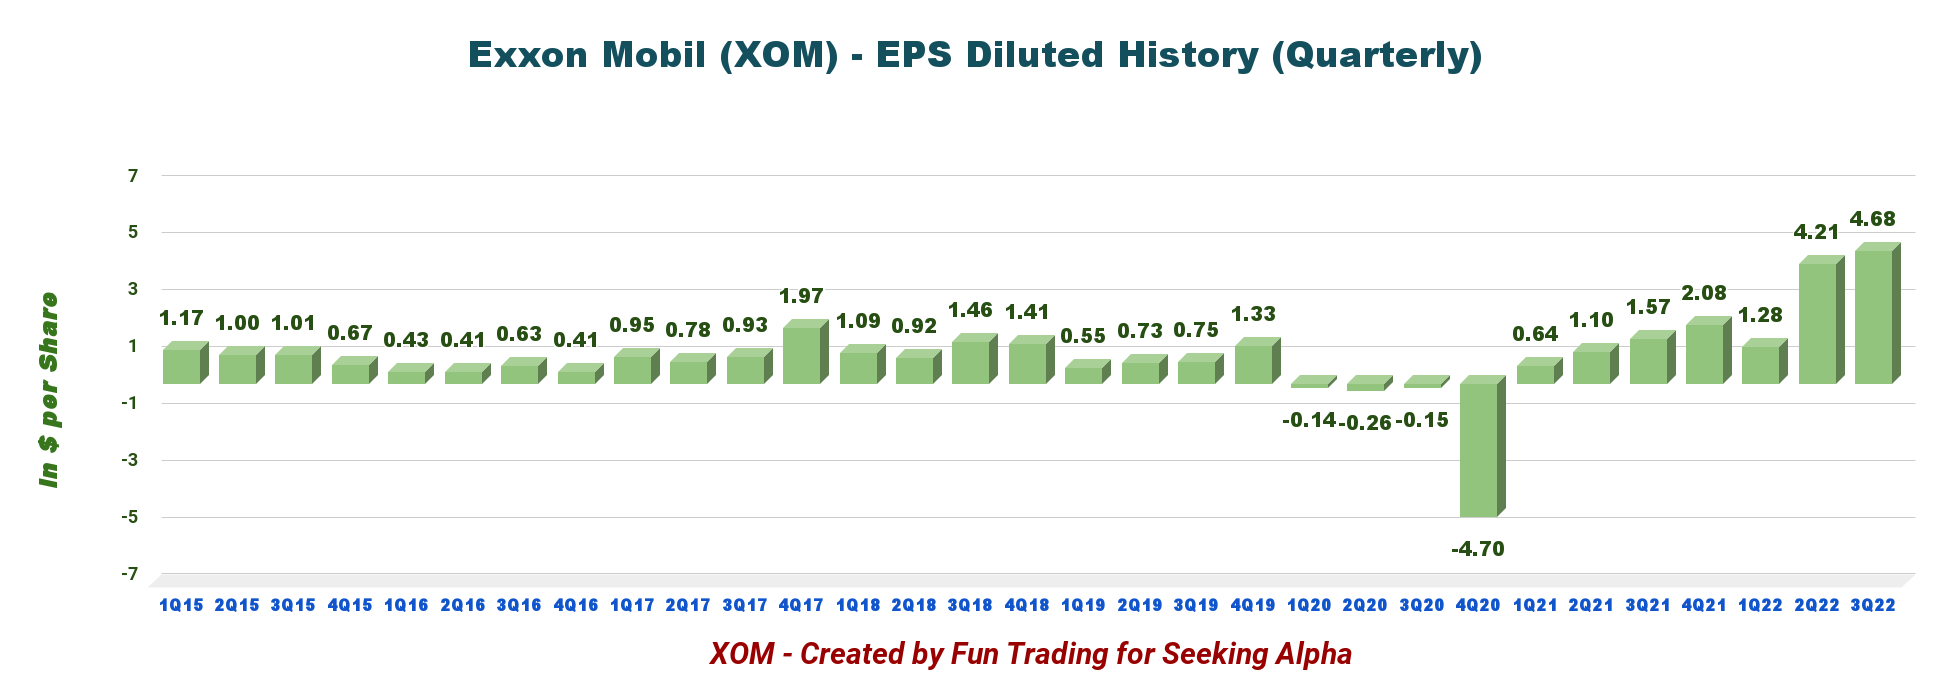
2 – Investment Thesis
Exxon Mobil is one of my favored oil companies, and I owned the stock long-term, even if I have been making profits recently. Exxon Mobil is highly dependent on oil and gas prices, which fluctuate wildly.
The overall strategy that I usually promote in my marketplace, “The Gold and Oil Corner,” is to keep a medium core long-term position and use about 50%-60% to trade LIFO while waiting for a higher final price target to sell your core position or keep it and receive a steady dividend.
The FED’s successive hikes are affecting the U.S. economy, and we may enter a painful recession that will weaken the overall demand for hydrocarbons. The third quarter earnings season is a temporary boost only.
The FED is expected to hike interest rates by 75-point on November 2, and potentially in December too, based on rampant inflation and the job market in the US stubbornly high.
Oil prices have already corrected from their recent high of above $140 per barrel to below $100 per barrel and may fall further depending on the FED’s decision on interest rates.
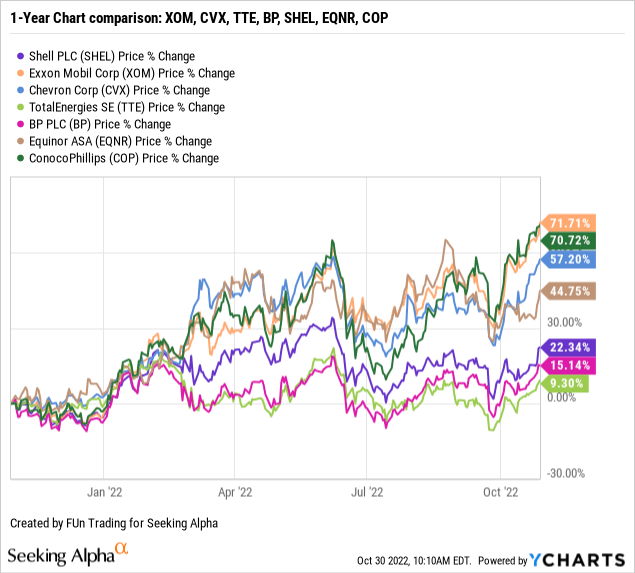
3 – Stock performance
XOM is up 72% on a one-year basis. The company is outperforming its peers.
4 – Upstream production
Oil and gas production in the third quarter was 3,716K Boep/d. The U.S. oil price composite was $91.69 this quarter.
Below is the company’s production per region between liquids (including NGL) and natural gas in 3Q22. The U.S. segment represents 31.6% of the total input.
XOM 3Q22 oil and gas production (Fun Trading)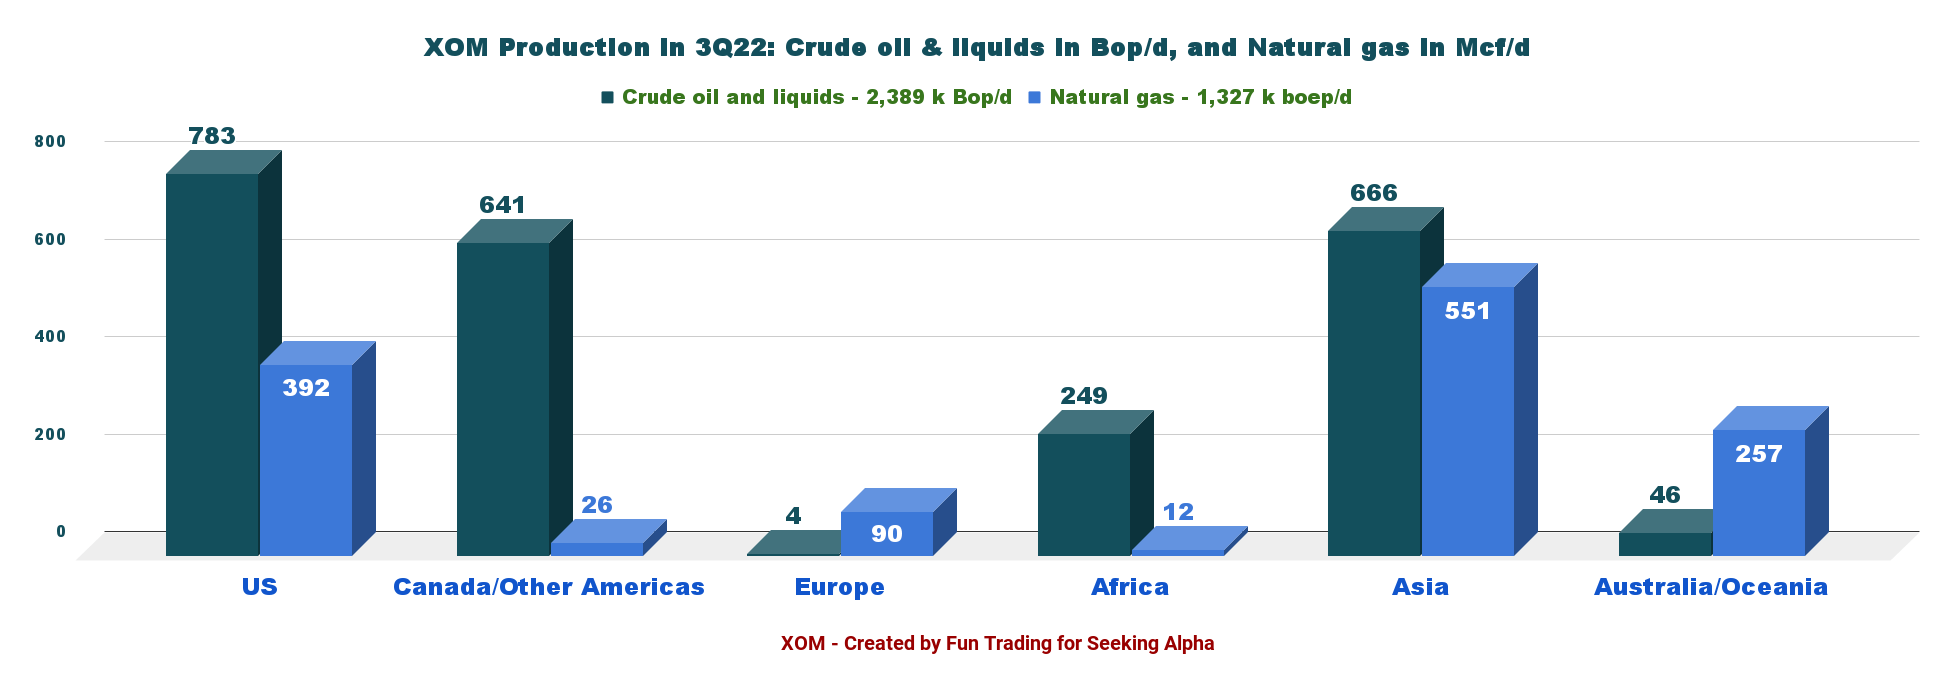
ExxonMobil has made more than 30 discoveries on the block since 2015, and it has ramped up offshore development and production at a pace that far exceeds the industry average,
Also, Offshore Guyana’s quarterly average gross production increased to nearly 360K Boep/d, with Liza Phase 1 and 2 production exceeding design capacity by more than 15K Boep/d in 3Q22.
Exxon Mobil – 3Q22 Financial Table and Upstream Production: The Raw Numbers
| Exxon Mobil | 3Q21 | 4Q21 | 1Q22 | 2Q22 | 3Q22 |
| Total Revenues and other Income in $ Billion | 73.79 | 84.97 | 90.50 | 115.68 | 112.07 |
| Net Income in $ Billion | 6.75 | 8.87 | 5.48 | 17.85 | 19.66 |
| EBITDA $ Billion | 14.81 | 17.61 | 17.63 | 29.58 | 31.27 |
| EPS diluted in $/share | 1.57 | 2.08 | 1.28 | 4.21 | 4.68 |
| Cash from operating activities in $ Billion | 12.09 | 17.12 | 14.79 | 19.96 | 24.43 |
| Capital Expenditures in $ Billion | 2.84 | 4.09 | 3.91 | 3.84 | 4.88 |
| Free Cash Flow in $ Billion | 9.25 | 13.04 | 10.88 | 16.13 | 19.55 |
| Total Cash $ Billion | 4.77 | 6.80 | 11.07 | 18.86 | 30.41 |
| Total Debt in $ Billion | 56.6 | 47.7 | 47.5 | 46.88 | 39.25 |
| Dividend per share in $ | 0.88 | 0.88 | 0.88 | 0.88 | 0.91 |
| Shares outstanding (diluted) in Billion | 4.276 | 4.275 | 4.266 | 4.276 | 4.185 |
| Oil Production | 3Q21 | 4Q21 | 1Q22 | 2Q22 | 3Q22 |
| Oil Eq Income Production in K Boepd | 3,665 | 3,816 | 3,675 | 3,732 | 3,716 |
| US Production in K Boepd | 1,208 | 1,222 | 1,216 | 1,227 | 1,175 |
| Permian Production in K Boepd | 500 | 460 | 640 | 550 | 560 |
| US Quarterly average Brent Eq. ($/b) | 67.62 | 73.62 | 93.51 | 107.78 | 91.69 |
| US Quarterly average NG ($/Kcf) | 3.33 | 4.96 | 4.80 | 6.49 | 8.38 |
Sources: Company filing and Fun Trading analysis.
Analysis: Revenues, Earnings Details, Free Cash Flow, and Upstream Cash Flow
1 – Quarterly revenues and other income were $112.07 billion in 3Q22
XOM Quarterly revenues history (Fun Trading)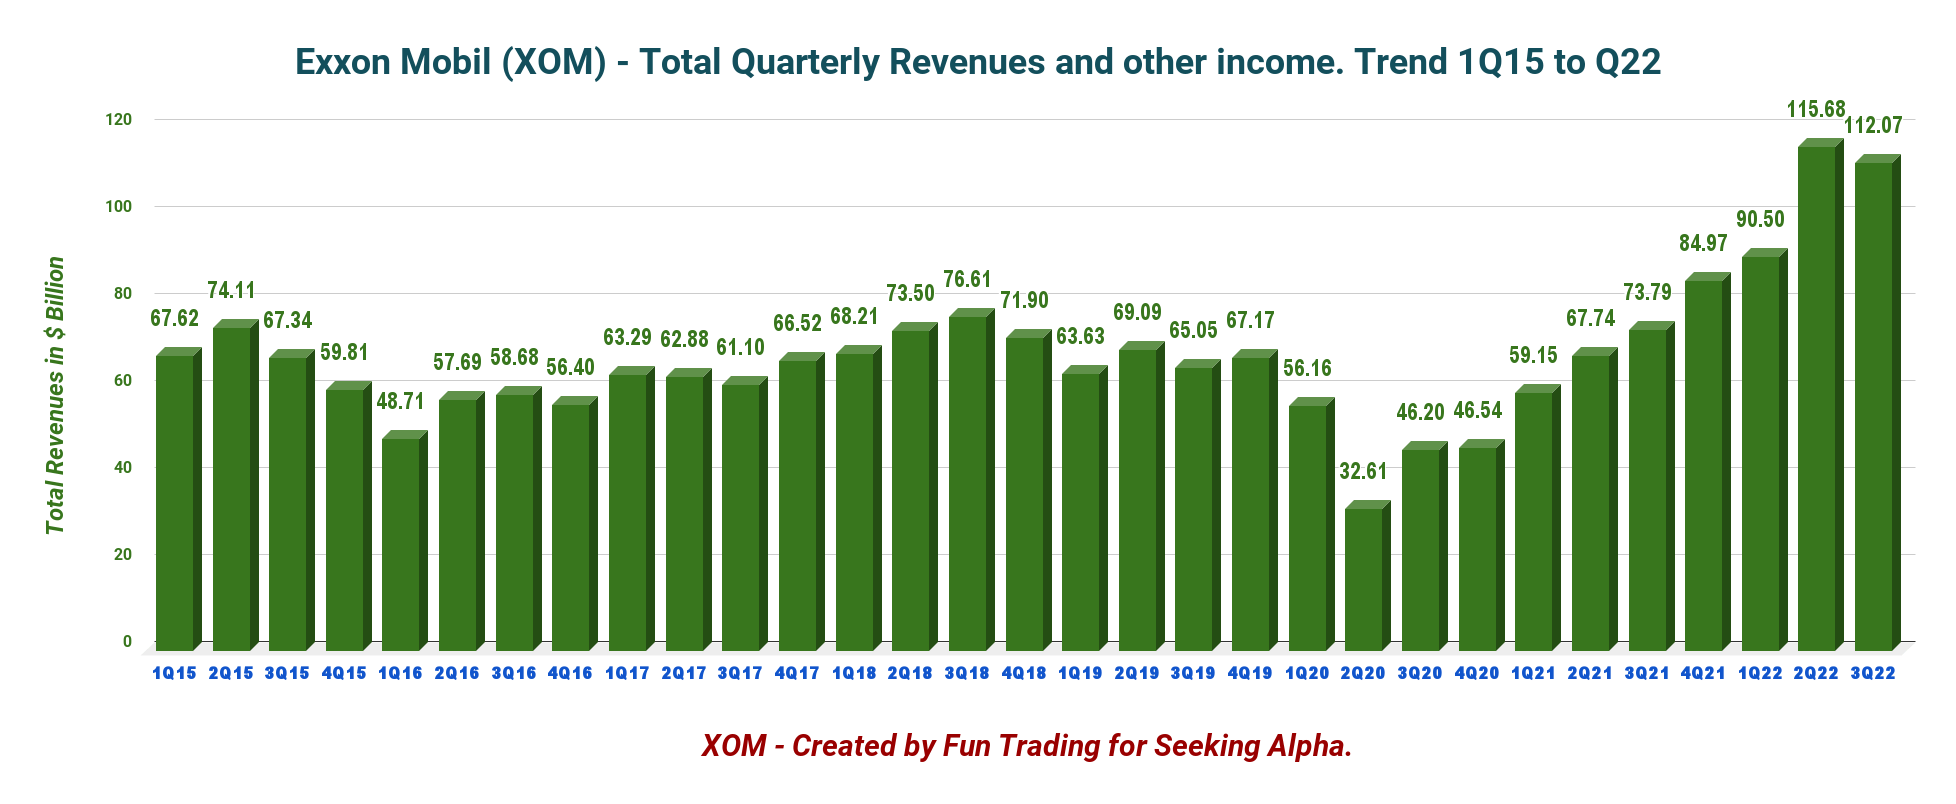
Revenues and other incomes came in at $112.07 billion in the third quarter of 2022, with $19.66 billion in net income. This quarter, revenues significantly improved due to higher chemical margins and improved realized commodity prices.
Third-quarter earnings were $19.7 billion compared with $17.9 billion in the second quarter of 2022. Excluding identified items, earnings of $18.7 billion were up $1.1 billion versus the prior quarter as higher natural gas realizations, record throughput in Energy Products, and continued cost control, were partially offset by lower crude realizations and moderating industry refining margins
The company concluded the sales of XTO Energy Canada and the Romania Upstream affiliate, resulting in earnings of $0.6 billion and more than $2 billion in cash proceeds during the quarter.
Also, an agreement was announced with Green Gate Resources E, LLC, for the sale of ExxonMobil’s interest in the Aera oil production operation in California, which is expected to close in the fourth quarter.
1.1 – Earnings details in 3Q22
XOM Quarterly earnings details per segment 3Q22 (Fun Trading)
The third quarter was excellent. The company’s gas prices were back to a historical high, and oil prices were still above $90 per barrel.
1.2 – XOM oil and gas prices history:
XOM Quarterly Oil and NG prices history (Fun Trading)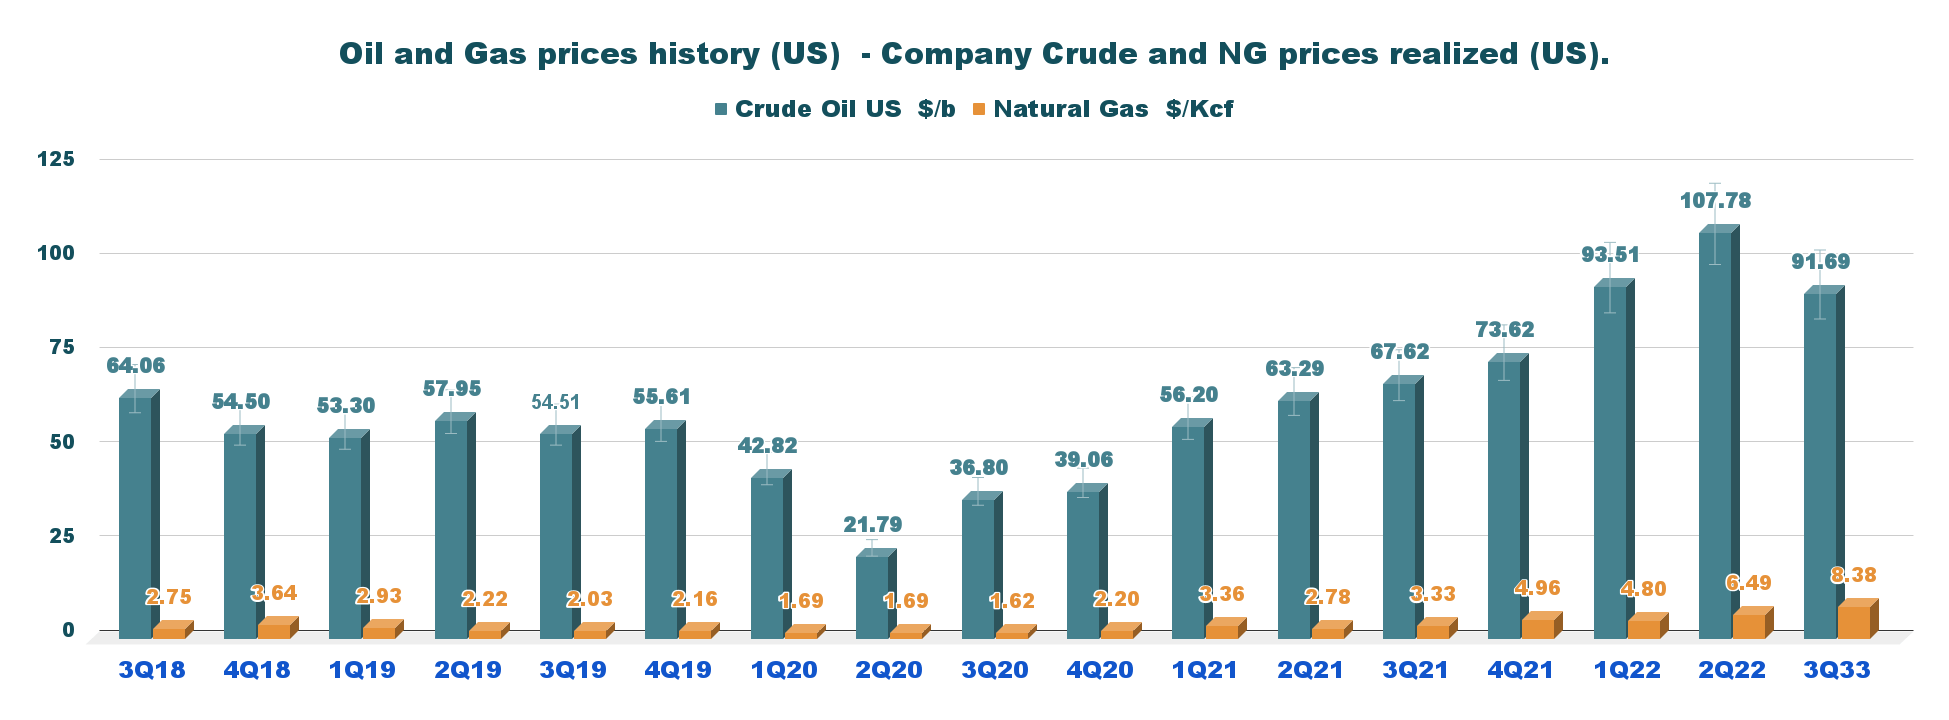
2 – Free Cash Flow (not including divestitures). The company posted a whopping record of $19.55 billion in 3Q22.
XOM Quarterly Free cash flow history (Fun Trading) Note: Generic free cash flow is cash from operating activities minus CapEx.
CapEx was elevated in 3Q22, reaching $4.88 billion, and cash from operating activities jumped to $24.43 billion, up from $12.09 billion in 3Q21. CapEx more than doubled from the same quarter a year ago.
The third quarter’s free cash flow was $19.55 billion. The trailing 12-month FCF is $59.59 billion (not including divestitures). This high Free cash flow level explains why XOM increased the buyback program from $10 billion to $30 billion.
3 – Oil production in K Boep/d
3.1 – Upstream segment
XOM Quarterly Oil equivalent production history (Fun Trading)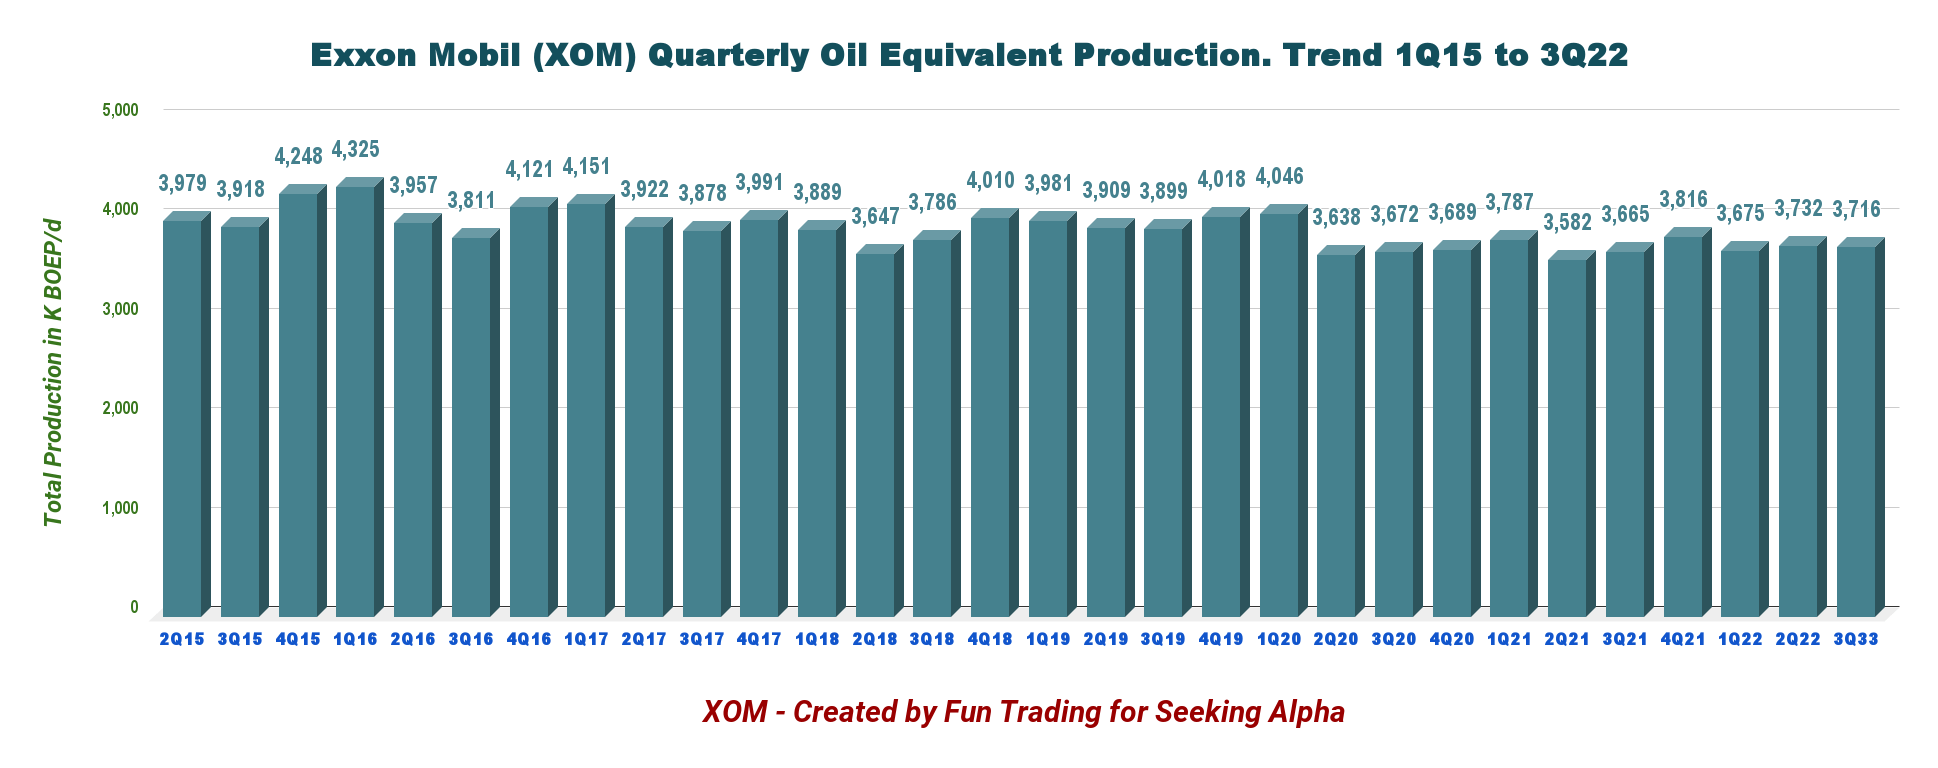
Combining oil and gas production, Exxon Mobil produced 3,716K Boep/d in 3Q22, up 1.4% yearly and up 0.4% sequentially (please see graph history above). The Permian delivered record production in the quarter of nearly 560K Boep/d.
Liquids represented 2,389K Boep/d or 64.3% of the total output. Total U.S. production represented 31.6% of the total output in 3Q22.
XOM Quarterly US Production history (Fun Trading)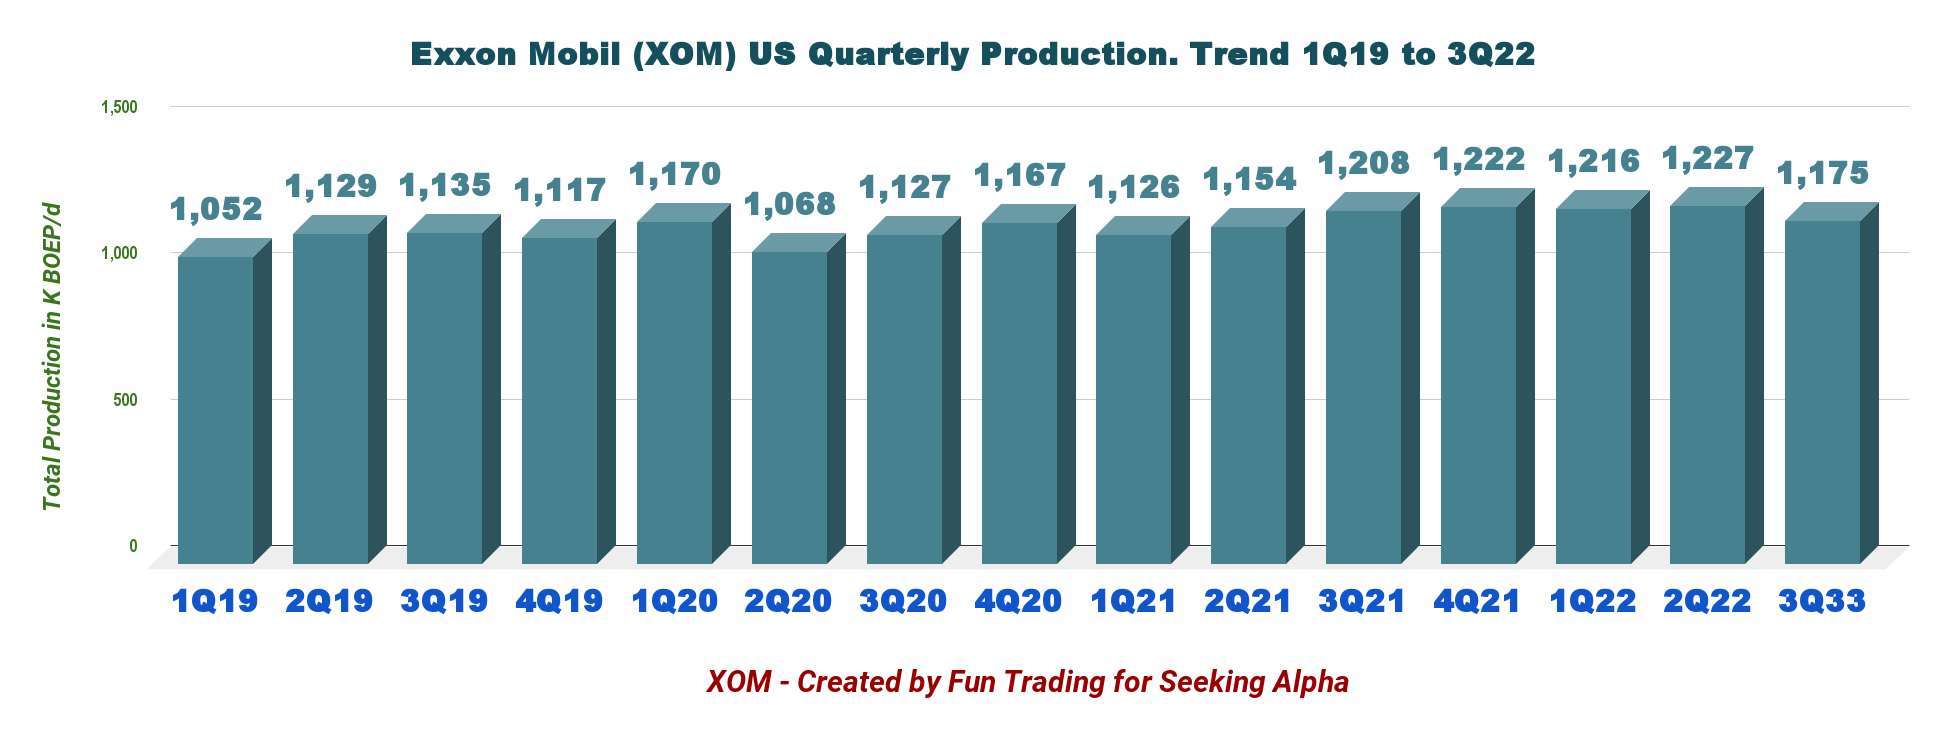
3.2 – Details of production for the USA:
XOM Quarterly US Production details history (Fun Trading)
The Permian production has reached a plateau at around 560k Boep/d. Guyana is doing well, and production is increasing with about 340K Bop/d in 3Q22.
3.4 – Energy, chemical, and Specialty Products segments
Exxon Mobil announced a profit of $5,819 million, up from $529 million a year ago, due to solid industry refining margins. This quarter, the company also experienced higher aromatics, marketing, and trading margins.
ExxonMobil posted $812 million in profit, down significantly from $2,027 million in the year-ago quarter, due to lower volumes and margins from bottom-of-cycle conditions in the Asia Pacific and weaker demand in Europe and North America.
ExxonMobil posted $762 million in profit, down from $839 million in the year-ago quarter, primarily due to the higher feed cost environment.
4 – Net Debt significantly down to $8.8 billion in 3Q22
XOM Quarterly Cash versus Debt history (Fun Trading)
Exxon Mobil’s net debt is now $8.8 billion, with a Debt to EBITDA ratio of 0.1x. (Source: Fun Trading)
XOM Quarterly Debt to EBITDA history (Fun Trading)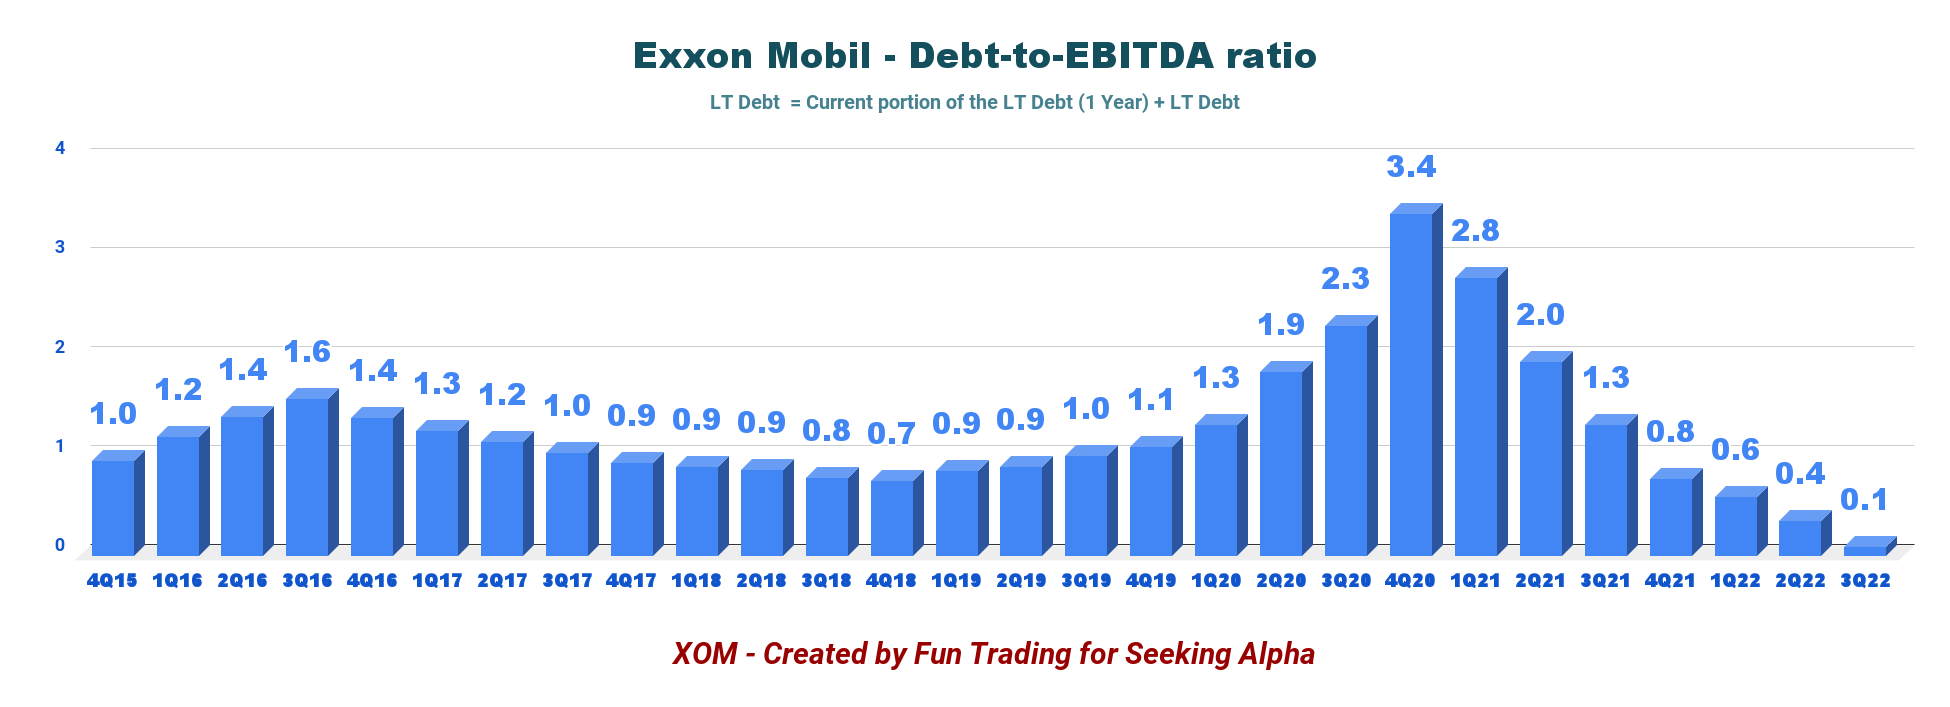
Exxon Mobil’s debt situation is getting better. The company indicates the debt-to-Capital ratio at 19%.
5 – Company’s outlook for the 4Q22
The upstream is expected to deliver a constant production, driven by Permian and Guyana Growth. However, the company expects higher schedule maintenance in 4Q22.
Inflationary pressure is expected to affect the overall business with Corporate and financing to be about $500 million.
XOM 4Q22 Outlook (XOM Presentation)
We continue to expect total upstream production of 3.7 million oil equivalent barrels per day for the year. Looking longer term, we remain on track to grow low-cost production and meet our 2027 plan, with more than 90% of our Upstream investments, generating over 10% returns at $35 per barrel.
Technical Analysis and Commentary
XOM TA Chart short-term (Fun Trading StockCharts) Note: The chart is adjusted for dividends.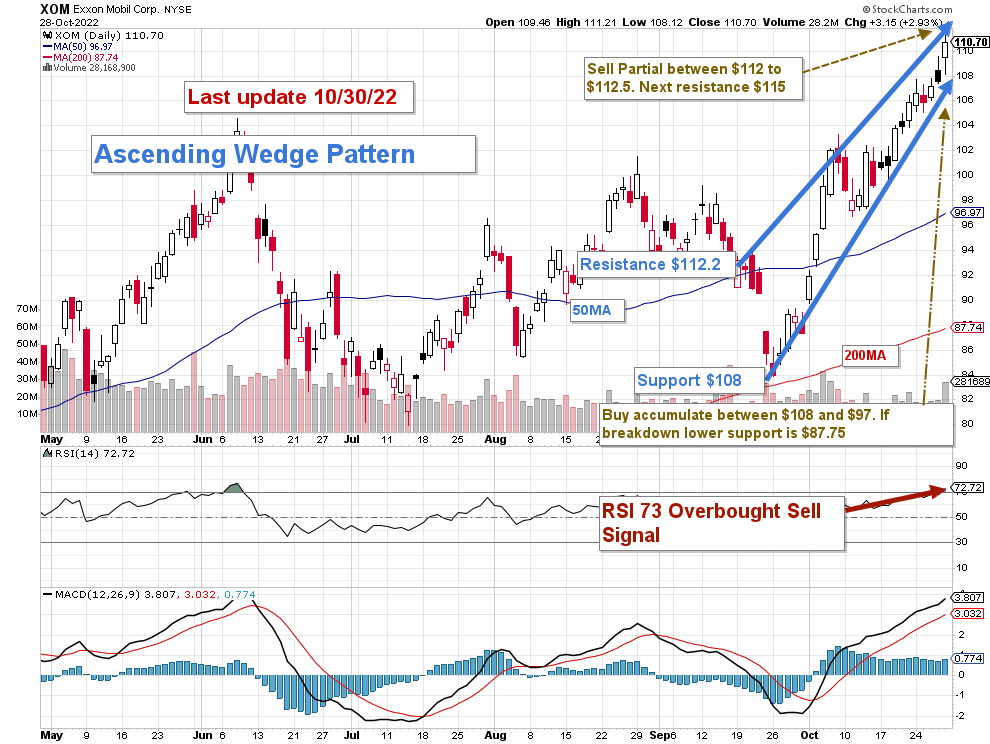
XOM forms an ascending wedge pattern with resistance at $112.2 and support at $108. Rising or ascending wedge patterns are bearish chart patterns that signal a looming breakout to the downside. It is even more evident with the RSI (14) now at 73.
Oil strengthened a little recently from its low after the recent OPEC+ announcement. Still, I believe it is temporary and will probably retrace in late Q4 when recession fears fueled by the FED hawkish policy will be more apparent, and demand concern takes the market by “surprise.”
XOM Oil and gas prices comparison 1 year (Fun Trading StockCharts)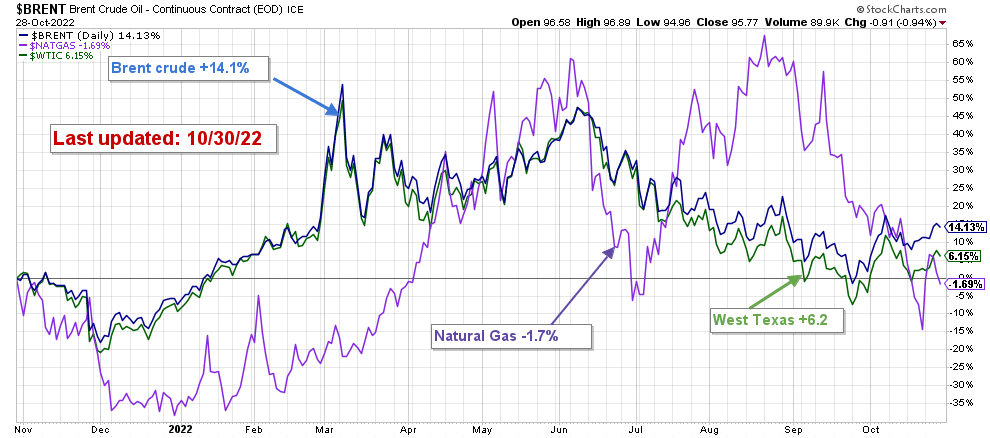
It is perhaps wise to use the recent rally to take some profits, as I have done above $110. I think selling 40% (Trading LIFO) between $110 and $115 and waiting for between $108 and $97 to consider adding again is the best strategy.
The FED is expected to hike the interest rate by 75-point on November 2, which may tip the economy into recession. If it happens, XOM could fall back to $100-$95 with possible lower support at $88 in case of extreme retracement.
Note: The LIFO method is prohibited under International Financial Reporting Standards (IFRS), though it is permitted in the United States by Generally Accepted Accounting Principles (GAAP). Therefore, only U.S. traders can apply this method. Those who cannot trade LIFO can use an alternative by setting two different accounts for the same stock, one for the long term and one for short-term trading.
Warning: The TA chart must be updated frequently to be relevant. It is what I am doing in my stock tracker. The chart above has a possible validity of about a week. Remember, the TA chart is a tool only to help you adopt the right strategy. It is not a way to foresee the future. No one and nothing can.
Author’s note: If you find value in this article and would like to encourage such continued efforts, please click the “Like” button below to vote of support. Thanks.
Be the first to comment