

Dimitrios Kambouris
This is an update of an earlier article I published back in August 2012. In that piece, I analyzed the opposite views Bill Gates and Warren Buffett hold on big oil stocks. Gates believes that some of the big oil stocks will be worth very little 30 years later, while Buffett has kept accumulating big oil stocks such as Chevron (NYSE:CVX) and other “old energy” assets. And after analyzing some representative oil stocks, I’ve decided to continue to side with Buffett.
So far, Buffett has won a battle with oil stocks posting spectacular returns in the past year or two, while the overall market suffered some of its worst corrections. The next logical question is: Is Buffett’s current lead only temporary? And can Gates win the long war in the end?
This updated analysis is intended to answer both questions. In particular, it’s motivated by the following developments since the time of my last article:
- Both oil prices and natural gas prices have declined considerably since August. As you can see from the chart below, Brent crude prices have declined from about $104 to the current level of $94, a decline of more than 10%. And natural gas prices have declined even more dramatically, from almost $10 to the current $6.3, a decline of 37%.
- There’s the simple fact that Buffett has kept building up his oil position since the time of my last writing.
In the remainder of this article, I will argue that both of the above developments have made my original thesis even stronger. I will argue that that the current oil and natural gas prices are too compressed by taking a longer view of their price history and the implications for the worth of CVX and Exxon Mobil (NYSE:XOM). Furthermore, I will also analyze our energy landscape (both the past and the future) to argue that the role of crude oil and natural gas would keep growing steadily, both as an energy source and for their other industrial applications.
Source: Seeking Alpha data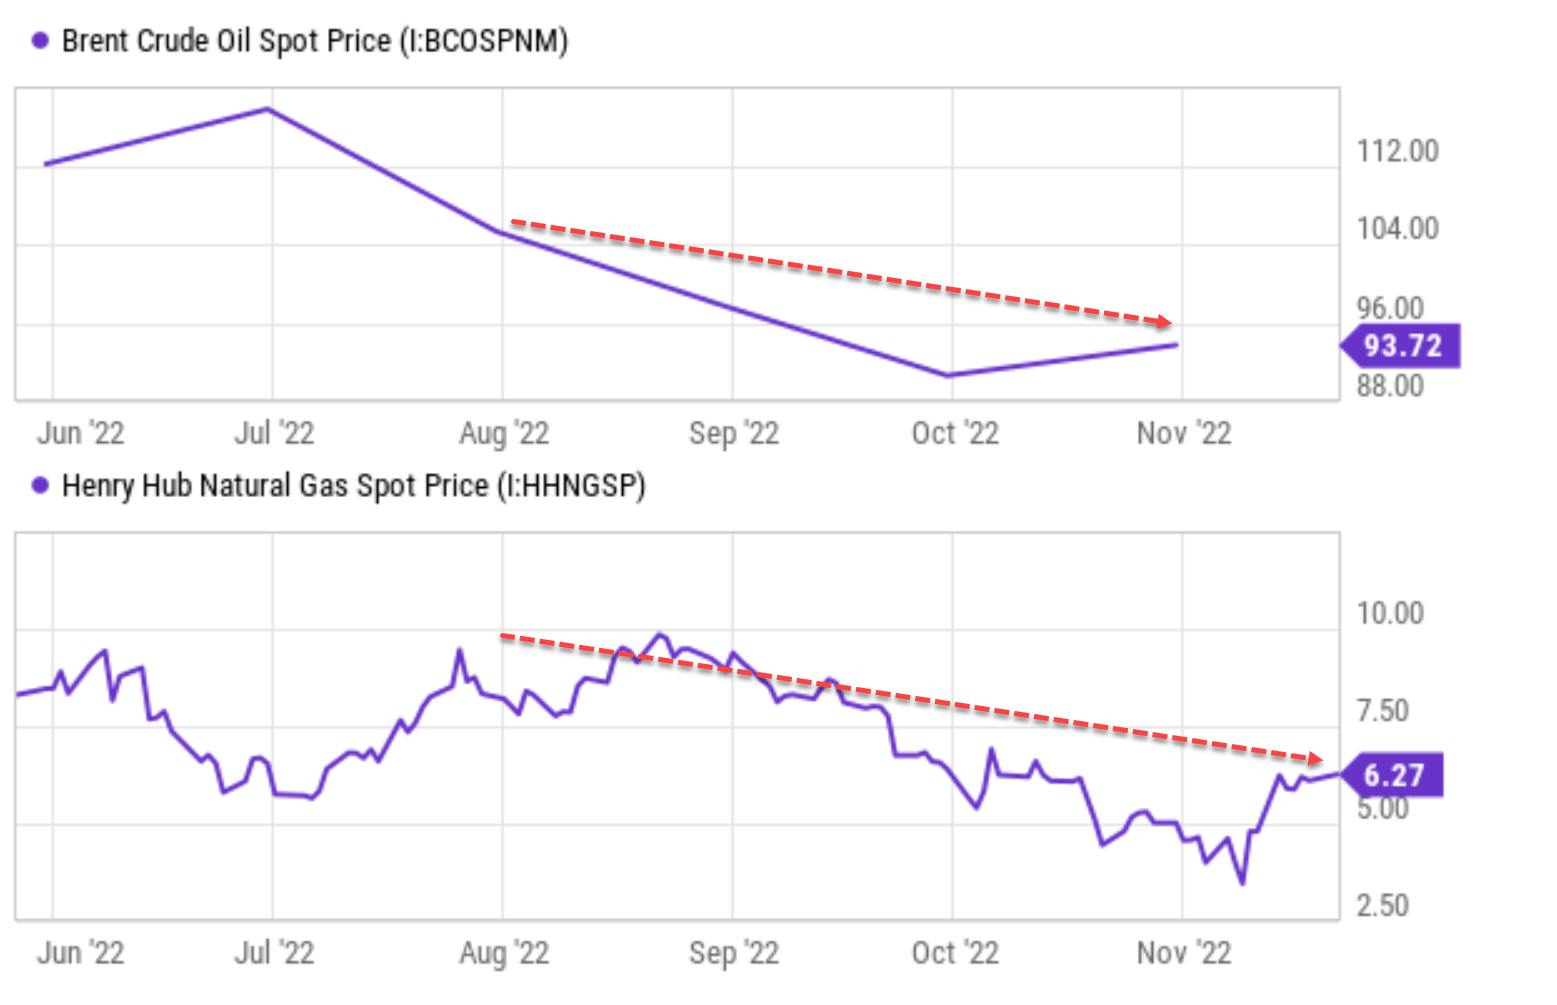
Buffett Won This Battle
Two of the greatest minds of our generation, Bill Gates and Warren Buffett, diverge starkly on big oil stocks. For example, Gates opined at the COP26 climate summit:
Some of these giants will fall. You know, 30 years from now, some of those oil companies will be worth very little.
This requires a bit of historical context. The above comments were made at the end of 2021 (November 2021, to be exact). At that time, companies like XOM, CVX, and Shell (SHEL) were experiencing some of the worst stock price declines in the proceeding five years. The outbreak of the COVID-19 pandemic further crippled oil demand and triggered huge losses for all these big oils.
In the meantime, Gates’ close friend Warren Buffett has a totally different opinion. Although less vocal about his opinions on our energy future, Buffett’s actions spoke loudly too, probably more so than Gates’. In the latest F13 disclosure, Berkshire’s (BRK.A)(BRK.B) equity holdings showed that Buffett kept accumulating big oils stocks. As you can tell from the chart below, Buffett added 2.43% to his CVX position and a whopping 22.6% to his Occidental Petroleum (OXY) position.
Now CVX and OXY are the third and sixth largest positions in BRK’s equity portfolio. Out of the top six positions, one-third of them are in big oils. Also keep in mind that in addition to these stock holdings, Berkshire also operates Berkshire Hathaway Energy and recently acquired Dominion Energy’s (D) natural gas transportation and storage assets, which also fall under the umbrella of “traditional energy.”
Source: dataroma.com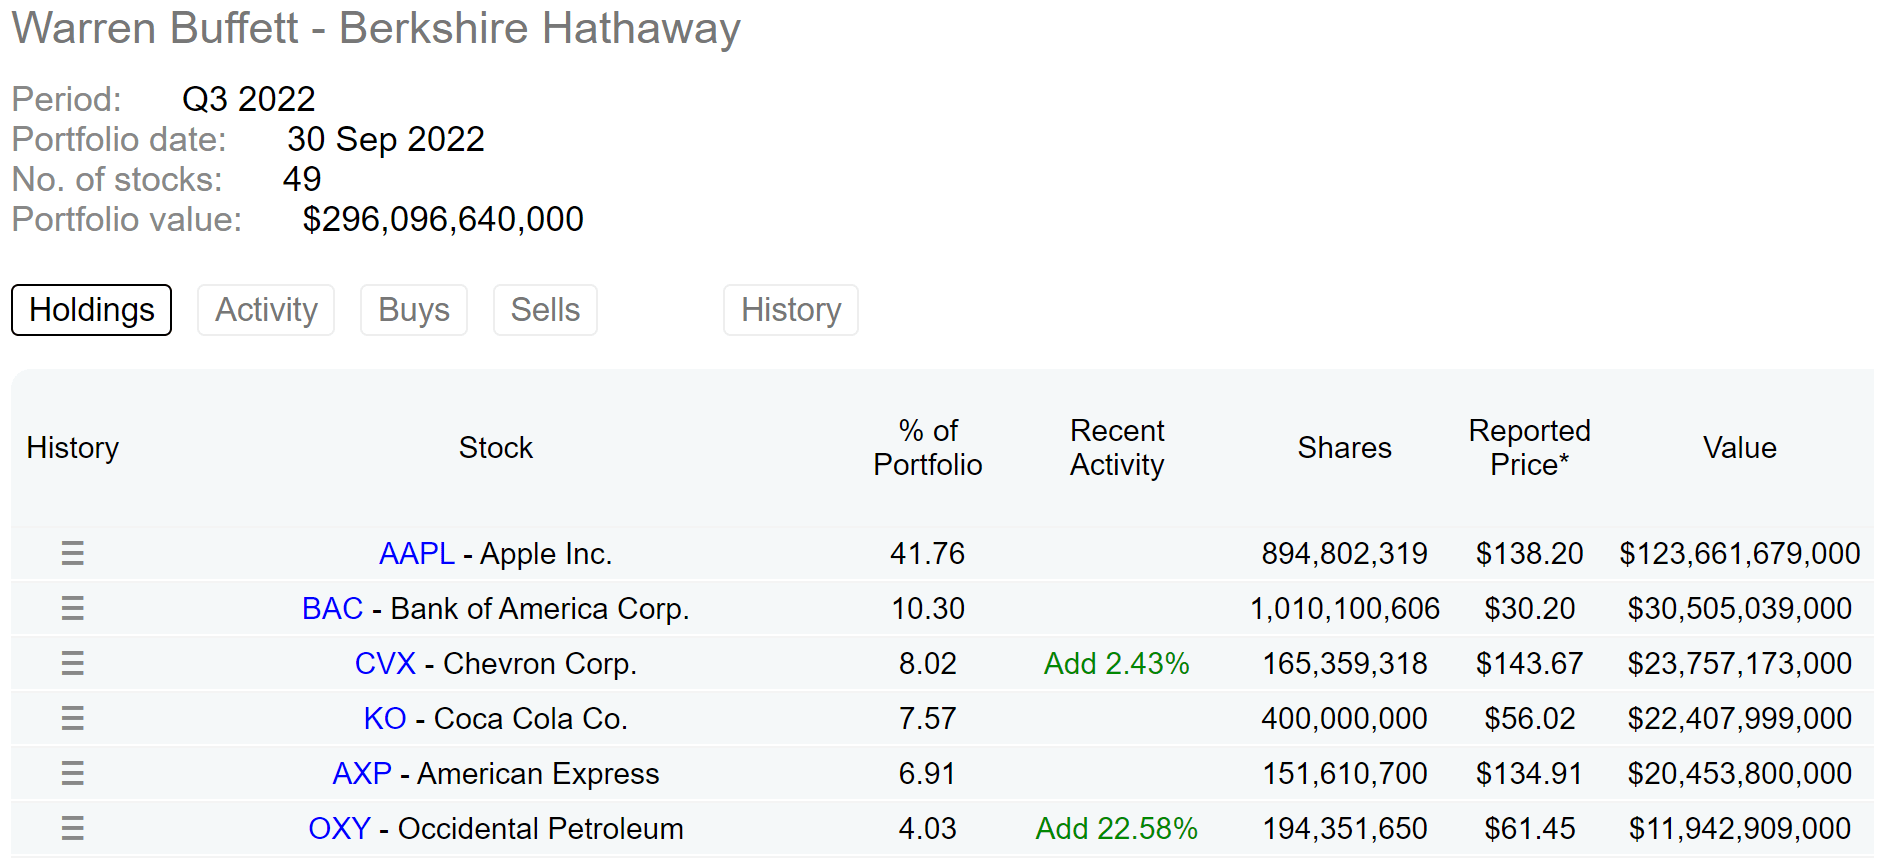
Buffett has clearly won this round, as you can see from the following chart. Since November 2021, oils stocks have been some of the best-performing assets, with XOM delivering a total return of 92% and CVX 66%. In contrast, SPY has suffered a total loss of 11%. Thus, the relevant question is if Gates would turn out to be right in the longer term. In the remainder of this article, you will see me arguing for Buffett’s thesis. I’m not sure what will happen to our energy landscape in 30 years, but I see both XOM and CVX offering a robust return profile to shareholders in the next 10 years – even under some very conservative assumptions, as elaborated on below.
Source: Seeking Alpha data.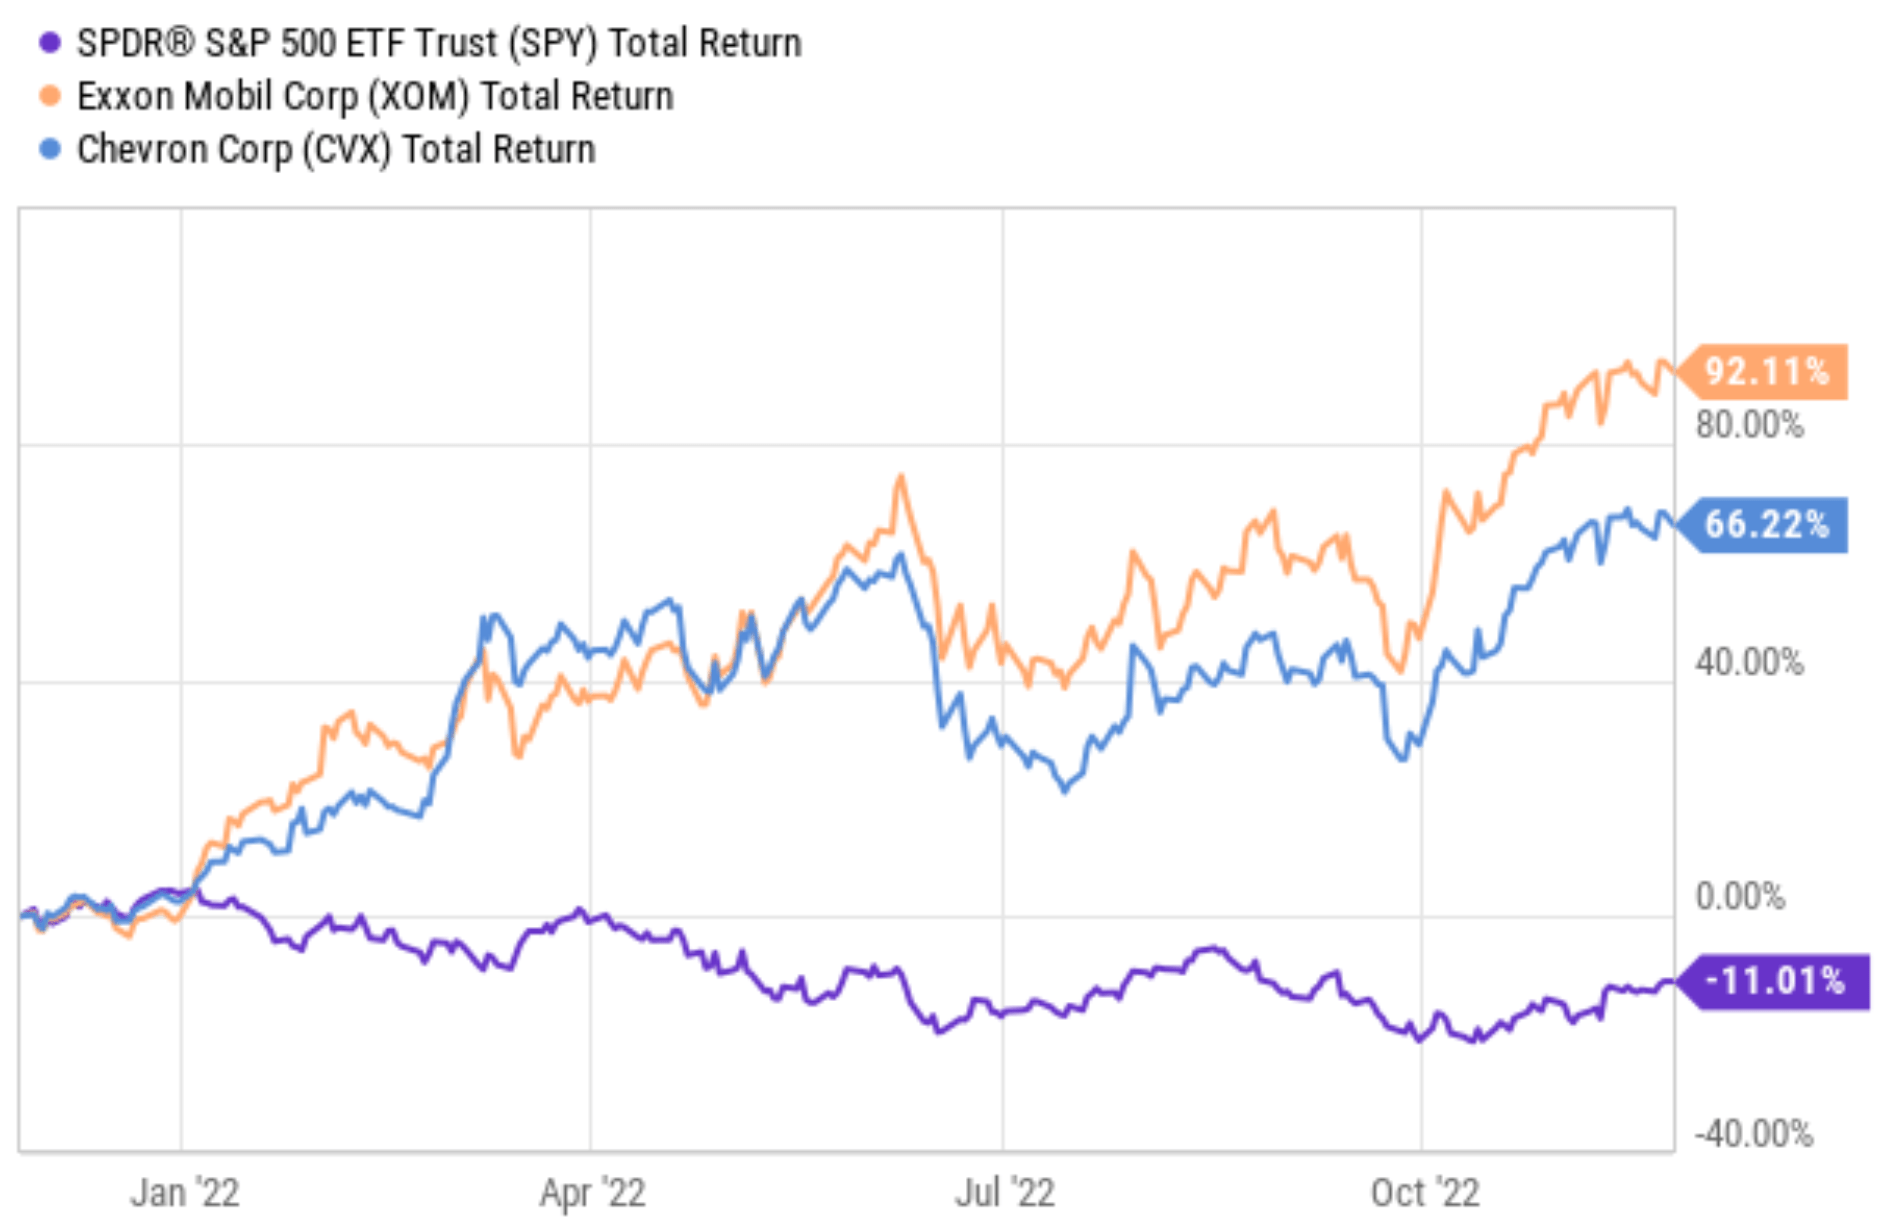
XOM and CVX: Current Worth of Their Reserves
Both XOM and CVX are complicated businesses with plenty of intricacies. To simplify the analysis and also to be on the conservative side (which I always like to be), I will make a dramatic simplification. The remainder of this article will assume that everything XOM and CVX currently own is worthless except their proven reserve (both crude oil and natural gas).
This is a drastic simplification, as already noted. In reality, both XOM and CVX operate sizable downstream segments, their ongoing exploration continues to discover additional reserves, and both have new initiatives in renewables as well. But such dramatic simplification can help cut to the essence of my thesis quickly. At the same time, it can provide a wide margin of safety.
Given this simplification, the chart below displays the current worth of XOM and CVX’s proven reserve at this moment. To wit, XOM’s proven reserve for oil stands at 9.88 billion barrels and CVX’s stands at 6.1 billion barrels. The 10-year average oil price has been $105 per barrel (I will argue later why the oil price has been compressed over the past 10 years and why future prices could be higher). Even at this average price, the proven reserve for oil is worth $642 billion for XOM and $397 billion for CVX if we assume the so-called breakeven oil price to be $40 per barrel. As detailed in an earlier article of mine:
Estimating the so-called breakeven price is more an art than a science. A lot of it depends on how you define the concept itself. Let me just quote a few numbers to illustrate the degree of ambiguity. XOM’s extensive operations in the Permian Basin feature the lowest production cost only around $15/barrel. And XOM’s production cost in Guyana is about $25 per barrel. XOM’s CEO Woods commented that the overall oil production cost is about $35 per barrel. So in this article, I will use $40 to be on the more conservative side.
Currently, the shares outstanding for XOM are 4.12B and 1.93B for CVX. As a result, the proven reserve for oil would be worth $156 for XOM and $206 for CVX on a per-share basis.
Next, let’s look at the worth of their proven natural gas reserves following a similar approach. The analysis of natural gas (NG) is a bit more complex than oil (that is why oil is discussed more frequently). The discussion of the NG business is really worth a full-length article in its own right. Here, I will be brief and readers interested in some of the details can see my earlier article with a focus on NG. All told, using the average NG price of $5 per MBTu in the past 10 years and a breakeven NG production price of $2.8 per MBTu, XOM’s proven NG reserve is worth about $17.3 (as shown below). And CVX’s proven NG reserve is worth about $35.6 (both are quoted on a per-share basis).
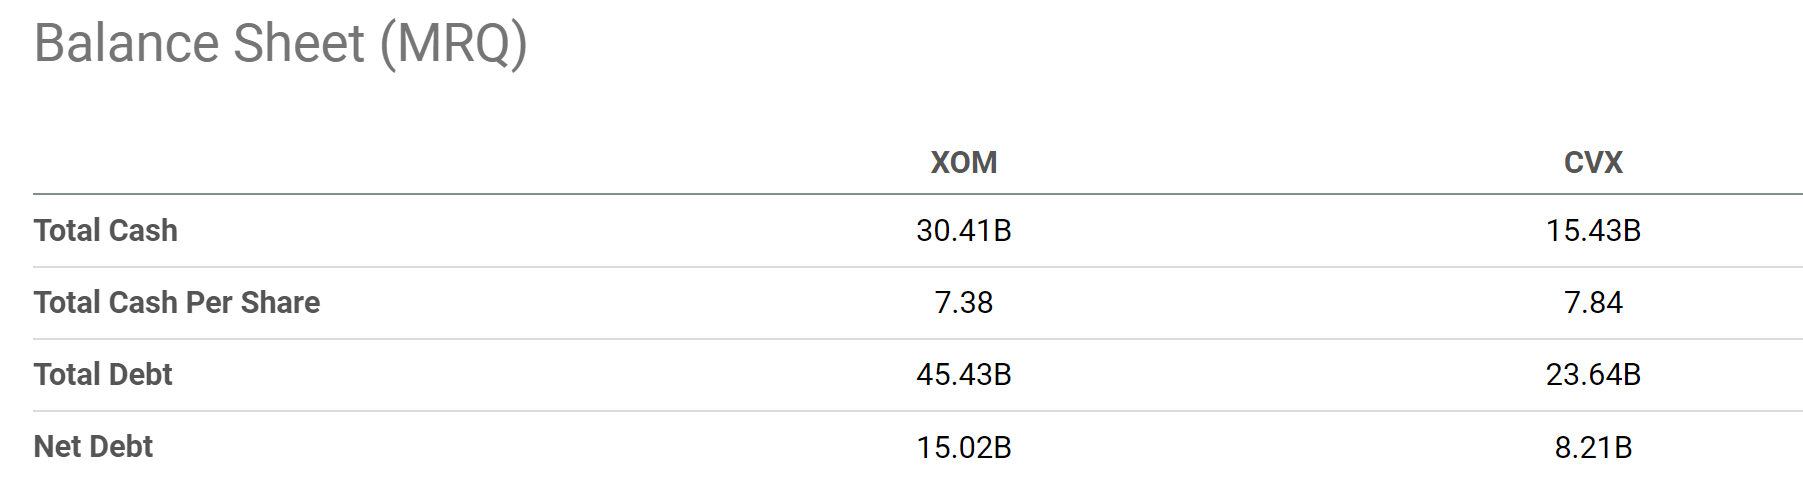
Both companies have some net debt. According to Seeking Alpha data (see the second chart below), XOM’s net debt stands at $15.02B (or $3.6 per share) and CVX at $8.21B (or $4.3 per share).
Summing up all the pieces so far, you can see that the current worth of the proven reserve, less the net debt, is about $169 per share for XOM and about $237 for CVX. Compared to their current stock prices ($113 and $183, respectively, as of this writing), the net worth provides a margin of safety of 33% and 23% already for XOM and CVX, respectively.
Source: author. Source: Seeking Alpha data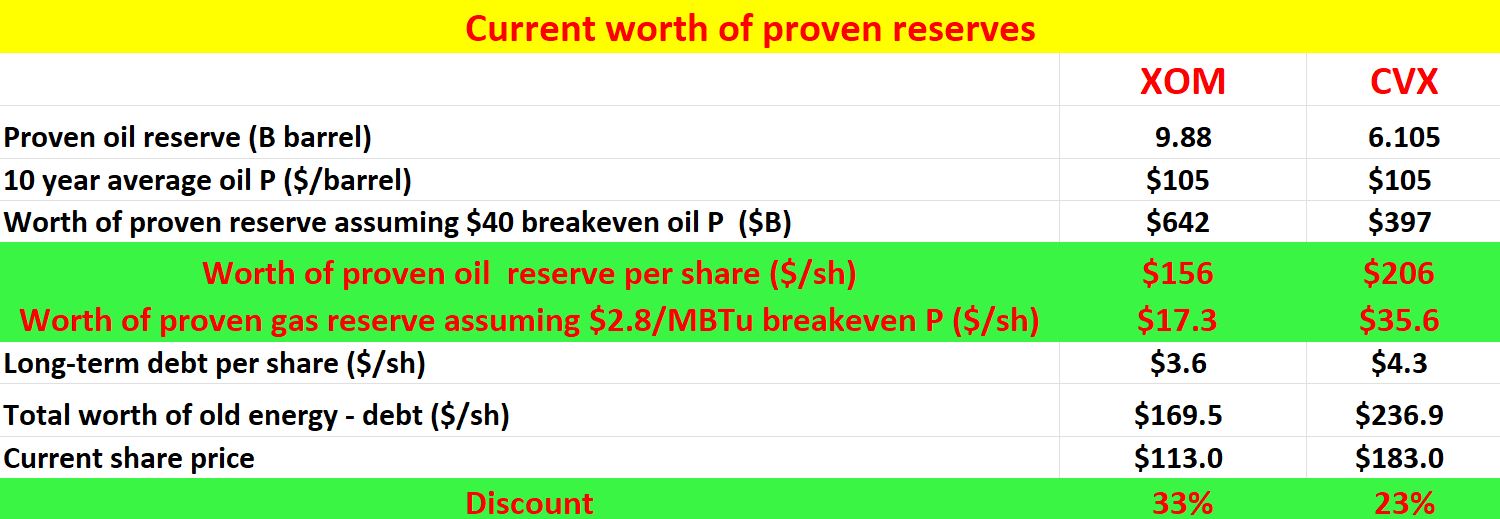
Energy Landscape in 2050
Let’s now analyze if the above old energy reserves (i.e., crude oil and NG) will be worth less in the future. I will anchor my analysis using the energy outlook provided by the U.S. Energy Information Administration (EIA). The EIA recently released its outlook for 2050 in its Annual Energy Outlook (AEO). The AEO is a pretty thick stack of PPT slides. But it offers a ton of information and I highly recommended it to all readers interested in our energy future – both old and new. The following bullet points are directly taken from the AEO to provide the key points (slightly edited by me):
- Petroleum and NG are projected to remain the most-consumed sources of energy in the U.S. through 2050, but renewable energy is the fastest growing.
- Wind and solar incentives, along with falling technology costs, support robust competition with NG for electricity generation, while the shares of coal and nuclear power are projected to keep decreasing in the U.S. electricity mix.
- U.S. crude oil production is projected to reach record highs, while natural gas production is increasingly driven by natural gas exports.
The chart below provides more specifics. As you can easily see, Bill Gates is correct in the sense that renewables will be rapidly growing (as displayed by the green line). But keep in mind that a) renewables start from a very low base level, and b) our total energy demand will grow rapidly too. As a net result, the growth in renewables is not sufficient to even fully meet the growth in our total demand. And the demand for old energy sources such as crude oil and NG would continue growing (as shown by the orange and blue lines).
Hence, I do not foresee a demand decline in oil and NG in terms of volume. Next, I will argue that their unit prices would not decline either.
Source: EIA 2050 AEO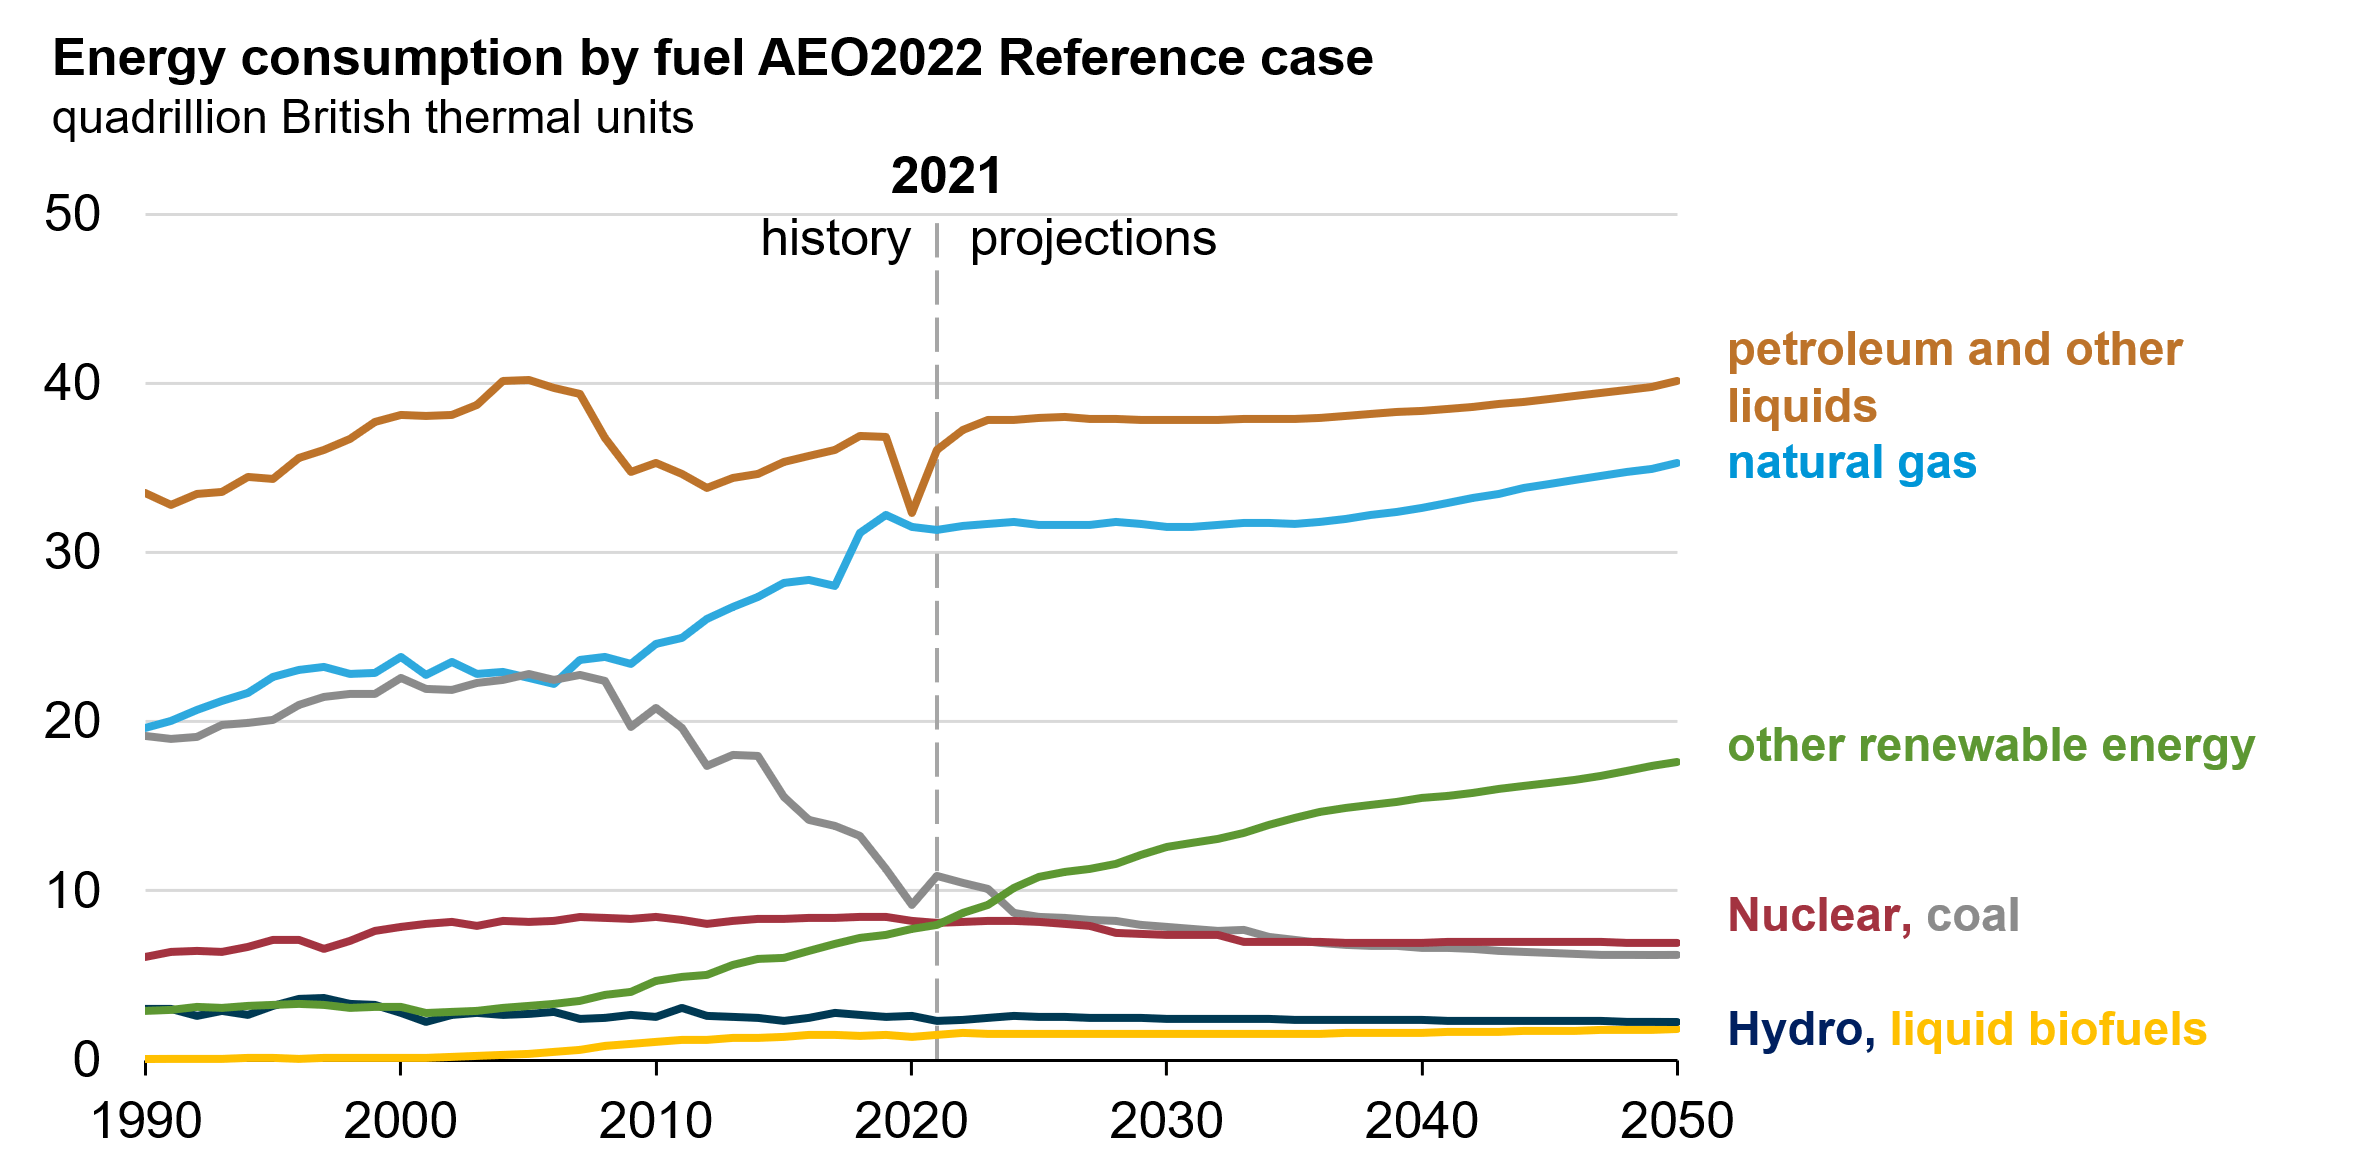
Oil and NG Prices – Past and Future
As mentioned earlier, my above analysis was based on a $105 average price of oil. And my view is such an assumption is on the conservative side.
To start, I anticipate oil and NG to at least keep pace with inflation in the long run. As shown in the chart below, the nominal oil prices over the past five decades have been climbing at a pace of 5.9% CAGR. Over this same period, the inflation escalator has been on average 3.9% CAGR. Thus, oil price rises have consistently outpaced inflation by about 200 basis points.
Source: U.S. Energy Information Administration (EIA)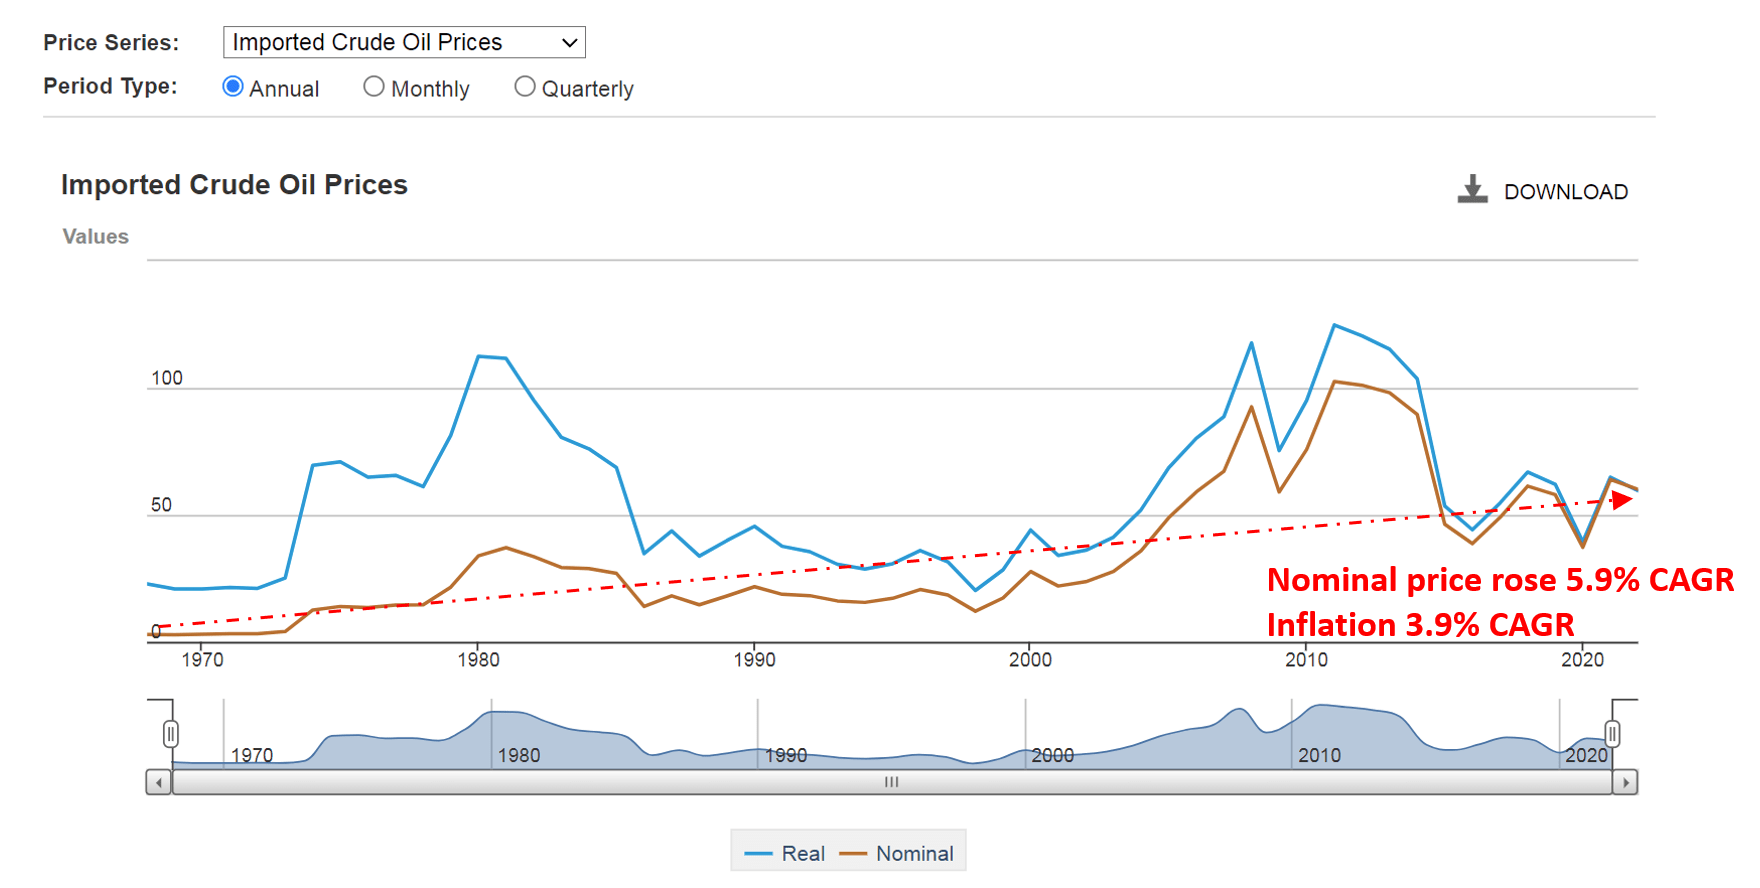
From this historical perspective, the current oil price is very compressed. As seen from the chart below, oil prices ceased to keep up with inflation in the past ~10 years. The current oil price of $76 is actually the same as it was back in 2014 (i.e., about eight years ago). The oil price should be at ~$125 even if it just kept pace with inflation over the past 10 years.
As another reference point, the above EIA’s Annual Energy Outlook used a Brent oil price of $90 per barrel in 2050 as a base case for their modeling, and that is in 2021 dollars. If we assume an average inflation of 2.5% per annum between now and 2050, a $90 base case would imply an oil price of $180 by 2050, about 2.36x higher than the current price of $76 and 1.71x higher than the average price of $105 I assumed.
Source: Author based on Yahoo! data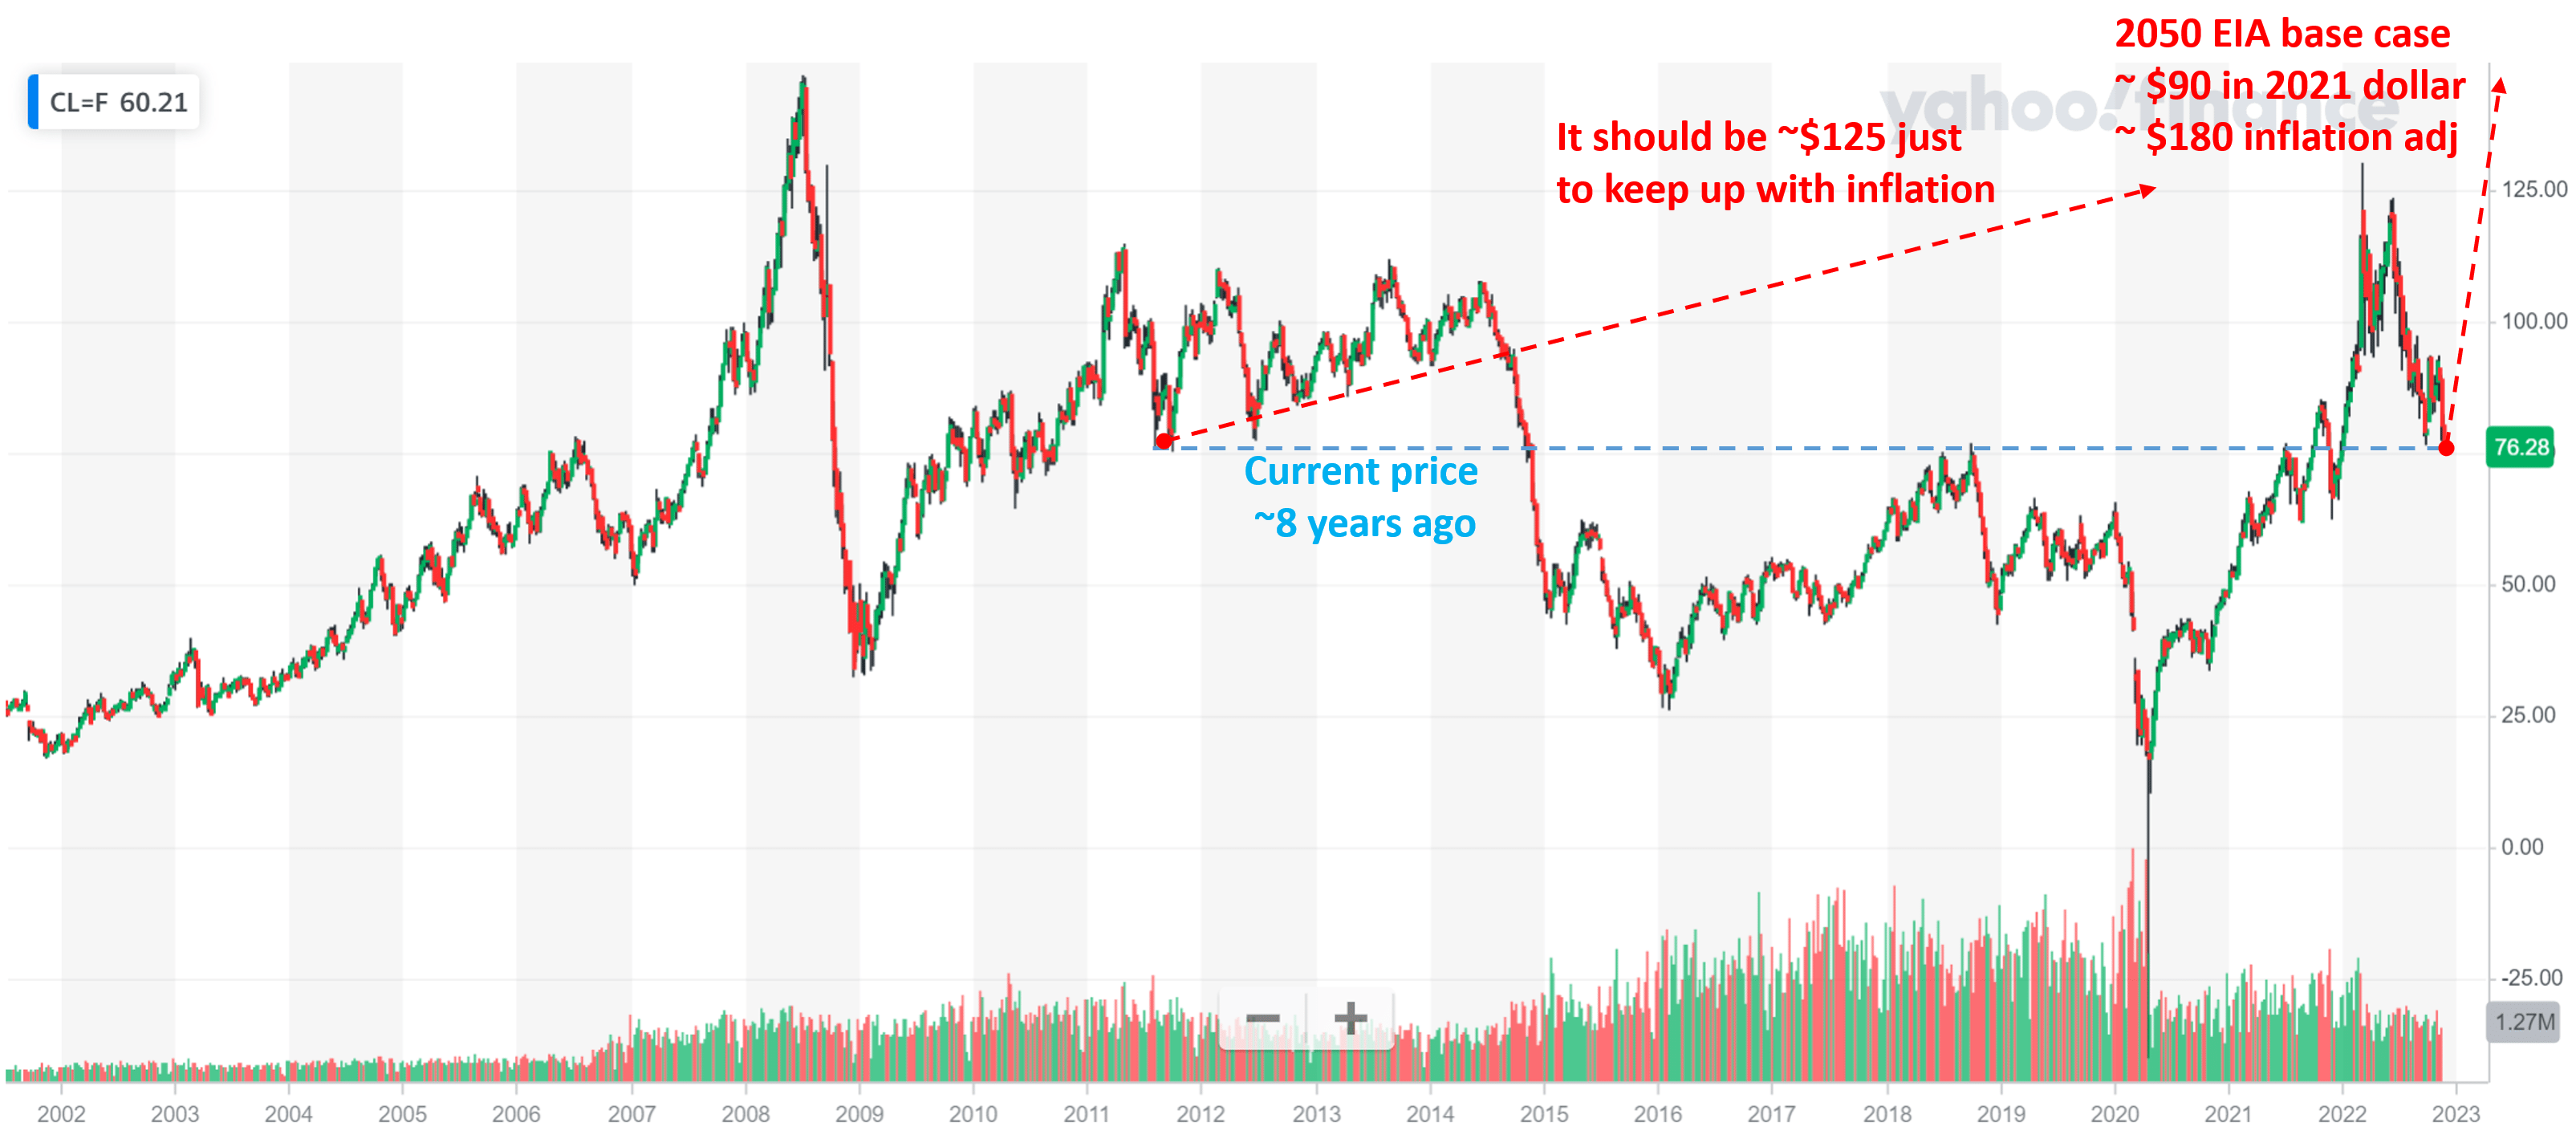
Other Roles of Oil and NG
Finally, there is an incredible spectrum of other applications for oil and NG. Both crude oil and NG are used in an incredibly wide spectrum of chemical processes to make things that we rely on in our daily lives, and I foresee these applications will continue for a long time even if we no long use them as fuel sources.
Here is where we can really learn from history by taking a really long view, as shown in the next chart below. Our energy landscape was dominated by biofuels (i.e., wood and straw, not the renewable biofuels we talk about now) until the industrial revolution around 1800. These biofuels have been in decline for more than 200 years by now, and yet they are still currently playing a role in our energy mix, as you can see from the chart below. And their other uses besides being burned have continued to the present as well.
Specific to oil and NG, the role of NG in our energy mix has been climbing consistently since ~1900, and the share of oil has “only” started decreasing about 50 years ago. And also keep in mind that the chart shows the relative share of different energy sources, not the absolute amount of each fuel burned. Considering that our overall energy demand has increased remarkably over the past 50 years, we are actually using much more oil and NG in absolute amounts now than 50 years ago. And here again, both oil and NG have found a wide spectrum of applications besides being a fuel. For example, they are both key feedstock for the production of a wide range of crucial chemicals and materials vital to our daily life.
Source: Energy and Civilization – A History By Vaclav Smil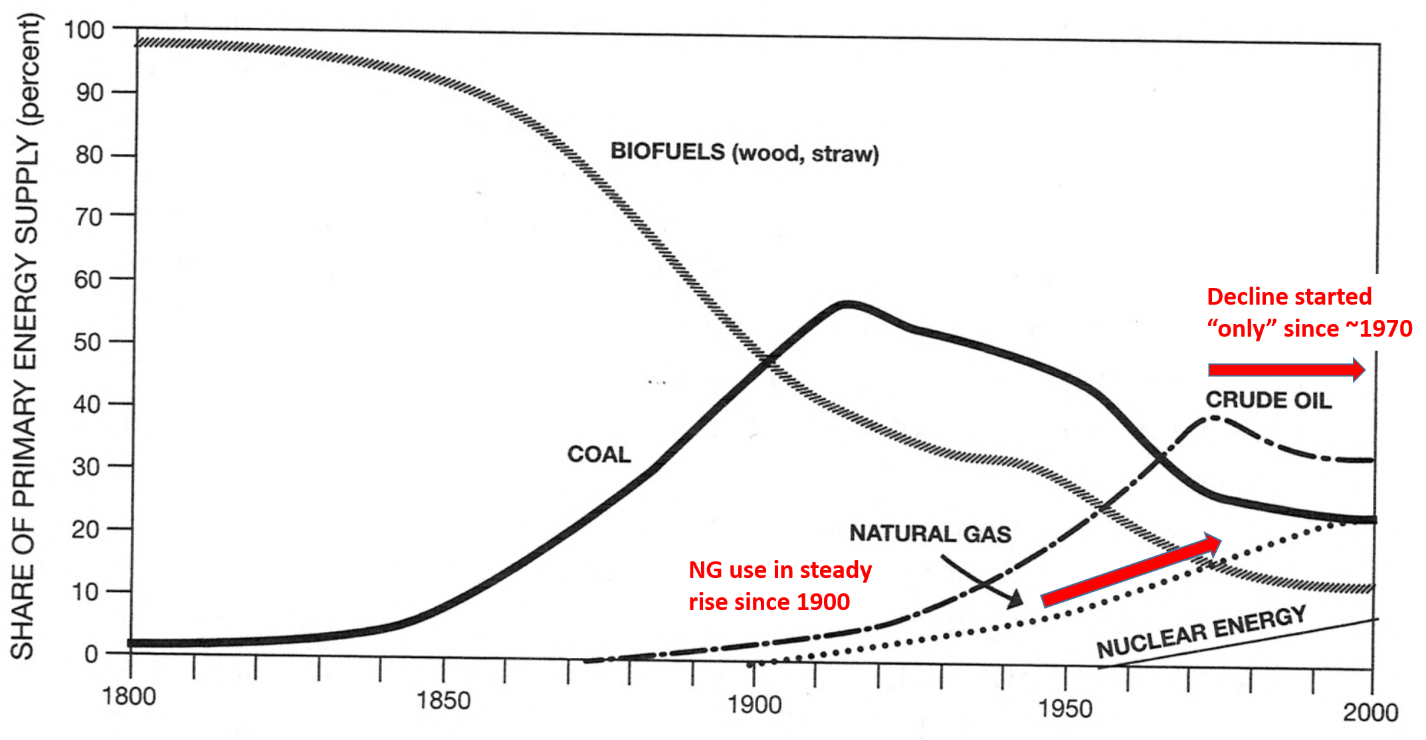
Risks and Final Thoughts
Investments in XOM and CVX do entail risks. In the short term, the Ukraine/Russian war is the biggest uncertainty, in my view. The eventual duration and ultimate outcomes of the war (as with any war) are completely uncertain. The progress of the war could create dramatic impacts on both the global energy market and the stock markets in unpredictable ways. The development of COVID-19 variants is also a large uncertainty. Depending on a resurgence in cases, large economies like the U.S. and China could reinstitute large-scale travel restrictions and disturb the supply/demand dynamics in the near term. In the longer term, our world is shifting (and, in my opinion, it needs to do so more quickly) away from fossil fuels. XOM’s and CVX’s role in this tectonic shift is uncertain.
All told, my thesis is not to argue against our green energy future. It is more about the time frame and the margin of safety. The thesis is a kind of arbitrage of time and valuation. I am betting the time frame for the shift to be longer than we thought (or Bill Gates thought). Furthermore, in the case of XOM and CVX, their current proven reserves alone already leave a wide margin of safety (~33% for XOM and ~23% for CVX). The margin is only wider considering that both companies have other profit streams (downstream operations), are actively exploring new reserves, and are also aggressively investing in green energy sources. In addition, there are a multitude of other industrial uses for crude oil and NG besides burning them to provide energy.
Be the first to comment