

Chaosamran_Studio/iStock via Getty Images
Strategy Is Crucial To Success
Through my personal experience navigating the financial markets over the years, I have come to appreciate the importance of having a well-defined investment strategy. My personal observation of many investors throughout my profession as a portfolio manager revealed that not having a well-defined investment strategy was often the root cause of poor performance, if not outright failure. In some cases, poor performance was a result of inconsistencies in executing a fundamentally sound strategy due to a lack of discipline. But in most cases, poor performance was due to more fundamental reasons such as unrealistic risk/return expectations, logically flawed strategies, gambling-like speculative behavior, and simply not having a strategy at all.
After observing and studying the behavior and performance of investors with varying investment styles and trading approaches, the key principles separating successful investors from the stragglers became quite clear to us. However, what is challenging is how to effectively compress these key principles into a consistent and well-defined strategy without sacrificing depth and rigor, while also allowing some flexibility in the investment decision-making process. Our work over the years has evolved into a framework that systematically organizes the multi-faceted challenges of developing and executing a successful investment strategy.
This article is the first of a multi-part series, where we will walk through our framework for building a comprehensive and systematic investment strategy relying heavily on an evidence-based approach. As we walk through the different components of the framework we will share some of our thoughts on the specific topic at hand, highlighting why we favor certain choices over others. Do note that the choices presented may not necessarily be optimal for some investors depending on their unique risk appetite, return aspirations, investment horizon, and other preferences. We highly encourage readers to adapt their own strategies to the framework as they follow along or experiment with different possible combinations. The key is to ensure that those choices are logically consistent.
A Framework To Organize Core Investment Principles
There are several components that make up our investment framework and some may be interdependent or have overlapping purposes. Each core component is organized to systematically achieve a particular investment objective or to manage a specific problem. Below is a list of the core components:
- Investment Objectives – Risk Tolerance & Return Targeting
- Strategic Asset Allocation – Asset Class Risk & Returns
- Tactical Asset Allocation – Market Cycle, Macro & Factor Investing
- Alpha Generation – Trading Strategies, Factor Selection, Market Timing
- Choice of Instrument – Securities, ETFs, Derivatives, Structured Products
- Security Selection – Stock Selection, Fund Selection.
A common pitfall for investors is the tendency to rely exclusively on a single component – typically a trading strategy, a technical indicator, or an instrument. Thus, strategies, indicators, and instruments are rarely applied with an overarching investment objective in mind. Many investors also tend to target returns that may be inconsistent or unrealistic given their risk tolerance and investment horizon. The typical end result is excessive risk-taking that leads to heavy losses and panic selling when markets turn volatile.
We firmly believe that building a well-defined investment strategy that achieves breadth, balance, and consistency, is crucial to investment success. Not only does a well-defined strategy provide a clear roadmap to achieving desired investment objectives, but it also instills confidence and focus during execution. An evidence-based approach provides some degree of visibility to potential risks and returns, so investors can objectively monitor performance and determine if the strategy is on track.
In this article, we will attempt to address the first two components of this framework with a reasonable degree of depth. Investment objective setting and strategic asset allocation are crucial components of the framework given that they set the overarching direction of the investment strategy.
At the end of this multi-part series, we should arrive at an actionable investment plan with clearly defined parameters for achieving our desired investment objectives. Here is a quick preview of what that investment plan may look like at the end of this multi-part series.
Stratos Capital Partners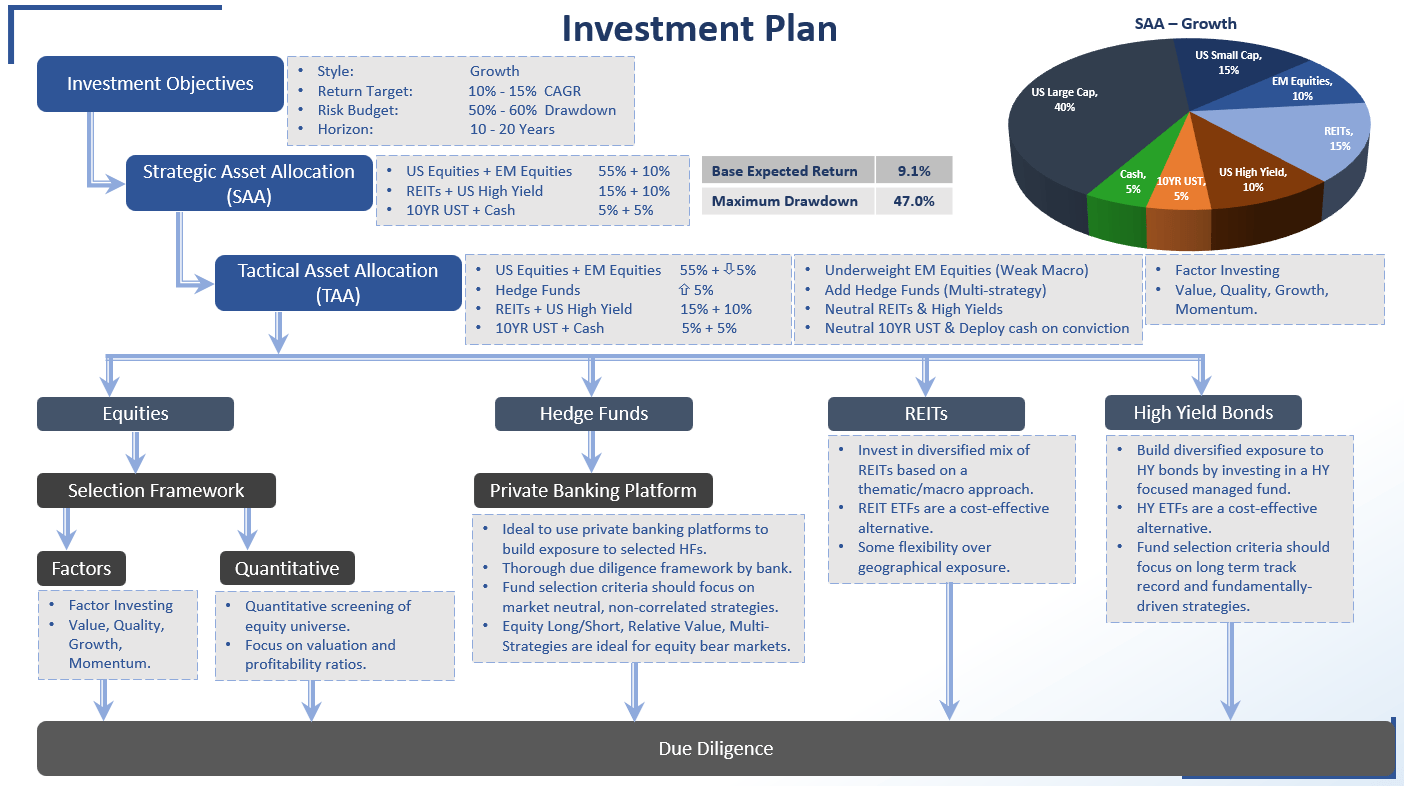
But before we dive into the framework, we need to first outline some core principles underlying our investment philosophy. Keeping these principles in mind will help the reader to better understand why we favor certain choices as we flesh out the components in our framework.
Investment As A Science
A scientific approach to investing provides significant advantages although there is some truth in describing the discipline of investing as a mix of both science and art. Because scientific claims are verifiable while artistic talent cannot be reliably reproduced, most professional investment managers lean heavily towards the scientific approach. One of the main advantages of scientific investing in our view is that it minimizes behavioral biases and subjective thinking. That the value of an asset, and its future performance should be determined based on reasonable assumptions backed by evidence.
The aim of evidence-based investment strategies is to profit from statistically meaningful and recurring patterns in the financial markets. Such evidence is usually derived from long periods of historical data and hence, provides objective estimates of the potential risk and returns of an asset. Our systematic framework can then be adapted to try to capture these recurring patterns over time while recognizing and accommodating the noisy/random characteristics of financial markets in the short term.
Time In The Market Over Timing The Market
The evidence is overwhelmingly in favor of investors who take a long-term approach to the business of investing. A quick Google search on the most successful individuals on Wall Street’s investing hall of fame would show that the majority of them adopt a long-term investment horizon. Similarly, the world’s most successful sovereign wealth funds and endowment funds also tend to adopt a long-term horizon. For the sake of clarity, we define success not just by superior risk-adjusted returns, but also longevity or sustained performance over long periods of time and across market cycles. This point is absolutely crucial because it is pointless to invest in superior performance that ultimately collapses without warning (e.g., Long-Term Capital Management, and other hedge fund scandals).
Taking a longer-term approach also weeds out strategies that only perform well when it is traded in the right market cycle. For example, some strategies outperform spectacularly well during a bull market with a concentrated bet on technology stocks, but risk getting wiped out when the tech bubble bursts. Or short strategies that make huge returns during the 2008-2009 financial crisis, but underperformed in the decade-long bull market thereafter. The real problem here is that despite the sophistication behind these strategies, investors are still required to time major market turning points and have to switch strategies with some level of finesse in order to perform well over time. Relying too heavily on market timing not only places the investor at risk of irreparable losses if they get the timing wrong, but investors also suffer the opportunity cost of not investing in proven strategies that have performed well over long periods of time and across market cycles.
From our standpoint, there are much more reliable and sensible choices of strategies that are backed by historical evidence and simply good logic. One example is the traditional buy-and-hold strategy, which aims to compound returns over long periods of time where the average position is usually held for several years. With this buy-and-hold strategy as a foundation, investors can then try to outperform the market by adding other tactical elements to the strategy without having to deviate substantially from the original plan. Simply by staying invested, the odds are already in favor of buy-and-hold investors since equity markets drift higher over time. There is no need to take the “all-in” or “all-out” approach that is often associated with market timing.
It is certainly not a coincidence that many successful investors tend to pick long-term investment horizons. Another reason for their success is that financial markets are usually subjected to high levels of noise in the short term (transactional volatility, fickle sentiment, and random news events), but are fundamentally driven by real economic forces that evolve over longer time frames. As such, secular economic cycles tend to be much easier to anticipate and predict versus daily/weekly price action.
Stratos Capital Partners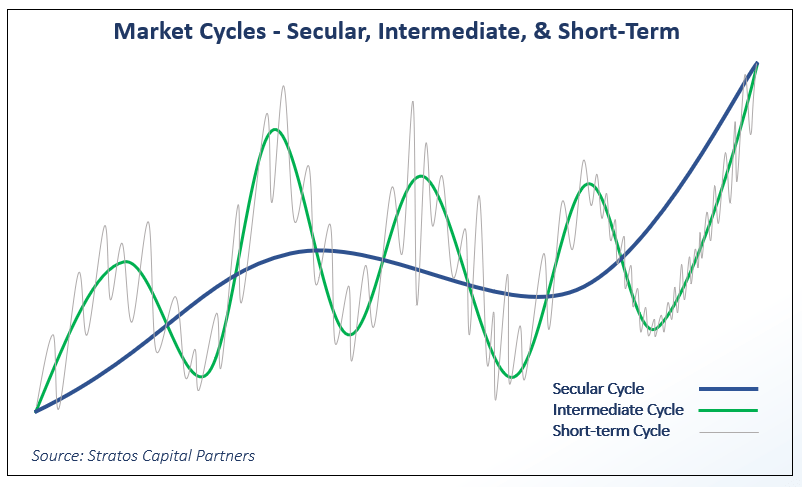
Another common mistake that investors make is to have unrealistic expectations that resemble a “get rich quick” strategy. Unrealistically high expectations for returns mean that long-term investing may seem inadequate for meeting those lofty targets. Unfortunately, this encourages investors to pursue risky trading strategies that are destined for failure before they even begin. Indeed, Wall Street is littered with hedge funds stars and day traders that seem to perform spectacularly well for a couple of years, but few have managed to sustain high returns for more than a decade.
Systematic Strategies Take the Emotions Out Of The Equation
The biggest advantage of a systematic strategy is that it takes most of the guesswork and emotions out of investment decision-making. Since most of the decisions are based on evidence from historical data and are clearly defined when designing the strategy, this leaves very minimal decision-making on a day-to-day basis. This spares the investor from the emotional ups and downs of monitoring the markets and succumbing to the pressure to react to every piece of news development that is sensationalized by the financial media.
Tactical strategies are necessary if one wishes to enhance portfolio returns beyond what passive asset class returns can provide. Even when selecting tactical strategies to implement in our quest for portfolio alpha, we lean heavily towards systematic strategies and tactics that seek to minimize behavioral biases and short-term decision-making.
There is probably no end to debating investment philosophy and principles, but we hope we have covered sufficient material in this section to give a good overview and reference for our framework choices in the following sections. Now we are ready to dive into the core components of our framework.
The Framework
1) Setting Investment Objectives – Risk Tolerance & Return Targeting
The task of matching investment objectives to an individual investor’s risk tolerance is one of the most crucial components of a well-defined investment strategy. This is because the desired return target and risk budget determine the overall direction and limits of the investment strategy, which then flows through consistently to the other framework components.
Here, investors often struggle with balancing between greed and fear. It is quite common to see investors targeting high compound annual growth rates (CAGR) of 20%-30% for their portfolios, but are unwilling to tolerate even single-digit drawdowns.
We will skip discussing personal finance and retirement-related topics, but we briefly note that investing with a return target in mind that will help you to achieve your desired life goals is often a great way to start. A better appreciation of the effects of compound returns and choice of investment horizon will certainly help investors make better-informed choices.
The accompanying chart demonstrates how different return targets (5%, 10%, 15%) produce sharply different outcomes when returns are compounded annually over long periods of time.
Stratos Capital Partners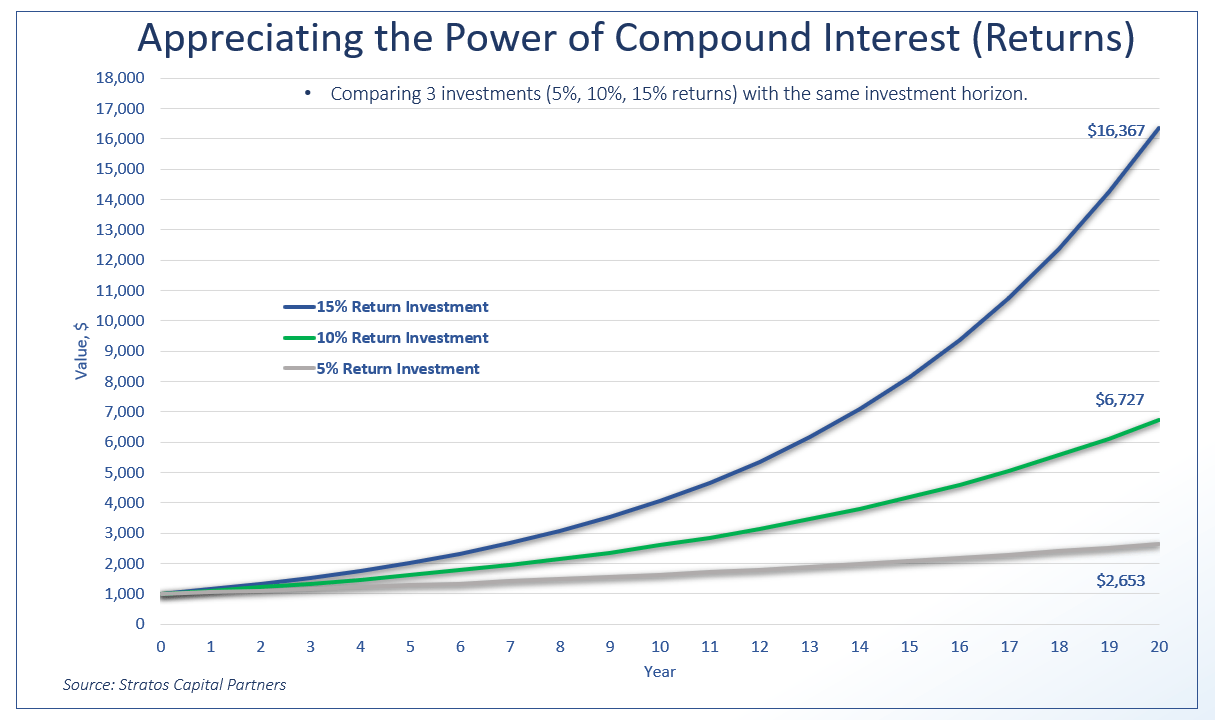
In short, investment returns grow exponentially over time due to the effect of compound interest, and small increments in the rate at which returns are compounded result in large differences in performance the longer the investment horizon. For example, the difference between targeting a 15% CAGR versus a 5% CAGR over 20 years, is a 1,537% holding period return for the former compared to just 165% for the latter.
A portfolio’s return target should always be considered together with the risk tolerance of the investor. And this is where the difficulty lies. Almost every investor wishes to maximize returns and minimize risks, but there are unfortunately very few free meals in the financial markets. Diversification may sound like a broken record, but it may be one of the most reliable solutions to reducing portfolio risk.
We will briefly summarize the essence of diversification here: by combining a diverse mix of assets that are not closely correlated, we can reduce overall portfolio volatility as the impact of short-term price fluctuations among assets offset each other, while asset valuations trend higher over the longer term.
Although diversification is a proven method that can help to reduce overall portfolio volatility, some investors may hold the wrong impression that diversification can eliminate drawdowns. Unfortunately, even the most well-diversified portfolios are not immune to drawdowns, especially during an economic downturn when valuations of risky assets may fall in unison.
The best way to manage this is to build a portfolio that has an acceptable level of anticipated drawdown that the investor can tolerate without suffering a panic attack. To estimate how deep these drawdowns are likely to be, we rely on the historical performance of different asset classes over several market cycles as a guide.
Of course, the usual caveat is that past performance is not indicative of future results. But analyzing historical performance is at the very least an objective method of understanding how markets are likely to behave in the future with the assumption that markets have not fundamentally and dramatically changed over the past few decades. To improve the reliability of such analyses of historical performance, the dataset should also encompass a good sample of past economic downturns and major crises. In the next section where we discuss strategic asset allocation, we will look into the historical performance of major asset classes going back almost three decades. We select this particular time frame because it adequately covers a variety of major events affecting the performance of different asset classes over the years. This includes the global financial crisis (2008-2009) followed by the equity bull market (2010-2020), several commodity bull-bear cycles (crude oil, copper, gold), the Covid-19 pandemic, monetary policy cycles, as well as the current high inflation and interest rate environment.
In terms of risk tolerance, investors should examine their own financial circumstances, including savings, age, income, expected expenses, retirement lifestyle aspirations, and even their behavioral biases and psychology. Ultimately, the aim is to set an appropriate return target that will satisfy our investment objectives without compromising our tolerance for risk.
Portfolio risk may be generally defined as anticipated maximum drawdown or volatility. For long-term investors, the maximum drawdown of a portfolio’s value is much more relevant compared to annualized volatility, which is what most fund managers use to report risk. Maximum drawdown simply refers to the estimated maximum marked-to-market loss on a portfolio that the investor is expected to experience at any point in time given the investment horizon. Unlike traders or hedge fund managers who are constantly under pressure to outperform every single year or even quarter, short-term volatility measures are usually less meaningful for long-term investors.
For the purposes of this walkthrough, we will adopt a slightly aggressive growth portfolio approach with a return target of 10%-15% CAGR. This would entail accepting a potential portfolio drawdown of around 50%-60% based on historical performance, which we will elaborate in the next section.
Stratos Capital Partners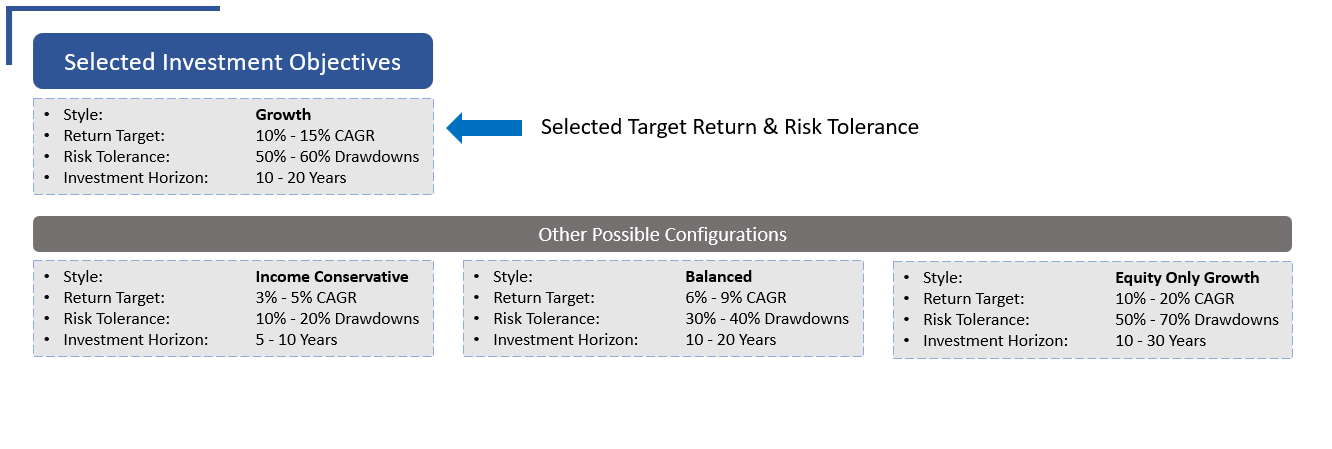
2) Strategic Asset Allocation – Asset Class Risk And Returns
Matching target returns to an investor’s risk tolerance is usually an iterative process involving the selection of asset classes and allocating the portfolio accordingly to see if the desired target return can be achieved while staying within risk limits. This is usually the part where investors realize that their target return is too ambitious given their risk tolerance, or that there is simply no way of achieving their target return given how asset classes have performed historically. Reality hits hard.
The good news is that strategic asset allocation is not the be-all and end-all for achieving one’s investment objectives. The purpose of strategic asset allocation is to set base risk/return expectations for a passive investment approach. It is certainly possible to further enhance returns or reduce risk through tactical asset allocation, stock selection, adding hedge funds, and using various trading strategies and tactics.
Our main contention is that these commonly discussed tactical elements for enhancing portfolio returns and managing risk are often treated as standalone ideas, often without an overarching investment strategy in place. Thinking of these different tactical elements within a framework helps to better align them towards a common investment objective.
Historical Performance Of Asset Classes
The table below shows the historical performance of major asset classes over the past 27 years (1995-2022). Our analysis only goes back to 1995 and not further because data on emerging market equities were only available from 1995 onwards for the data provider (portfoliovisualizer.com) we have selected specifically for the purposes of this article. This section will thus rely heavily on screenshots of our demo portfolio on this website for our discussion. We also advise against analyzing datasets that stretch too far back into history as financial markets and the macroeconomic environment may have evolved structurally and substantially over the decades.
portfoliovisualizer.com, Stratos Capital Partners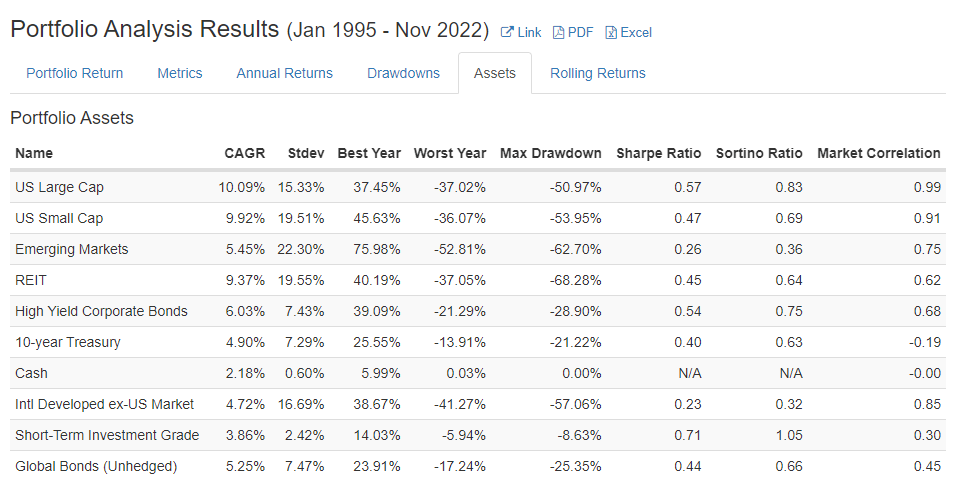
A quick shortcut for comparing the performance of different asset classes is to look at the Sharpe Ratio, which measures risk-adjusted returns. By this measure, the top three asset classes since 1995 include U.S. Large Cap, Short-Term Investment Grade Bonds, and High Yield Corporate Bonds.
There are also alternative asset classes such as commodities, hedge funds, private equity and venture capital, which have not been included in the table due to insufficient data. Nonetheless, we think this is a good starting point for most investors. Perhaps we can consider alternative assets in later parts of the series where we will focus on return enhancement strategies and portfolio alpha.
In the interest of article length, we will skip the lengthy discussion on why market cycles since 1995 have favored asset classes such as U.S. equities and fixed income, or why investing in broad commodities has been a loss-making venture. There have been countless debates and analyses on such topics, but we generally point to the low inflation and loose monetary policy era as key factors explaining this performance.
Investors should certainly consider what the future macroeconomic environment may look like when making strategic asset allocation decisions. As a starting point, we recommend using various “capital market assumption” reports published annually by major financial institutions such as J.P. Morgan, BlackRock, and Invesco (click on direct links to these reports).
In terms of our own views on asset class performance here at Stratos Capital Partners, we expect U.S. large-cap equities and U.S. high-yield bonds to continue to outperform over the long run. This is based on our view that valuations on U.S. equities are attractive, while we expect inflation and interest rates to normalize over the next 12-18 months and to remain structurally low and stable over time. We also like real estate investment trusts (“REITs”), as we believe that fears over high mortgage rates are overblown and that the U.S. real estate sector is structurally more resilient than most analysts think. For emerging markets, we avoid China altogether as we think political risks have not been adequately discounted by investors and will continue to undermine the performance of Chinese assets long term. Thus, we would allocate our emerging market exposure selectively towards Southeast Asian and Latin American markets.
Some readers may realize at this point that our discussion of strategic asset allocation for our demo portfolio may seem unorthodox and involve tactical asset allocation decisions. We confess that this is true and intentional. We believe that there should be some flexibility when determining strategic asset allocation, and this necessarily requires that investors take a view on the future performance of asset classes. However, we are against making frequent adjustments to strategic asset allocation, which would defeat the purpose of matching asset class risk/return profiles to long-term investment objectives and risk tolerance. Ideally, what we want to achieve is to hold a long-term view on asset classes and be loosely selective, but commit to the strategic asset allocation mix in implementation. Tactical allocation adjustments should only be made with the aim of enhancing short-term risk/return based on tactical views.
As the table below demonstrates, our long-term views on asset classes are consistently reflected and expressed by our choice of a slightly aggressive growth portfolio approach with a return target of 10%-15% CAGR (investment objectives). Furthermore, our asset class views are also carefully aligned with our demo portfolio allocation (strategic asset allocation) shown below, which is aimed at achieving our aggressive return target. Once again, this is the result of an iterative process, and readers should experiment by making different adjustments to their strategic asset allocation to see if it has the potential to meet their defined long-term investment objectives.
portfoliovisualizer.com, Stratos Capital Partners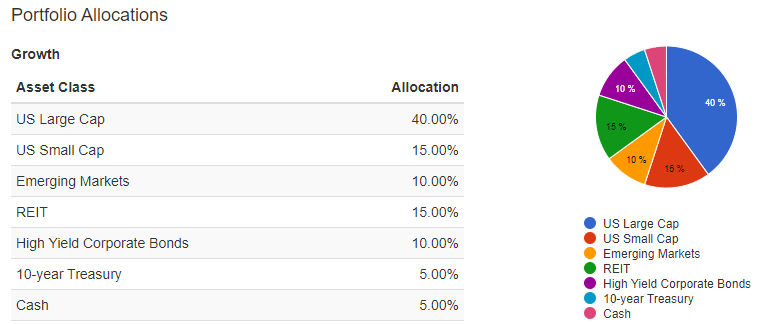
Analyzing Back-tested Portfolio Performance
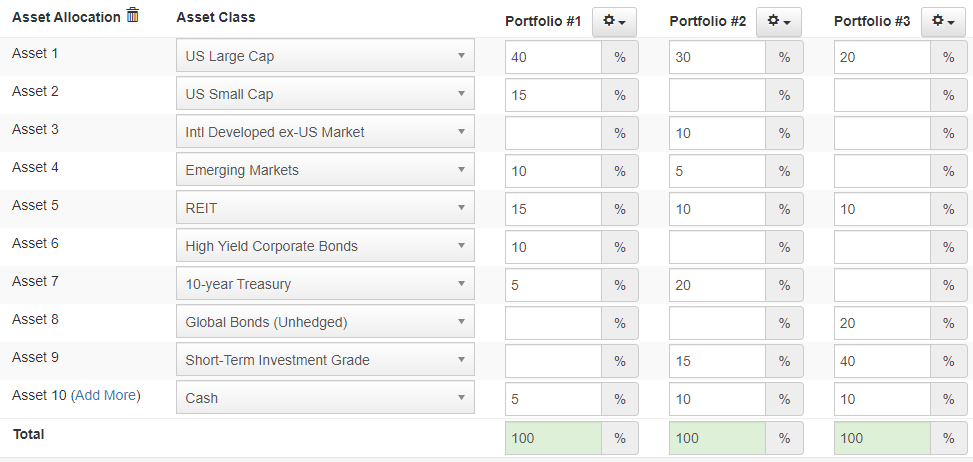
Now that we have determined our investment objectives, selected our preferred asset classes, and arrived at our strategic asset allocation for our portfolio, let’s look at the simulated performance of our demo growth portfolio. We have conveniently included other configurations for a balanced portfolio and a conservative portfolio for comparison.
portfoliovisualizer.com, Stratos Capital Partners Portfolios are in the following order: Growth (#1), Balanced (#2), Conservative (#3) (Source: portfoliovisualizer.com, Stratos Capital Partners)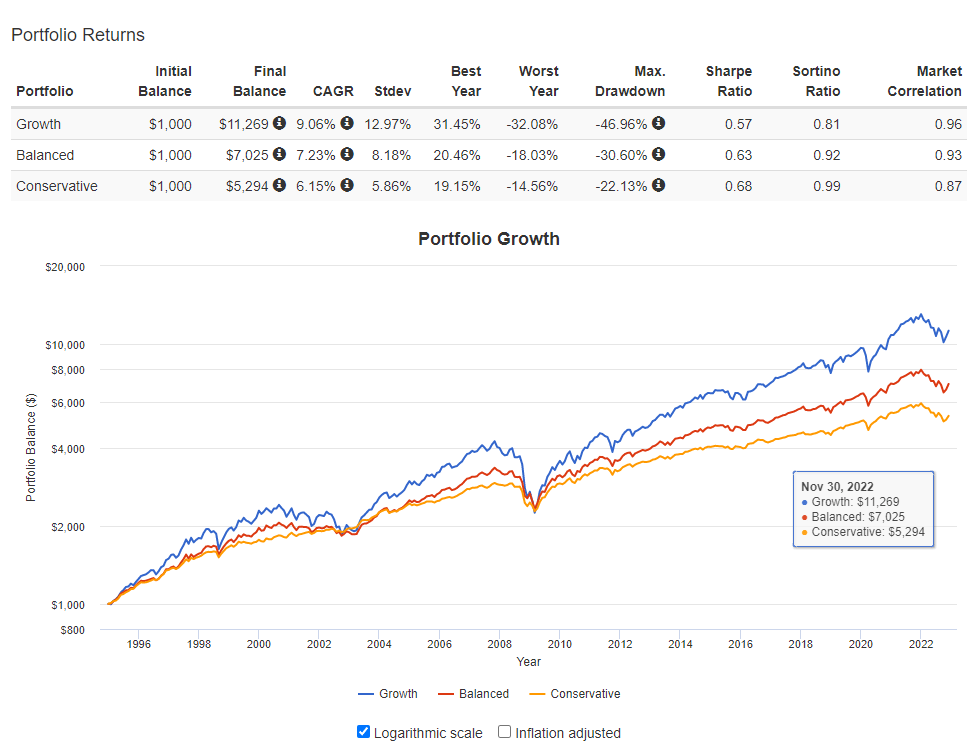
As the historical simulation show, our demo growth portfolio allocation would have achieved a 9.1% CAGR with a maximum drawdown of 47% (2008-2009 global financial crisis) over the test period of Jan 1995 to Nov 2022. These results show that a passive investing approach using a strategic asset allocation mix alone can bring us within reach of our 10-15% CAGR target return while staying under our risk tolerance for 50-60% drawdowns. The investment objective table and our newly added strategic asset allocation table have been reproduced below.
Stratos Capital Partners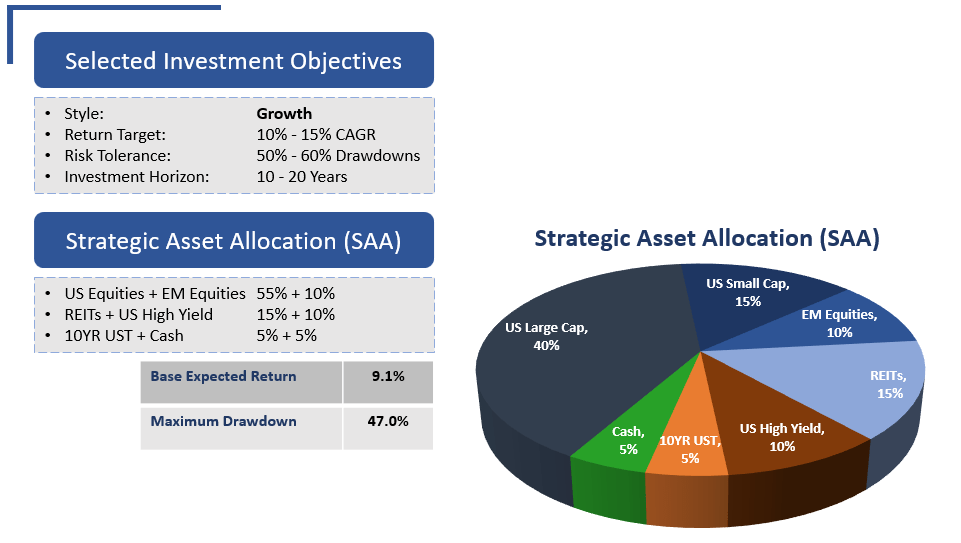
Below is a chart comparing simulated portfolio drawdowns for the same three portfolio configurations we have tested. The key takeaway here is that if investors aim for high returns, they should generally expect higher risk.
portfoliovisualizer.com, Stratos Capital Partners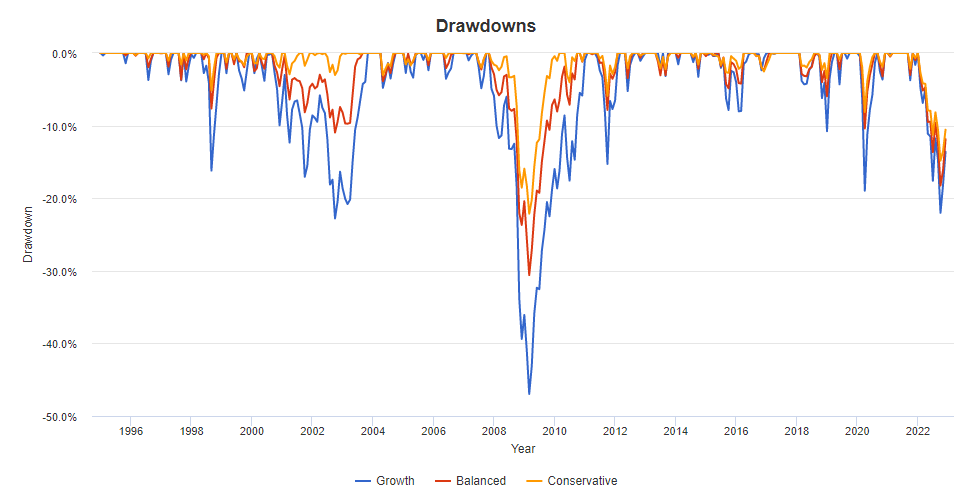
What’s Next In Our Multi-Part Series
We hope that we have provided a helpful guide on investment objective setting and strategic asset allocation in this article. The decision to delay discussing the more exciting elements of investing and saving those topics for later parts of this series is intentional. Because without getting the basics right and laying the foundation for disciplined investing, we see little value in exploring performance-enhancing strategies and tactics.
Recall that we mentioned that the purpose of strategic asset allocation is to set base risk/return expectations for a passive investment approach. And that it is certainly possible to further enhance returns or reduce risk through tactical asset allocation, stock selection, adding hedge funds, and using various trading strategies and tactics.
These topics will be discussed in subsequent parts of this multi-part series. So please stay tuned. We welcome any questions and feedback, and we look forward to participating in the debates and discussions in the comments section.
Be the first to comment