

da-kuk/iStock via Getty Images
U.K. stocks continue to outperform the rest of the world yet remain extremely undervalued on a relative basis as earnings and dividend growth continue to outstrip that of their peers. I remain long the iShares MSCI United Kingdom ETF (NYSEARCA:EWU), which I have held since the March 2020 low. While the outlook has deteriorated since then thanks to the strong gains already seen, the ETF still offers long-term return prospects of around 3% in real terms, which is significantly higher than most other developed markets.
The EWU ETF: Commodities And Financials Heavy
The EWU tracks the performance of the MSCI U.K. Index and covers approximately the top 85% of investable universe in the U.K., with an expense ratio of 0.5%. As the chart below shows, the index is reasonably well-diversified, although for a developed market it has significantly higher exposure to commodities and lower exposure to technology.
EWU Sector Weightings (iShares)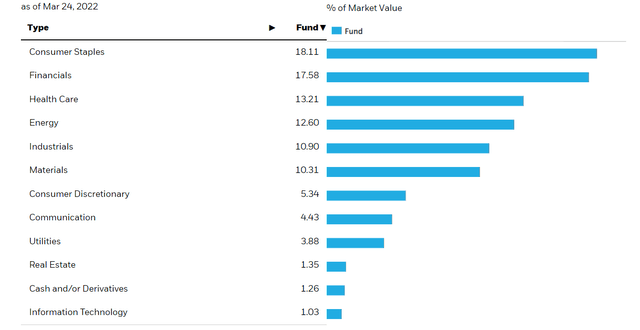
This sector breakdown has been the main reason for the EWU’s underperformance over the past decade. However, with global commodity prices receiving a significant boost due to the West’s response to the Russia-Ukraine war, and global tech stocks seeing some weakness amid rising interest rates, this largely explains the EWU’s outperformance in recent months.
Financials also make up a hefty 18% of the index, which again is significantly higher than developed market averages. The underperformance of financial stocks over the past decade has also weighed on the EWU, but the sector is now trading at extremely discounted valuations which suggest potential for strong outperformance. The trailing price/earnings ratio is actually lower now than at the height of the Covid crash.
MSCI U.K. Financials: Trailing PE Ratio (Bloomberg)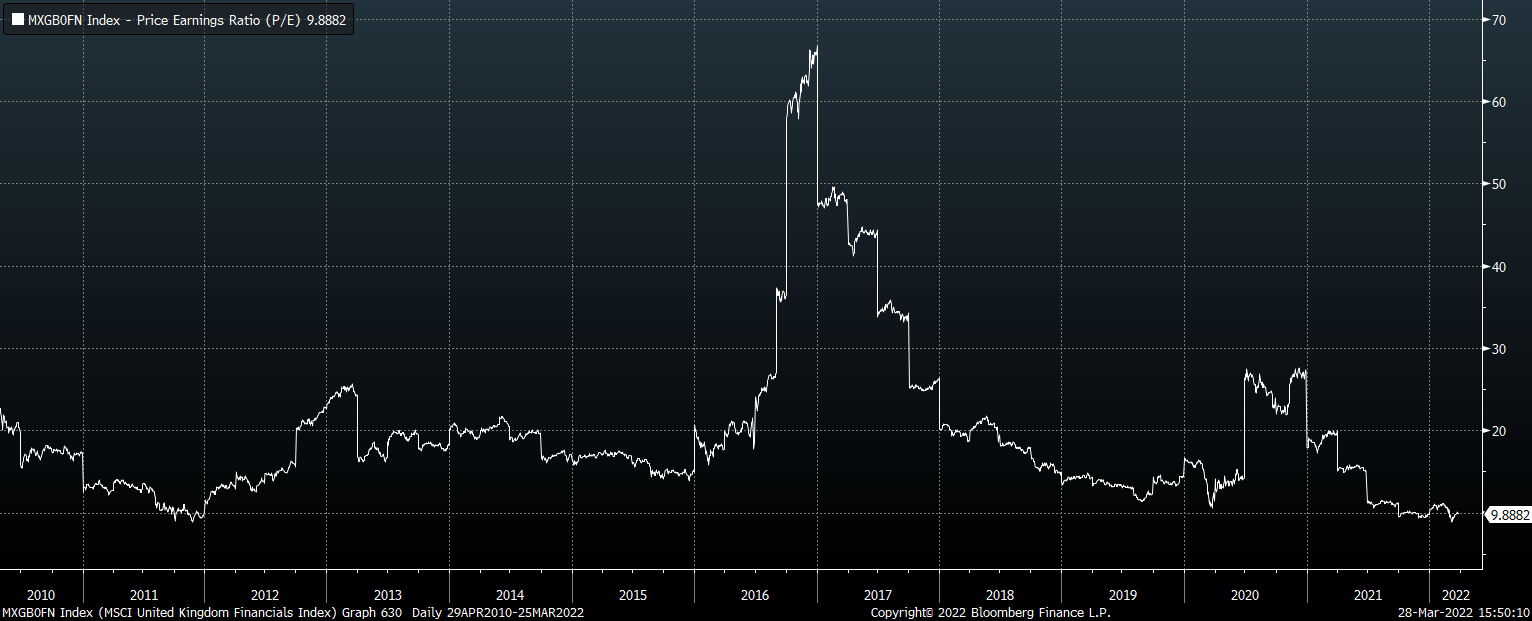
The EWU’s current distribution yield is 4.3% which is now slightly above the underlying MSCI U.K.’s 3.8% and so should be expected to come down over the coming months. However, dividend growth expectations remain positive which should allow the ETF to continue paying around 4% absent a significant rise in prices.
Earnings And Dividends Continue To Outpace The Rest Of The World
The MSCI U.K.’s earnings were hit particularly hard by the Covid recession. A combination of a painful domestic recession and a fall in global commodity prices saw earnings per share fall by over 90% from their January 2020 highs to their November 2020 lows. However, the recovery since then has seen the MSCI U.K.’s earnings outperform the rest of the world even when measured from the beginning of 2020.
Earnings Per Share Rebased to Pre-Covid Levels: UK, US, World ex-US, and EM (Bloomberg)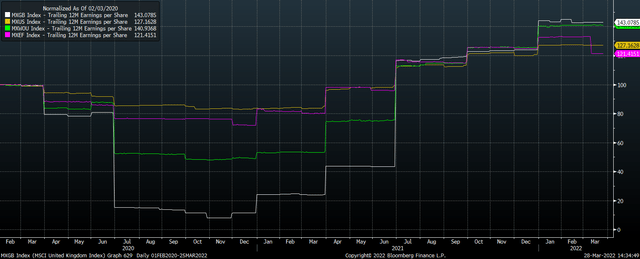
As a result, the trailing price/earnings ratio has continued to fall even as U.K. stocks have recovered strongly. The current trailing PE ratio sits at 15.3x, no higher than the level seen at the March 2020 low. Furthermore, Bloomberg analyst estimates see a further 35% increase in earnings per share over the next month, putting the forward PE ratio at just 11.3%. As a result, the MSCI U.K.’s discount to the rest of the world remains substantial.
Forward PE Ratio: UK, US, World ex-US, and EM (Bloomberg)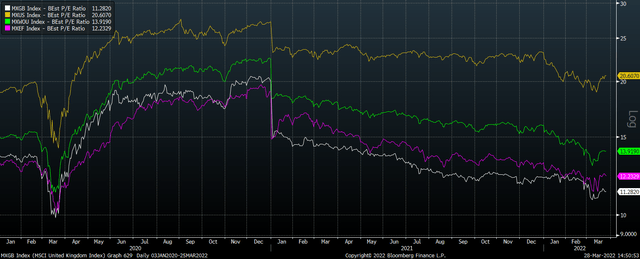
This undervaluation continues to be reflected in the significantly higher dividend yield that U.K. stocks pay relative to the rest of the world. The U.K.’s forward dividend yield is around a third higher than that of emerging market stocks and international developed stocks, and almost 3x higher than the U.S.
Forward Dividend Yield: UK, US, World ex-US, and EM (Bloomberg)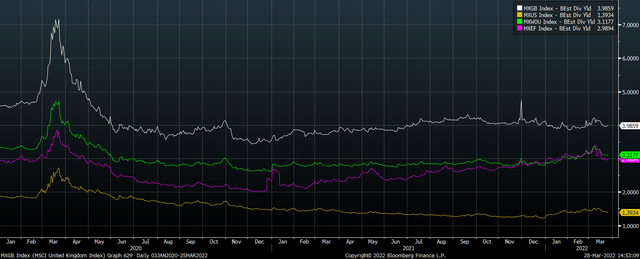
The good thing about buying cheap stocks with high dividend yields is that a recovery in valuations is not needed in order to generate strong returns. In an article I wrote in August last year I laid out the long-term return expectations for U.K. stocks relative to the U.S. (see ‘U.K. Over U.S. Stocks: A Generational Relative Value Play’). Below is an updated version of the table.
Annual 10-Year Return Forecast For MSCI U.K. And S&P 500
|
MSCI U.K. |
S&P 500 |
Difference |
||||
|
Aug-21 |
Mar-22 |
Aug-21 |
Mar-22 |
Aug-21 |
Mar-22 |
|
|
Dividend Yield |
3.5 |
3.8 |
1.3 |
1.4 |
2.2 |
2.5 |
|
Real Dividend Growth |
2.0 |
0.5 |
0.0 |
0.0 |
2.0 |
0.5 |
|
Change In Dividend Yield |
-2.0 |
-1.5 |
-7.0 |
-7.0 |
5.0 |
5.5 |
|
Real Annual Total Return |
3.6 |
2.8 |
-5.7 |
-5.6 |
9.2 |
8.5 |
Source: Bloomberg, Author’s calculations
Even in the absence of any change in valuations, the U.K. should outperform the U.S. by 2.5% annually thanks solely to the market’s cheaper valuations which manifest in its higher dividend payments. If valuations mean revert as I expect and as they have reliably proven to in the past, U.K. valuations are likely to decline slightly, resulting in 2.8% annual real returns, but the U.K. should be expected to outperform the U.S. by 8.5% annually in total return terms.
Be the first to comment