

Yevhenii OrloIntroductionIntroduction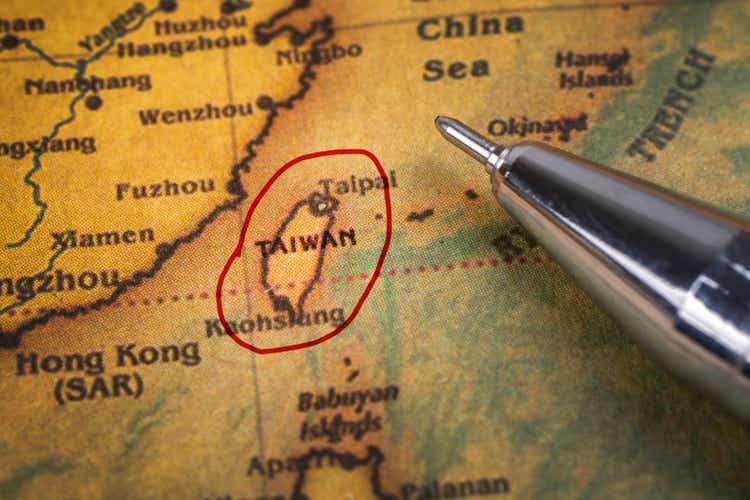
Introduction
Semiconductors are the building blocks of modern technology. And the small country of Taiwan is arguably semiconductor center of the world, home to many critical parts of the overall semiconductors value chain.
Thus, when the semis enter a period of weakness, Taiwan’s equity markets do too. In this article, I discuss a Taiwan equity ETF. This is part of my ongoing series to search for global investment opportunities. Check out my profile to see other country specific ETFs I have analyzed; UAE (UAE), Japan (EWJ), Turkey (TUR), China (MCHI), Pacific markets (VPL), and Canada (VDY:CA).
EWT; A Taiwan Equity Proxy
The iShares MSCI Taiwan Capped ETF (NYSEARCA:EWT) tracks the investment results of an index composed of Taiwanese equities. Here’s what it is made of:
EWT ETF Composition
Sector Composition
EWT ETF Sector Exposures (EWT ETF Website, Author’s Analysis)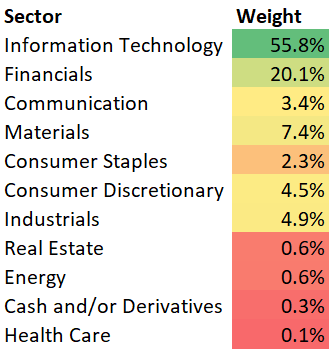
Taiwan’s equity market has a very concentrated exposure towards information technology and this is seen in the EWT ETF too with a 55.8% weight overall. Note that most of this exposure is not in asset-light software businesses or labor-intensive IT services. Rather, it is in hardware-heavy semiconductor and electronics manufacturing.
Top 5 Holdings
EWT ETF Sector Exposures (EWT ETF Website, Author’s Analysis)
EWT is a top-heavy index with the world’s leading semiconductor foundry, Taiwan Semiconductor Manufacturing Company Limited (TSM) making up 21.3% of the overall index and almost 62% of the collective top 5 exposure. Other stocks in the top 5 include Hon Hai Precision (OTCPK:HNHAF) (OTCPK:HNHPF), MediaTek (OTCPK:MDTKF), Delta Electronics (OTCPK:DLEGF) and United Microelectronics (UMC). All of EWT’s top 5 companies lie within the semiconductor or electronics industry that falls under the gamut of GICS’s Information Technology classification.
TSM Dictates EWT
With a 21.2% exposure in the overall index, the fate of TSM is a major driver of the fate of EWT. Hence, TSM’s prospects are a key monitorable.
In its investor conference for Q3 2022, TSM’s management admitted that its near-term sales outlook has taken a beating. Signs of demand recovery from end-use markets such as iPhones from Apple (AAPL) are not yet present. And a US recession may exacerbate matters. These headwinds are likely to curb TSMC’s sales progress and correspondingly limit EWT’s gains.
Decline in the Global Semiconductor Market
On the global semiconductor scale, the outlook is also geared toward a decline. A Gartner forecast expects the revenue of the global semiconductor industry to contract significantly and fall by 3.6% from the $618 billion recorded in 2022 to $596 billion in 2023.
Semiconductor Industry Forecast (Gartner (November 2022))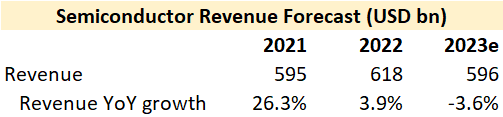
Commentary suggests a bleak outlook for 2023:
The short-term outlook for semiconductor revenue has worsened… Rapid deterioration in the global economy and weakening consumer demand will negatively impact the semiconductor market in 2023.
– Richard Gordon, the Vice President at Gartner
Note however, that much of this information on semiconductor weakness is well-known by the market and likely priced into the overall sentiment. However, the lack of bullish drivers and commentary does make me align more towards a neutral stance overall on semiconductors and on EWT.
Now I examine the technicals:
If this is your first time reading a Hunting Alpha article using technical analysis, you may want to read this post, which explains how and why I read the charts the way I do, utilizing the principles of Flow, Location, and Trap.
Read of Relative Money Flow
EWT vs. SPX500 Technical Analysis (TradingView, Author’s Analysis)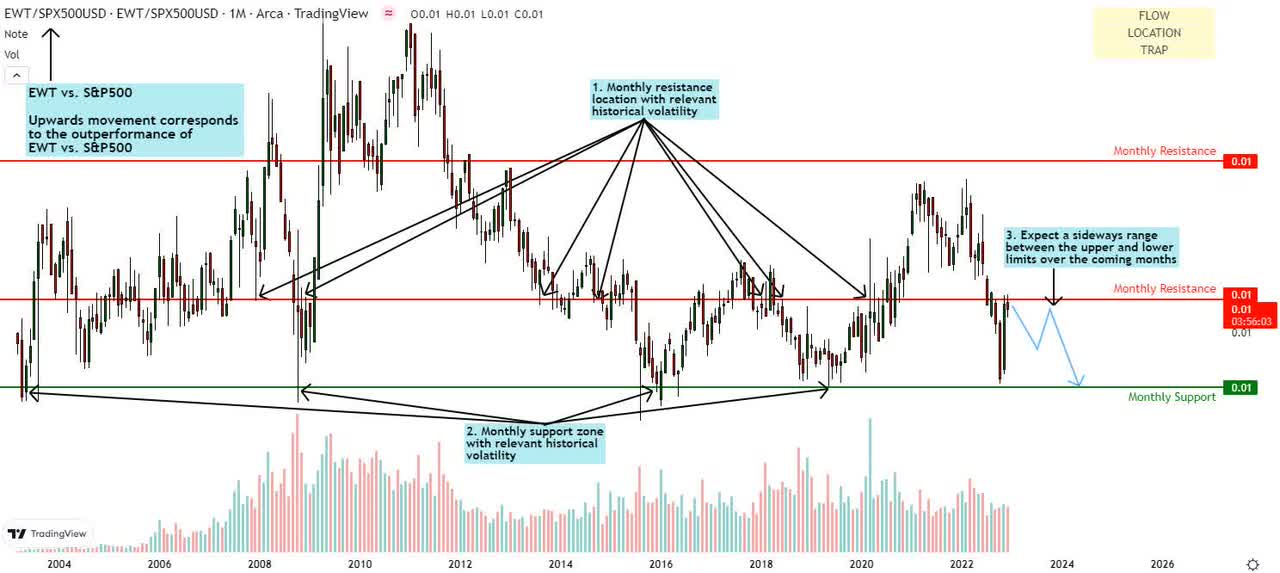
The EWT vs S&P500 pair appears to have hit a momentum “brick wall” after failing to scale the lower monthly support over the past two months. The instrument now faces a potential range-bound pattern over the coming months, especially as the semiconductor industry – to which the EWT ETF has notable exposure – is projected to ebb over the coming quarters.
I see a mild possibility of a sharp price increase above the monthly resistance level, forming a bull trap and creating a sell opening for a 15.5% move toward the monthly support. That said, my outlook on the EWT is a “hold,” though with a slightly bearish tilt.
Read of Absolute Money Flow
EWT Technical Analysis (TradingView, Author’s Analysis)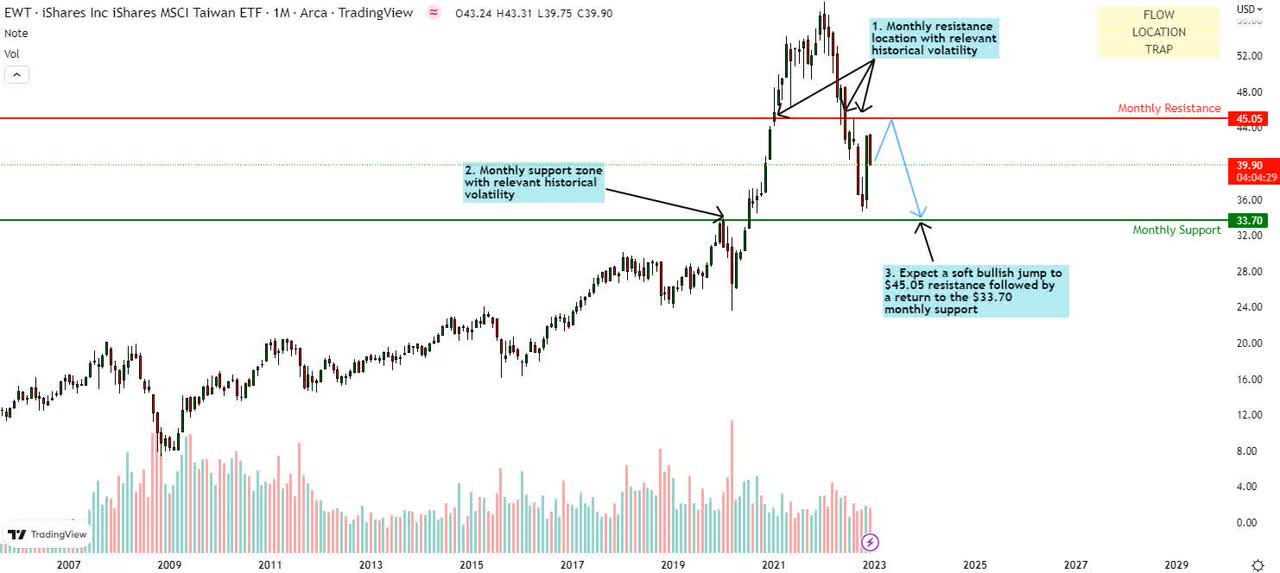
On the standalone chart, it’s a clearer picture. After peaking out at $58.00 in January 2022, the EWT has embarked on a massive descent before halting at the $34.68 low in October. Subsequently, the EWT posted a sharp spike, attempting to retest the $45.05 monthly resistance.
I think we will see an upward price continuation to the monthly resistance over the coming months. However, the price has yet to test the historically critical $33.70 support and so will likely mark a sharp drop after retesting the resistance level. While there’s a decent chance to ride the wave down, I’m not compelled to seek exposure yet as my trap criteria for entry have yet to be met.
Summary
Ultimately, if the forecasts and expectations for the semiconductor market are held in 2023, it will likely exert additional pressure against recovery for the EWT ETF. However, much of this is priced in the fundamentals and the technicals align with this view. Hence, in the absence of a clear trap and incremental trigger on the fundamentals, I continue to have EWT on my watchlist.
Editor’s Note: This article discusses one or more securities that do not trade on a major U.S. exchange. Please be aware of the risks associated with these stocks.
Be the first to comment