anyaberkut
Introduction
I always like to begin my articles with any recent coverage I’ve had on stock. Most of the time that means I get to write about my good results, but every now and then a stock like Lam Research Corporation (NASDAQ:LRCX) comes along and throws a wrench in the works. On June 19th, 2019, I published an article titled “Wait For A Margin Of Safety Before Buying Lam Research.” Here is some of what I had to say in that article:
During the most recent December [2018] correction, Lam’s price fell -46% off its high. That’s pretty far, and someone who bought at -45%, is doing really well right now. In between -25% off the high and -65% off the high there is a sliding scale of probabilities that the stock will hit a lower price. Corresponding to those lower prices are increased implied future returns an investor can expect to achieve. I bought a lot of stocks during the 2018 correction even though Lam didn’t end up being one of them, and the fact is, we haven’t experienced an actual recession yet. We haven’t even had an economic slowdown yet. So, I still have confidence that a stock that can fall -46% off its highs during a strong economic period when the wider market only fell -20%, can certainly fall -65% if we have a real recession.
As it turned out, Lam Research never fell -65% off its high and down to the level of my buy price. Here is how it performed since that article.
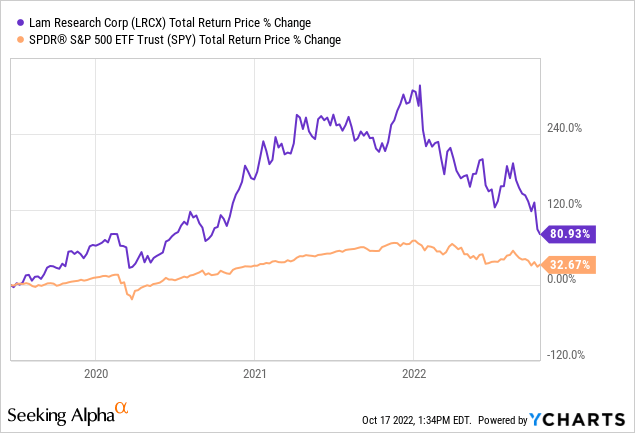
An investor who hung on or bought after that “Sell” article is still doing quite well with their investment, with an +80% return, which is more than double the return of the S&P 500. But, it’s worth pointing out that we also haven’t had a “real” recession, yet, either. All the government stimulus and unusual pandemic demand prevented almost all technology stocks from behaving as they typically behave during a “normal” recession. So, there is still a little time for my thesis to play out on that 2019 article, however, from a much higher peak price for the stock.
I’ve only written one article since that 2019 article. It was another warning article, this time soon after it looked like Lam Research stock had peaked, and the odds of a coming recession were high. It was titled “Beware Of Lam Research Stock’s Downside Potential,” and it was published earlier this year on March 24th. It basically had the same thesis as my 2019 article. This time, however, with the Federal Reserve tightening financial conditions aggressively, and the boom of government spending and the pandemic ending, the odds of a traditional recession had risen considerably. Since that article, Lam Research has performed almost exactly how I expected.
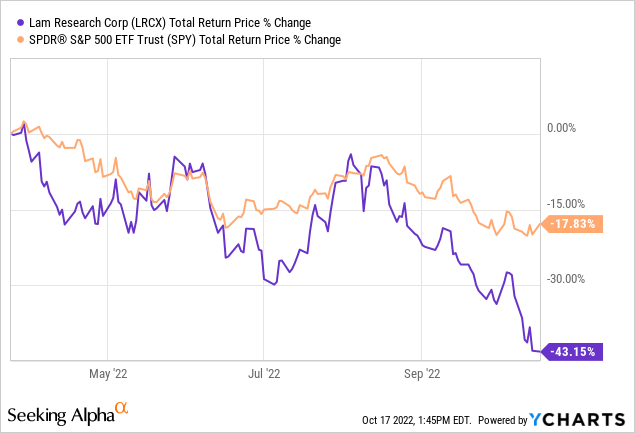
I hope at least a few investors heeded my warning back in March.
In this article, it’s time to reexamine Lam Research with our eye on when I might potentially buy the stock. First I will take Lam Research stock through my standard analysis, and I’ll also comment a bit on the coming recession, earnings, and government restrictions.
Lam’s Historical Earnings Cyclicality
One of the first things I check with any stock is how cyclical earnings have been historically. The reason I do this is because I want to know if this is a business that fits the profile of a stock I would consider investing in, and also I want to know which strategies and techniques are the most appropriate to analyze the stock in question.
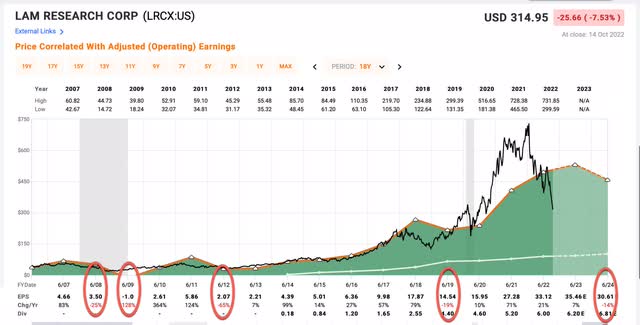
As we can see in the FAST Graph above, Lam’s EPS fell -25% in 2008 and then another -128% in 2009, a year in which Lam lost money. Not pictured on this graph are Lam’s earnings declines in 2002 and 2003, which combined were also greater than -100%, ultimately going negative as well. In 2012 we see a deep earnings decline, too. This time about -65% off the highs. And while earnings have grown tremendously since 2016, Lam still experienced an earnings decline in 2019, which was not even a recession year. This information should be fairly indisputable evidence that Lam’s business is deeply cyclical.
Because earnings can fluctuate greatly with cyclical businesses, traditional valuation metrics are not very useful at predicting medium-term price movements over the next, say, 3 to 5 years. In fact, traditional valuation metrics can often send precisely the wrong signal near the top of the cycle, especially when the cycle is just starting to turn down and the price is falling (which is why I published my last Lam warning article as the price started falling). For example, Lam traded at a P/E of around 12 (which is pretty cheap) during its 2007 peak, right before the stock price fell -65%. In early 2018 it traded at a P/E of 14.53 (which is still pretty cheap) before falling over -45% in a matter of months. P/E’s are not a predictor of value with cyclical businesses.
This is very important for investors to understand, because I’m sure many investors will look at Lam’s current P/E of 9.32 and see an attractive valuation. They should be warned that the P/E will rise a lot as the “E” falls over the next 12 months. And the market will not wait for the data before sending the stock price lower, as current holders of the stock have experienced this year.
Because earnings for deeply cyclical stocks are unreliable, instead I use historical price cyclicality to help guide me to a good potential spot to buy, and that is a technique I will share in this article.
The table below contains historical data of all of the price downturns deeper than -35% that Lam Research stock has experienced in the past 35 years. The table shows the approximate year the downturn started, how long the stock took to bottom, how long the entire downturn lasted before the stock fully recovered, and how deep the drawdown was from peak to trough.
| ~Year | ~Time Until Bottom | ~Duration | ~Depth |
| 1986 | 15 months* | 5 years | -78% |
| 1995 | 12 months* | 4 years | -88% |
| 2000 | 9 months* | 6.5 years | -84% |
| 2007 | 15 months | 7 years | -68% |
| 2018 | 10 months | 1.5 years | -46% |
| 2020 | 1 month | 0.5 years | -45% |
| 2022 | 10 months (so far) | ? | -56% (so far) |
* The bulk of these drops happened in this time period, but it took longer for the stock to fully bottom. Here is approximately how much the stock dropped in the time period listed: 1986 ~70%, 1995 ~71%, and 2000 ~75%.
And here is the table in chart form:
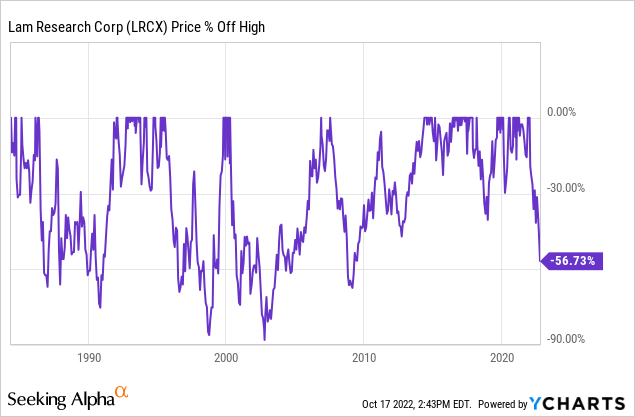
The most important thing for all types of investors to pay attention to here is the duration of the declines from peak to peak relative to the depth of the declines. Given the depths of the recession declines, these are pretty short cycles, which both means that they aren’t too difficult to hold through if a person chose to do so, but it also means they can be tremendous value opportunities for investors with a medium-term time frame (which is what I typically use). There is also a pretty decent pattern established where non-recessionary declines tend to fall about -45% off their highs, while recessionary declines fall -65% or more off their highs.
The stock has already fallen -56% off its highs this time around, which implies that the market thinks we are heading for a true recession of which we haven’t experienced since 2009. For what it’s worth, I agree with the market, and I’ve written a lot on that topic this year, beginning all the way back in January. So, for investors waiting on the sidelines as I have been to buy the stock at a good price for the past few years, I think we are going to want to aim for a relatively low price before buying.
When to buy LRCX stock?
Judging from LRCX’s past declines, the baseline for our drawdown expectation should probably be somewhere between -65% off its highs down to -80% off its highs. If a person wanted to start buying in small increments after a -65% decline and continue adding down to -80%, should it occur, that would be a reasonable strategy. For very cyclical stocks like LRCX, I would limit my ultimate initial portfolio weighting to no more than 2% of one’s portfolio.
Because I prefer to take small, 1% positions in semiconductor-related stocks and spread my bets around, I only plan to take one single 1% weighted position in LRCX. So I need to decide at what price that will be. (I’ve already purchased Micron Technology (MU) and Advanced Micro Devices (AMD) this downcycle, and plenty of other quality semiconductor stocks are getting close to my buy prices.)
Here are the factors I consider. On the side of aiming for a shallower buy price, even though LRCX is still a deep cyclical stock in which I expect EPS to fall more than -50%, its earnings probably aren’t as deeply cyclical as they have been historically during recessions and I don’t expect them to go completely negative this time around as they did in 2003 and 2009. However, fiscal 2024 EPS expectations are likely to continue falling from where they are today. At the time of my March article, analysts were expecting $40.35 for 2024 earnings, and now they are expecting only $30.61. That’s nearly a -25% cut to future earnings expectations already. This is why when Lam reports earnings this week, those earnings don’t really matter a whole lot. What matters is what the market thinks earnings will be next year. Those expectations are falling rapidly and will likely continue falling as long as the Federal Reserve is raising interest rates no matter what earnings look like this week.
(To put a finer point on this assertion, we just have to look at this year’s performance to date. Blended earnings have grown around 10% if we look forward to mid-2023 calendar year, while the stock price has fallen -55% this year. What happens with earnings absolutely does not matter during the near-term with this stock.)
Even though I recognize that Lam is still a deeply cyclical business, we also need to recognize that longer term we are likely still going to be in a secular bull market for semiconductors and related products, and Lam likely isn’t as cyclical as it was in 2009. Balancing this out, however, is that Lam’s stock was much more expensive going into the current downturn than it was in 2007. We can see this by looking at the peak P/E ratios in 2007 and 2022. The peak P/E was 12 in 2007, and 24 in 2022. On a peak earnings basis, Lam was twice as expensive at this cycle’s peak than it was going into the last recession in 2008/9. Lam started 2022 with much more of a year 2000’s valuation, and that would imply a potential -80% decline off the peak.
To complicate matters more, we also now have deglobalization issues arising, with the U.S. putting restrictions on what equipment and technology can be sold to China. However, on the other hand, consumers and businesses generally have healthier balance sheets going into the current decline than they did in 2007 and 2008.
When we put all of these cross currents together, it can be difficult to decide at what point to start buying the stock. The key difference for me compared to my last article when I was aiming for a buy price of $256.15 (or -65% off the highs), is the deglobalization issue, which is going to be front and center for the next year or two, along with the bust following the stimulus-fueled boom, which led to a very big upcycle for LRCX, and a more aggressive Fed than I would have imagined back in March. For those reasons, even though I expect Lam to fully recover over the next 5 years, I am lowering my buy price to $219.56, which is -70% off the stock’s recent high.
Volatility & Return Considerations
Other than using earnings to value deeply cyclical businesses, the second biggest mistake I see investors make with deep cyclical stocks is that they buy them too early and are not prepared for the magnitude of drawdowns that can still occur before the stock price eventually recovers. For example, let’s say an investor buys LRCX around here at -60% off its highs. When they are buying the stock, they correctly assess that Lam is a great business and they are getting it at an extremely cheap price compared to where it has traded the past couple of years. All that is true. Now let’s assume it falls more than -80% as it has on multiple occasions in the past during recessions. The investor who bought at -60% off the highs doesn’t just have to withstand a -20% drawdown in their position, they have to withstand a -50% drawdown. (Imagine a $100 stock falls to $40, you buy it -60% off the high, and then it falls -80% off the high to $20. It’s a -50% distance from $40 to $20.) Now also layer on absolutely horrible earnings that nobody expected along with your very quick -50% loss. Many investors, at this point, will second-guess themselves and consider selling. And that’s why these stocks are difficult to invest in.
So, when I eventually buy LRCX at -70% off its highs, should it fall that far, in my mind, I understand that it’s “normal” for this stock to fall another -50% on top of that, and that such a decline does not reflect the ultimate quality of the business itself, or the likelihood that the stock price will eventually recover. However, what I want is for the likely return of my investment to be worth the trouble of dealing with this level of volatility. So, what I like to focus on is the potential return if the stock returns to its previous highs again. And I want that return to be substantial.
If you buy a stock when it is -70% off its highs and it eventually returns to those highs, it produces about a +233% return. That looks like a pretty good return, but how long it takes to get that return is important. If it takes 5 years (which is usually what I aim for), then that produces a +27.20% CAGR, which is very respectable and worth accepting the volatility. If it takes 10 years, that produces a +12.78% CAGR. That’s still not too bad, especially when one considers that the odds of LRCX recovering its old highs during the next decade are probably pretty high.
The next thing worth considering is that LRCX’s valuation going into this decline was double what it was in 2007. If interest rates stay high for some time and are more like the interest rates in 2007, then we should at least consider that LRCX might only rise half as much as its peak price from the last cycle. This would be like taking a stock with a $100 peak price, buying it at $30, and only having it recover to $50 during the next cycle. I would expect this type of cycle to only take 5 years. This would produce a +67% in 5 years as my most conservative expectation. That would be a +10.80% CAGR which is slightly above the market’s average. So, even with a very conservative assumption, we still get decent returns buying after a -70% decline, as long as we have patience and can deal with volatility. Buying at higher prices makes this entire process more difficult.
On 10/17/2000, LRCX had done just this, and fallen -70% off its highs in just a few months. Over the next two years, investors would have had to suffer through a -57% decline
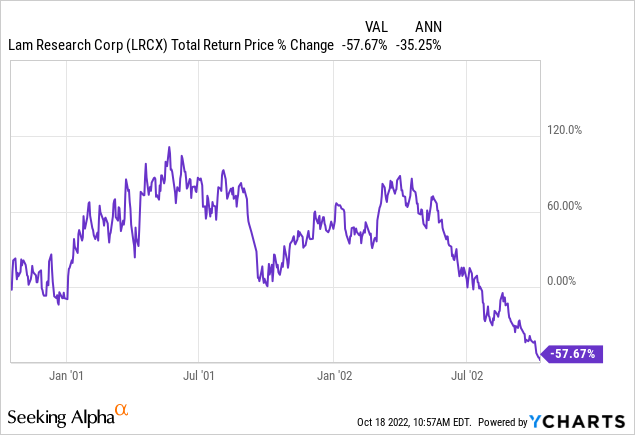
However, if they continued to hold on until LRCX recovered its old high again, here is how they had performed.
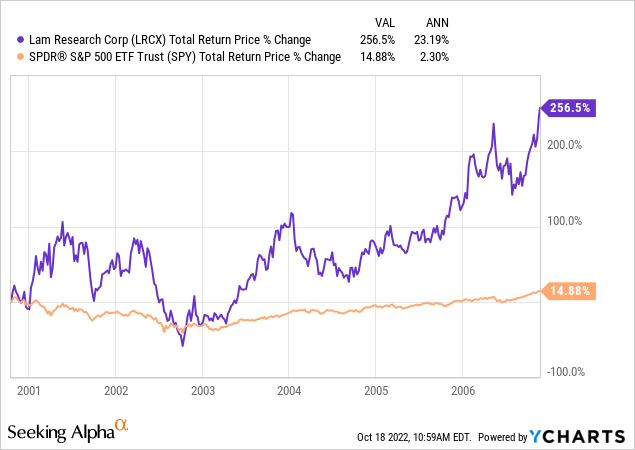
Investors would have had to wait about 6 years, would have had to hold through a -57% drawdown, but they would have achieve a 256% total return (23% annualized) compared to the S&P 500’s 14.88% return over the same time period (or 2.30% annualized).
This is really powerful information for investors to have. I often get criticized for my extremely low buy prices. But as we can see from the results above, I only need to make one purchase like LRCX -70% off its highs to get the equivalent portfolio returns of 10 SPY purchases. And, as I have pointed out before, with my recent AMD and MU purchases, these stock do regularly reach my buy prices. There is never a guarantee that they will, but history is a powerful guide to the future.
Conclusion
Deep cyclical stocks are very difficult investments to make. I specialize in them in my marketplace service, The Cyclical Investor’s Club, and they are still difficult. However, for the first time since 2009, we are likely heading into a period where there will be generational buying opportunities in deep cyclical stocks. Many of those opportunities will in semiconductors, but eventually there will also be opportunities industrials and housing as well.
But in order for investors to profit from these investments, they need to understand just how deep these stocks can fall, so they don’t pay too much. My experience has been that history is the best guide to help us do that. However, one has to give up the illusion that these types of stocks can be predicted with a great degree of precision. They can’t. Fortunately, because their price moves can be so dramatic, investors don’t need a lot of precision. They just need to be roughly correct, and not pay too much, and then be able to hold through the volatility and get to the other side a few years down the road.
My plan is to buy LRCX if it falls -70% off its high to $219.56. At that point, I will tuck it way and forget about it for a few years. If it doesn’t get that low, that’s okay, too. I have already started buying a few other semiconductor stocks and many more are close to buy prices. So, I will take the opportunities the market is willing to give.


Be the first to comment