

damedeeso
Investment Thesis
This article will look at Cornerstone Strategic Value Fund (NYSE:CLM). For many years CLM has not managed to cover its distribution. This has resulted in reductions in the distributions on a fairly regular basis. Cornerstone has managed to cover up this NAV erosion by reverse splits and rights offerings where shares were sold at a discount to market price but a premium to NAV.
After a nice bounce from the COVID recovery and an increase in the distribution, CLM has returned to being unable to support the distribution. This year despite a rights offering where new shares were priced at a higher-than-normal 12% premium to NAV that was fully subscribed, NAV declined for the year. As we saw at the beginning of November when management announced the new distribution, this erosion of NAV has produced yet another reduction in the distribution payment.
What I look for in a CEF is a stable flow of income. I have developed a method of determining whether a specific CEF could provide a reliable stream of income. I developed my method after reading this article. My thinking is that rather than the share price, how the portfolio of the fund behaves and the income it generates is the determining factor in the reliability of the distribution. I think it is a mistake to see the fund’s NAV as the sole component of the fund’s value, but rather I think it is more productive to look at a fund’s NAV as the muscle that it uses to generate cash. So while it can be bad if the fund is eroding NAV (look at it as muscle atrophy), it is the fund’s ability to generate cash that is the actual value.
In this article, I look at CLM and apply that method to determine if the fund has been supporting the distribution. Then based on current holdings and past performance, I try to determine whether or not the fund will be able to support the distribution in the future. You can read an explanation of my method and get links to the other articles in the series (published before March 27, 2022) here.
Cornerstone Strategic Value Fund
My practice is to look at how well a CEF manages its portfolio. I want to see that the fund can reliably generate enough cash (and even better generate more than enough cash) from its portfolio to pay the distribution. What I don’t want to see is a fund that is eroding its asset base to pay a distribution that is too generous. In the past, CLM has paid out too high of a distribution and this has resulted in both the erosion of its NAV and a decline in the distribution it pays out. So the question is, is that still the case?
Let’s take a look at the total return on NAV for the last year. This is a good metric to judge the performance of the fund’s portfolio. And that performance will determine how much the fund can afford to pay out in distributions to its shareholders.
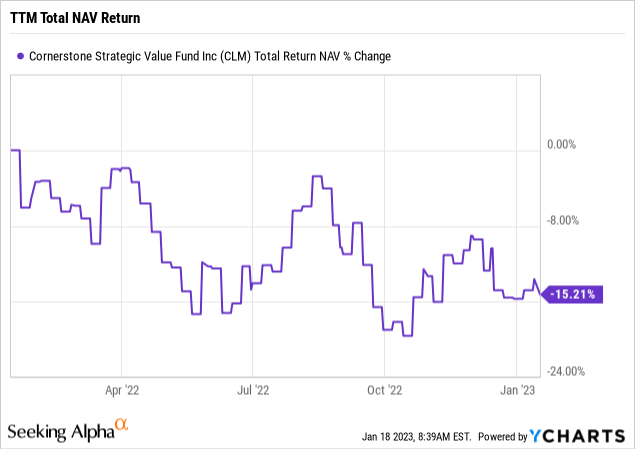
As we can see, the total NAV return over the last 12 months (that is what TTM stands for, Trailing Twelve Months) is just over -15%. Given that the distribution policy is to pay out a year distribution of 21% of the NAV on October 31 of the prior year, this means that the fund had some significant erosion of the NAV.
Let’s take a look at how the NAV did during the last year.
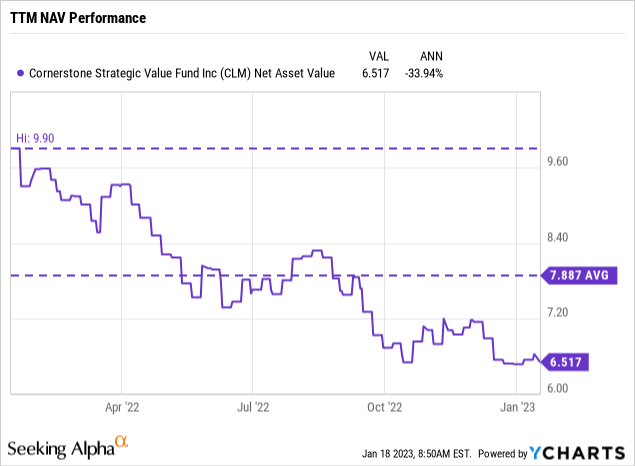
NAV declined fairly steadily over the last year, for a total loss of nearly 34%. Also note that during this last year, the fund did a rights offering where they increased the share count by roughly 2/3rds and collected a 12% premium to NAV for those new shares. That strongly suggests that the fund was unable to fully cover its distribution.
Let’s take a look at the most recent 12 distribution payments. I use CEFData as my source for this data.
TTM CLM Distributions (CEFData)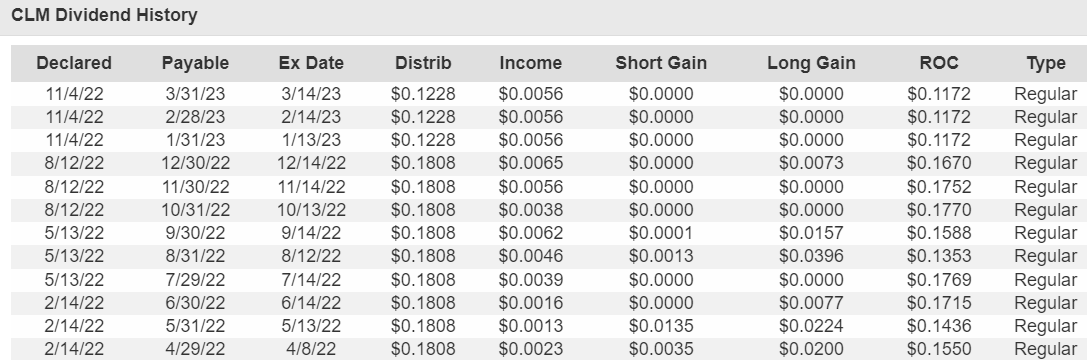
CLM has a managed distribution policy where it sets the next year’s distributions to be equal to 21% of the fund’s NAV on October 31 of the prior year. So for example, the distributions to be paid out in 2023 will be 21% of the NAV on October 31, 2022. Given the data on NAV with its decline over the last 12 months, it is no surprise that the distribution was reduced for 2023.
This provides further evidence that the distribution wasn’t fully covered. But let’s see how CLM did against SPY over the last year.
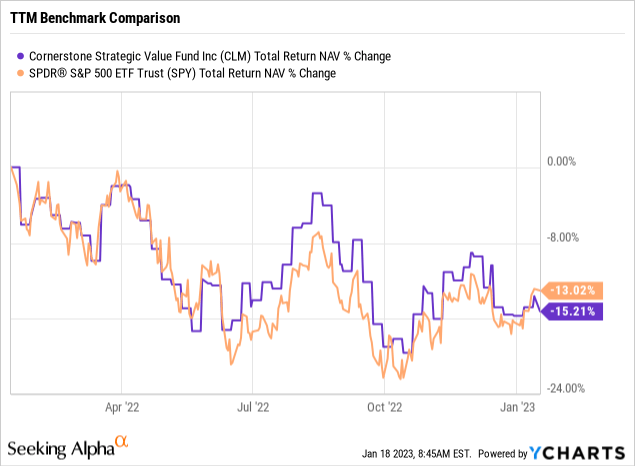
As we can see, both SPY and CLM had negative total NAV returns (for SPY total return and total NAV return are the same because ETFs trade very close to their NAV which is not the case for CEFs). But SPY did better than CLM, even though CLM did a large rights offering selling shares at a 12% premium to NAV.
I think it fair to say that CLM is struggling to cover its distribution and that the size of that distribution is likely a major reason for the struggle.
Long-Term Trends
Because funds can have really good years, and really bad years, a single year might not be representative of a fund’s long-term performance. Everything hits a rough patch now and again, for me, it’s the long-term performance that matters. And in fact, a short period of underperformance can provide a nice entry point.
So my next item to examine is how the fund managed its portfolio over a 3-year period. I think this length of time provides a good tradeoff to show longer-term performance while still showing pretty recent data.
So how did CLM manage its portfolio over the last 3 years?
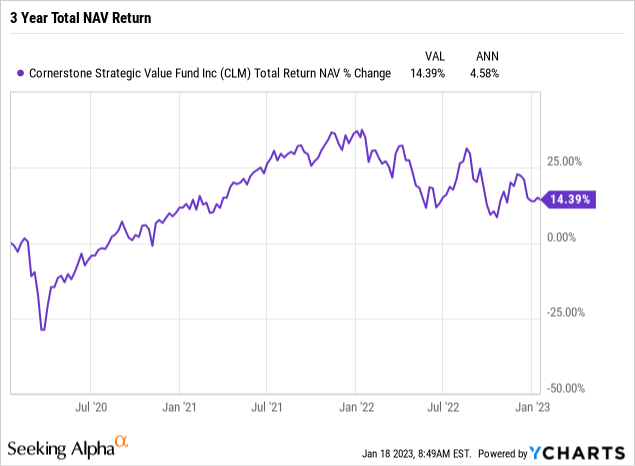
A first glance a total NAV return of approximately 14.4% appears quite good. But remember that CLM pays out roughly 21% of NAV each year. That is below even the total return on NAV for the whole 3 years, and significantly more than the 4.6% CAGR of total NAV return.
While I am fairly sure of what we will see when we look at NAV, the exact amount of decline will tell us how badly CLM has been overpaying.
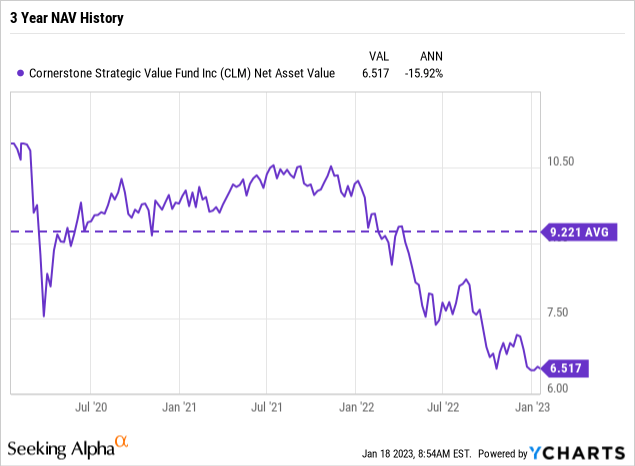
The CAGR for NAV has been -15.9%, which is pretty dramatic. But if you look at the chart you can see that most of that decline actually happened in the last year. And this happened despite the big rights offering that boosted NAV.
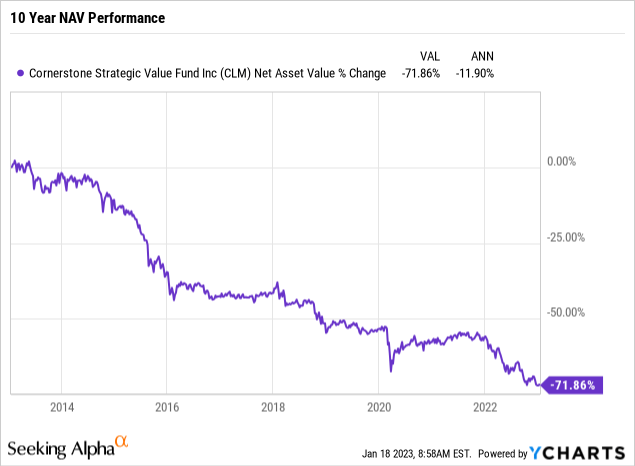
As I said, the long term is most important to me, so let’s look at how the NAV has done over the last 10 years. And that has been a history of decline, rather dramatic decline. Almost 12% a year decline.
Distributions, generous ones, are why I buy investments. So let’s look at what the distributions from CLM have been since 2008. The pattern I like to see is a set of stairs going up over time. CLM however has a set of stairs that mostly go down over time. In only 2 years did the distribution payment increased, and in each case, the payment for the year following the increase was less than in the year prior to the increase.
CLM Distributions Since 2008 (CEFData)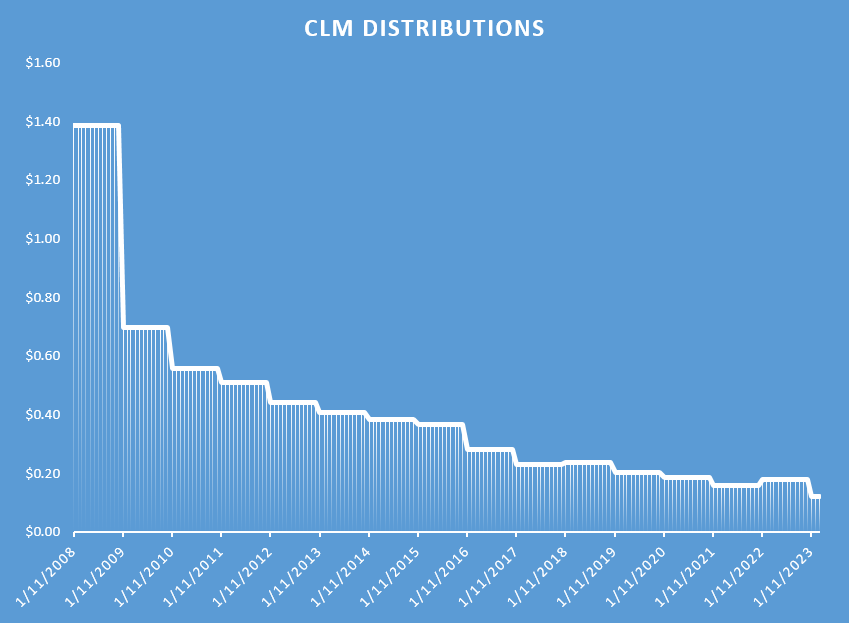
Based on all the evidence I don’t think CLM is covering its distribution. Given that it pays out 21% of NAV and uses no leverage, that should be a surprise. The surprise, for me anyway, is how close it comes to actually doing so. Even more surprising is that occasionally it does manage to cover the distribution.
Future Distribution Coverage
While CLM hasn’t been covering its distribution, the more important consideration is whether or not it will be able to do so in the future. Understanding how CLM performed in the past is the first step to understanding how it might perform in the future. While past performance is not a guarantee of future performance, the how and why of that performance is our best guide to the future. Over the past 10 years, CLM’s portfolio has generated returns that have averaged 11.9%. While that is impressive, it falls far short of covering its distribution which is set to be 21% of the NAV reported on October 31.
Making good picks is one way for CLM to generate the cash needed to pay out its distributions, so let’s look at what it owns.
Holdings (CEFData)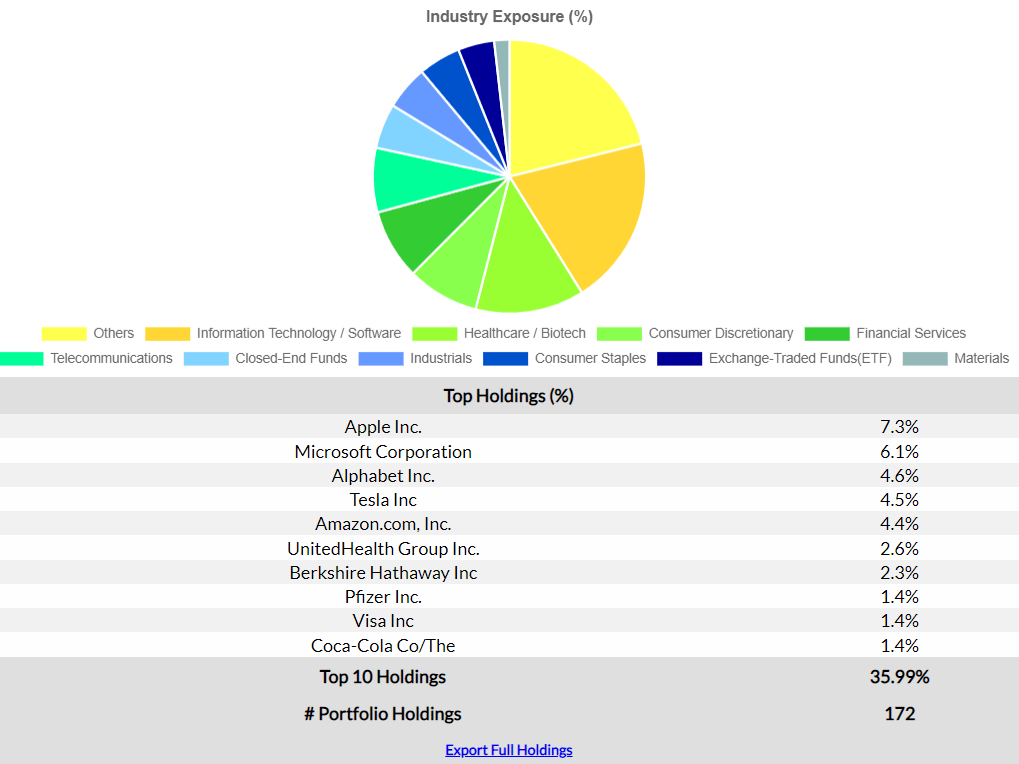
Holding FAANG stocks and Tesla it isn’t a surprise that the NAV is down as they all took big hits in 2022. All of the Top 10 holdings look like solid companies and while some may have taken big hits in 2022, they could very well recover in 2023. But CLM has held them for a long time, and hasn’t managed to cover the distribution consistently. I don’t see anything here that will change that.
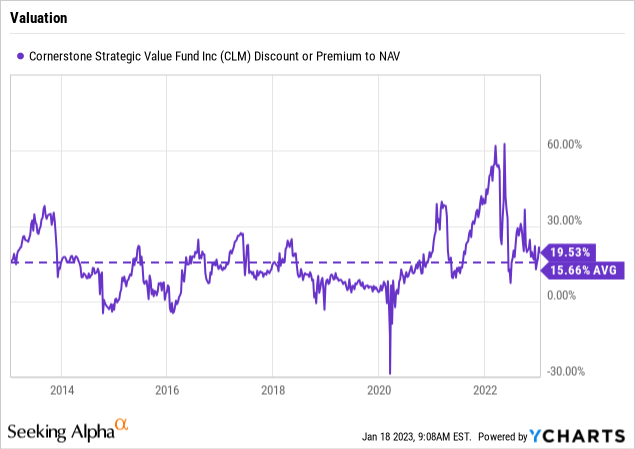
I also like to check if the price is good. For that, I compare the current premium to NAV to the 10-year average. And currently, the premium is a bit high compared to that average.
Impact of Rights Offerings
Another way for a CEF to get cash to pay its distributions is to do various secondary offerings. CLM tends to do rights offerings, where it allows current shareholders to buy more shares at a price that is at a significant discount to the market price but at a premium to the NAV. Last year they did one, and increased the share count by around 2/3rds. In fact, the fund received requests for $783 million of its shares. While in the past the fund had priced shares for the offering at a 7% premium to NAV, in 2022 that premium was 12%.
The subscription price for each newly issued share was determined to be $8.27, which is above the current market price of $7.79.
How to Make Money with CLM Anyway
While I don’t like CLM because it doesn’t fully cover its distribution, there are still ways one can make money with the fund.
These ways to make money all revolve around the fact that Cornerstone offers two ways to buy shares of CLM at less than market value. The first, which we already covered, is the rights offering. You can use this to grow your share count at a price that is well below the current market value. You can either pony up more cash, or you can sell some of your shares at market price and use that cash to buy shares in the rights offering to replace the sold shares.
The other program that Cornerstone offers shareholders to buy shares below market price is its DRIP. That allows you to buy shares at the NAV price. Right now that is almost 20% below market price. Even if you need the cash, you should participate in the DRIP and then just sell enough shares to match the cash amount of the distribution.
Conclusion
Even with the new reduced distribution, I still think CLM has weak coverage. With the premium to NAV below 20%, and the uncertainties in the market, there might not be a rights offering this year. I think that without a rights offering, we will see a distribution cut next year.
Be the first to comment