

DjelicS/E+ via Getty Images
U.S. (Investing) Rules the World
In case you’ve missed that, underperformance of non-U.S. stocks is now approaching the 15 years mark.
Not only this is the longest outperformance (by any of the two baskets – U.S., non-U.S.) but it’s also the second largest magnitude in at least 50 years.
JPM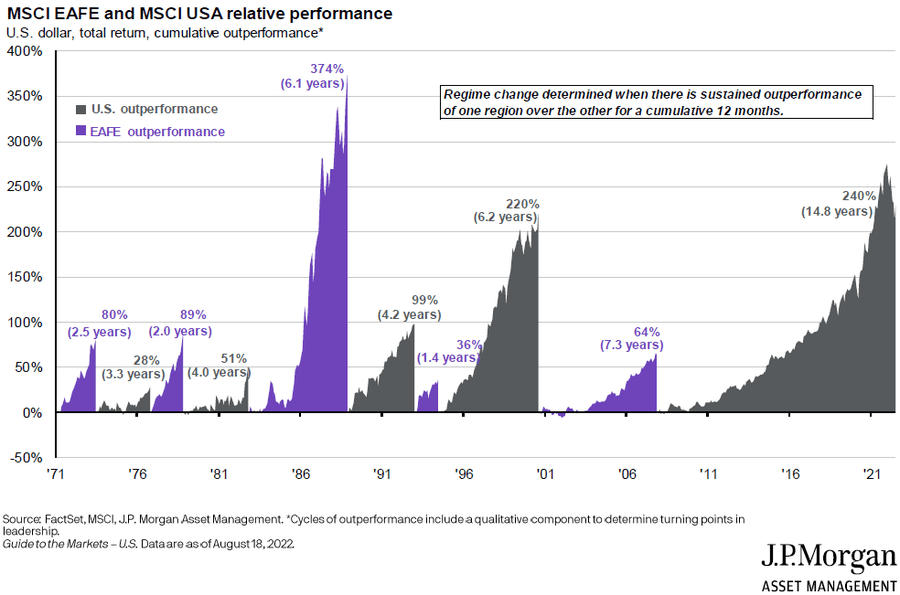
Looking at Europe, valuations are even more dire.
Valuation of European stocks (using the Stoxx 600 index) versus U.S. stocks (using the S&P 500) has dropped to yet another multi-year low.
The multiple of the European index is about 1/3 lower than that of the American index, allegedly making the former (compared to the latter) most attractive it has been since 2005.
Bloomberg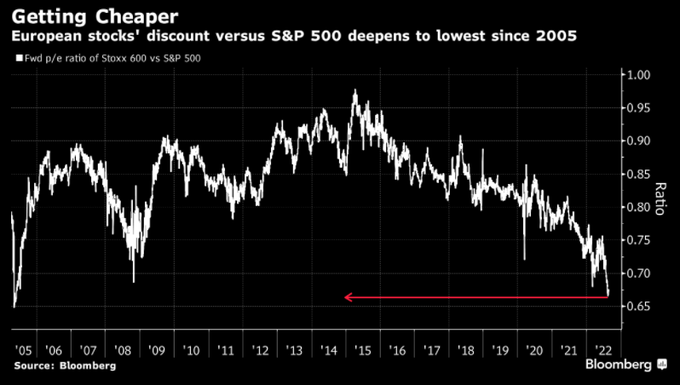
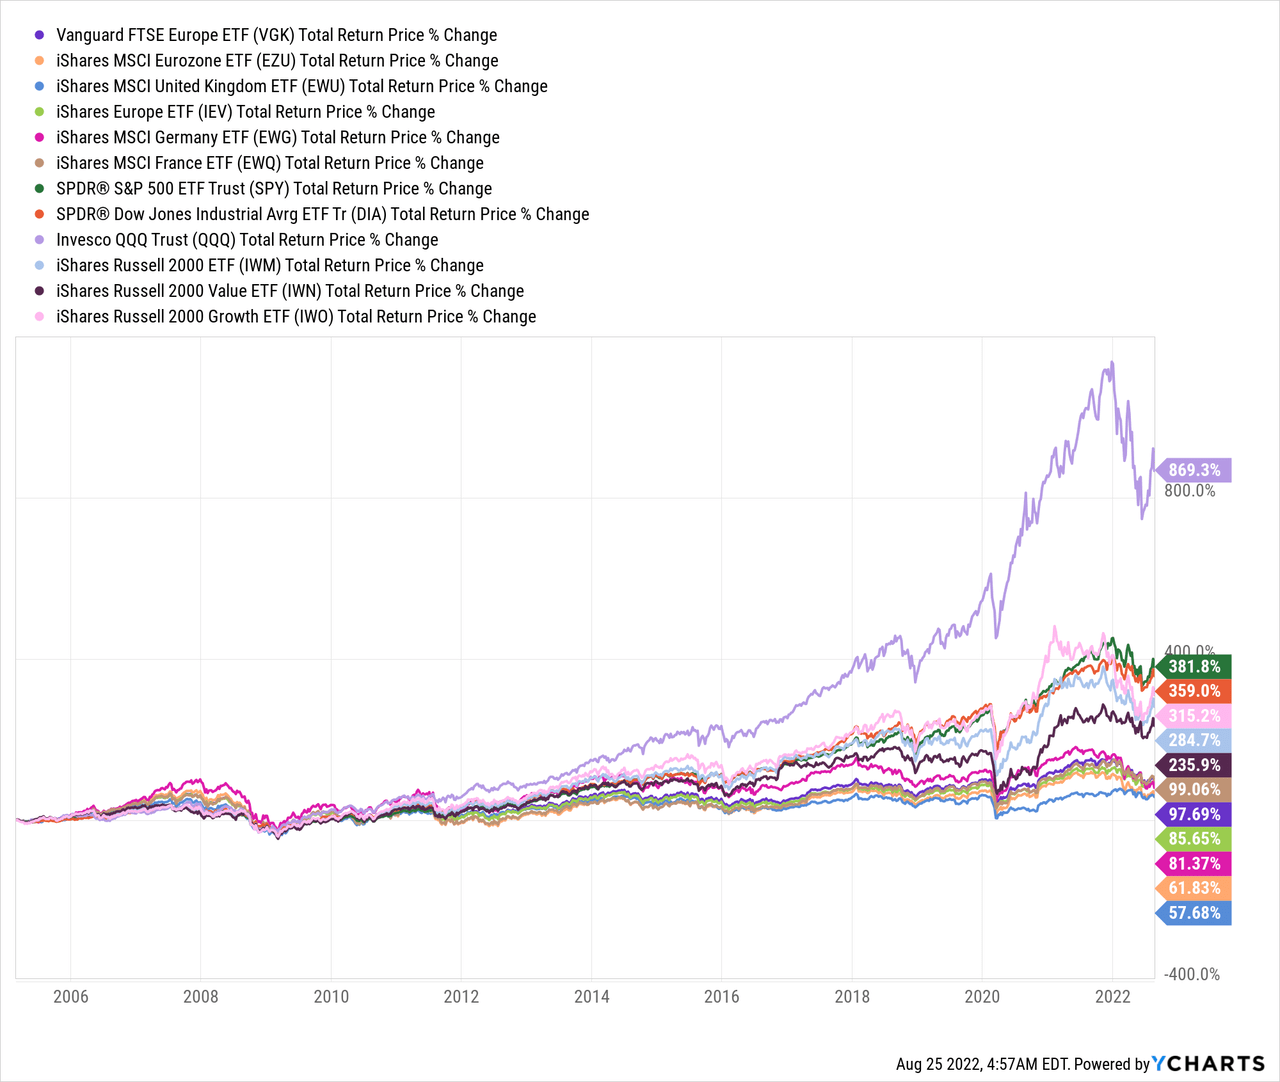
Europe is Lagging Across the Board
If we look back at total returns of European vs American exchange-traded funds (“ETFs”) since the last time the (valuation) ratio was trading that low as it’s now, the differences are nothing short of stunning:
U.S. ETFs:
- Invesco QQQ Trust (QQQ): +869%
- SPDR® S&P 500 ETF Trust (SPY): +382%
- SPDR® Dow Jones Industrial Avrg ETF Tr (DIA): +359%
- iShares Russell 2000 Growth ETF (IWO): +315%
- iShares Russell 2000 ETF (IWM): +285%
- iShares Russell 2000 Value ETF (IWN): +236%
EU ETFs:
- iShares MSCI France ETF (EWQ): +99%
- Vanguard FTSE Europe ETF (VGK): +98%
- iShares Europe ETF (IEV): +86%
- iShares MSCI Germany ETF (EWG): +81%
- iShares MSCI Eurozone ETF (EZU): +62%
- iShares MSCI United Kingdom ETF (EWU): +58%
This might be seen as an opportunity to buy European stocks that are trading way cheaper than US stocks.
We say: Hold your (European) horses!
This isn’t the time to shift money into Europe as of yet – and in this article we explain why.
The EU is currently the epicenter of an energy, economical, and political crisis. Anything that can go wrong – is, and everything does. All at once.
Bloomberg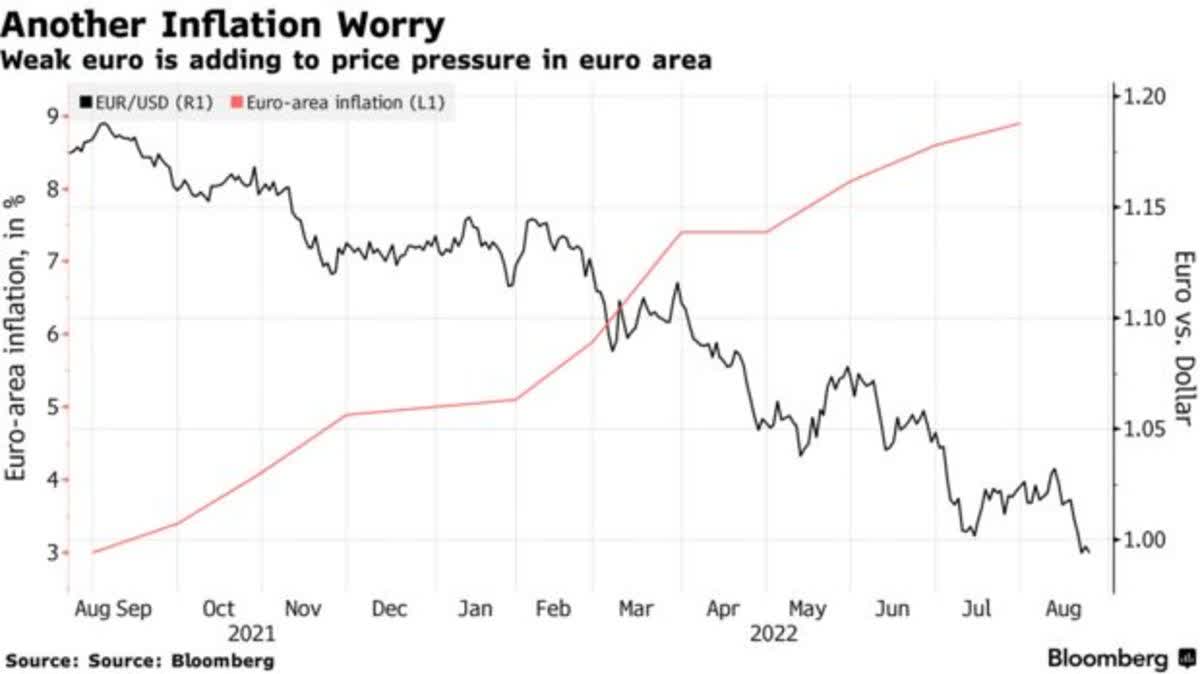
Energy Crisis
In case you’ve missed it, there’s no “energy market” in Europe anymore.
As a UK resident myself I can tell you that there’s zero competition right now. Until a year ago, I switched to a new energy supplier every year based on the cheaper offer I received out of many suppliers. This year, I received none. Zero. Nada.
My supplier (Shell) raised the tariffs by about 3x (up to the maximum allowed by the regulator right now), and there’s only one plan you can choose from (versus dozens of plans in the past).
If you don’t like it – you can sit in the dark, but there’s literally zero competition and zero flexibility.
Take it or leave it.
ENTSOe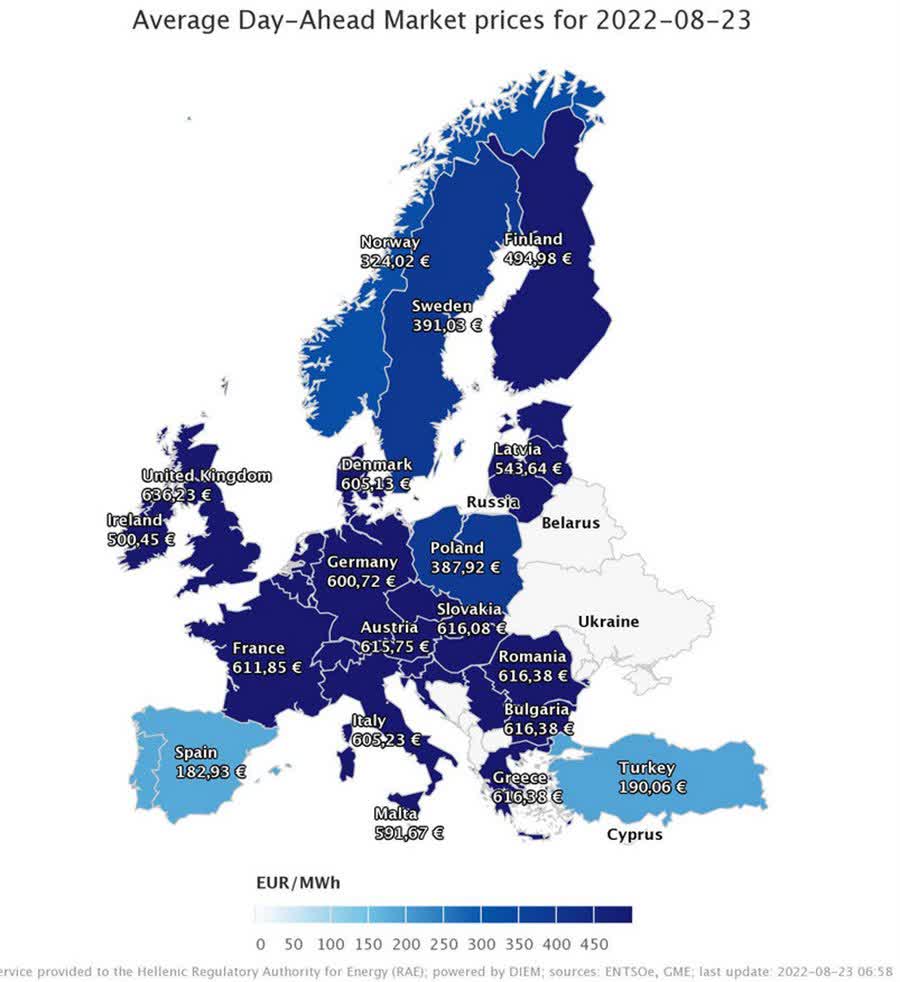
Now, the issue is way bigger than my energy bill, so let me explain this in a broader context:
Q: How many megawatt hours are in 1 barrel of oil equivalent (“boe”)?
A: 1 boe = 1.70 MWh
Based on this ratio, wholesale electricity prices in most European countries are now greater than $1000/boe!
Here’s Germany, the leading European economy:
Bloomberg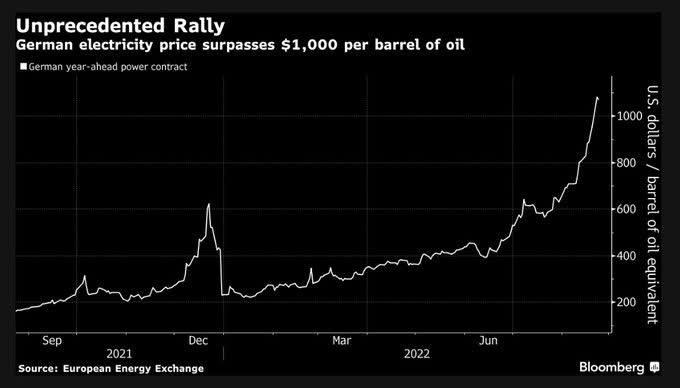
Economical Crisis
The global economy is slowing, but that of the EU is slowing faster than everybody else, “thanks” to the effects of the Russia-Ukraine war.
The EZ economy is now back to contracting territory.
While the Services PMI is still pointing to a small expansion (last reading: 50.2), the Manufacturing PMI is already signaling contraction (last reading: 49.7).
Bloomberg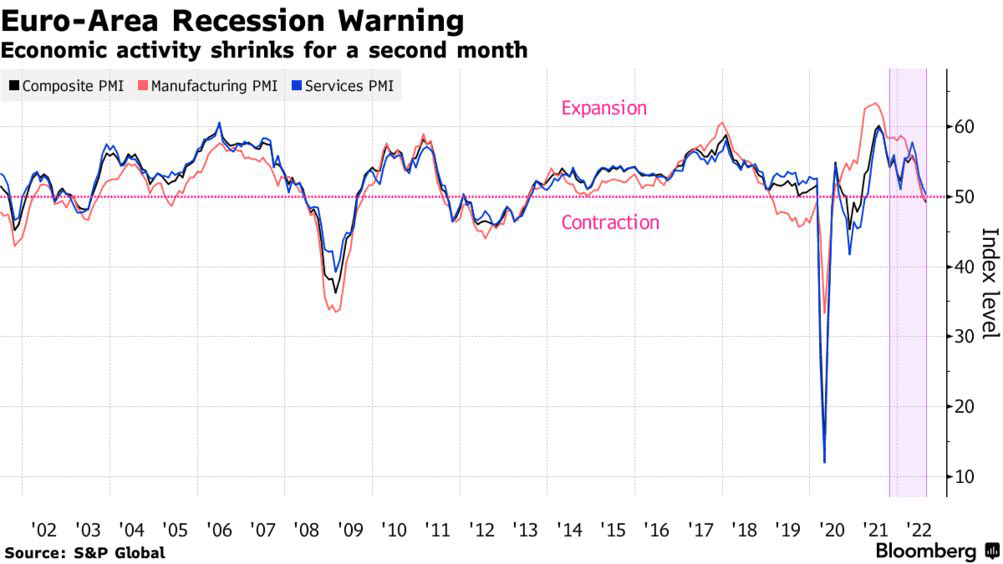
It’s important to note that in Germany, both (Services and Manufacturing) PMIs are already in contracting levels, and it’s likely that only reason for France and/or UK Services reading remaining in expansion levels is the summer season and the holiday/tourism spending that keep the figures afloat.
Bloomberg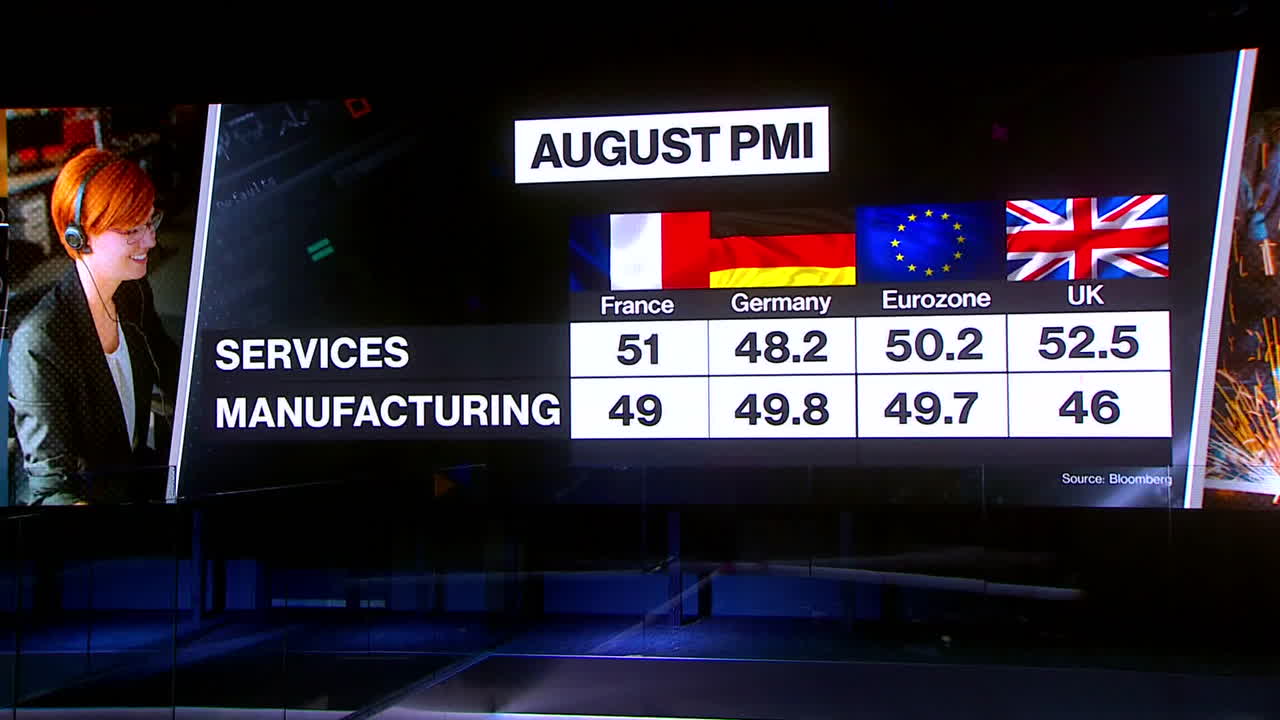
Shortly, once the high travel season is over and kids are back in school, we expect things to deteriorate further.
And once winter starts, with the high demand for heating, the recession in Europe is likely going to be even deeper than it seems now.
Political Crisis
With no end in sight for the Russia-Ukraine war, Europe continues to be in turmoil.
In the UK, a new prime minister (Rishi Sunak or Liz Truss) is going to be announced soon.
In Germany, Olaf Scholz’s popularity has slumped to a record low.
In France, Macron warns of an “end of abundance” with France heading into a difficult winter.
On one hand, don’t pay too much attention to the apocalyptic headlines; nobody is going to freeze due to shortage of energy.
As you can see, natural gas flows into Germany are at record high.
Andreas Steno, Macrobond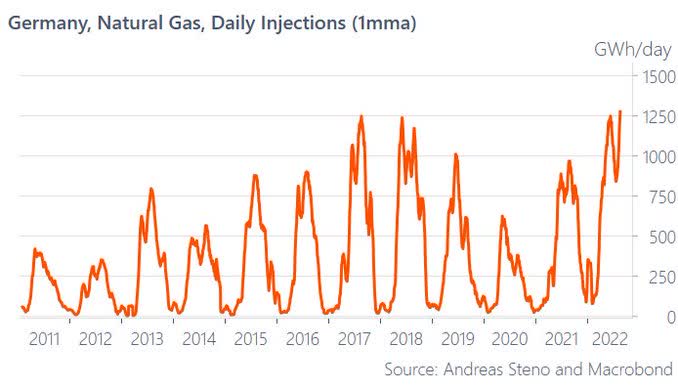
On the other hand, the buying power of the average European resident keeps deteriorating and the economy is going to suffer more, much more.
With such a setup, it’s anything but surprising that the EUR is losing value, trading below parity against the USD.
There is nothing surprising about this actually; the U.S. dollar has always acted as a safe haven during difficult times, and when things in Europe are moving from bad to worse – it’s only natural for FX investors/traders to stick to the much stronger side/currency.
Bloomberg
The Flipped-Side of the Coin
Saudi Arabia’s oil exports reached a record-high of $31B in June, driven by higher production and higher prices.
Monthly crude exports topped more than $1B/day and jumped 94% Y/Y.
Bloomberg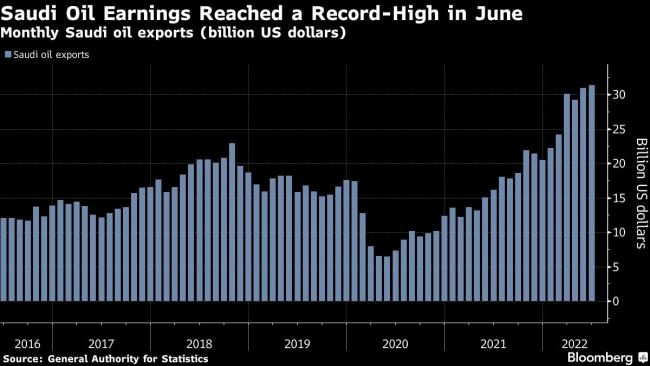
The Kingdom’s trade surplus rose to $23B in June, representing an Y/Y increase of 75%.
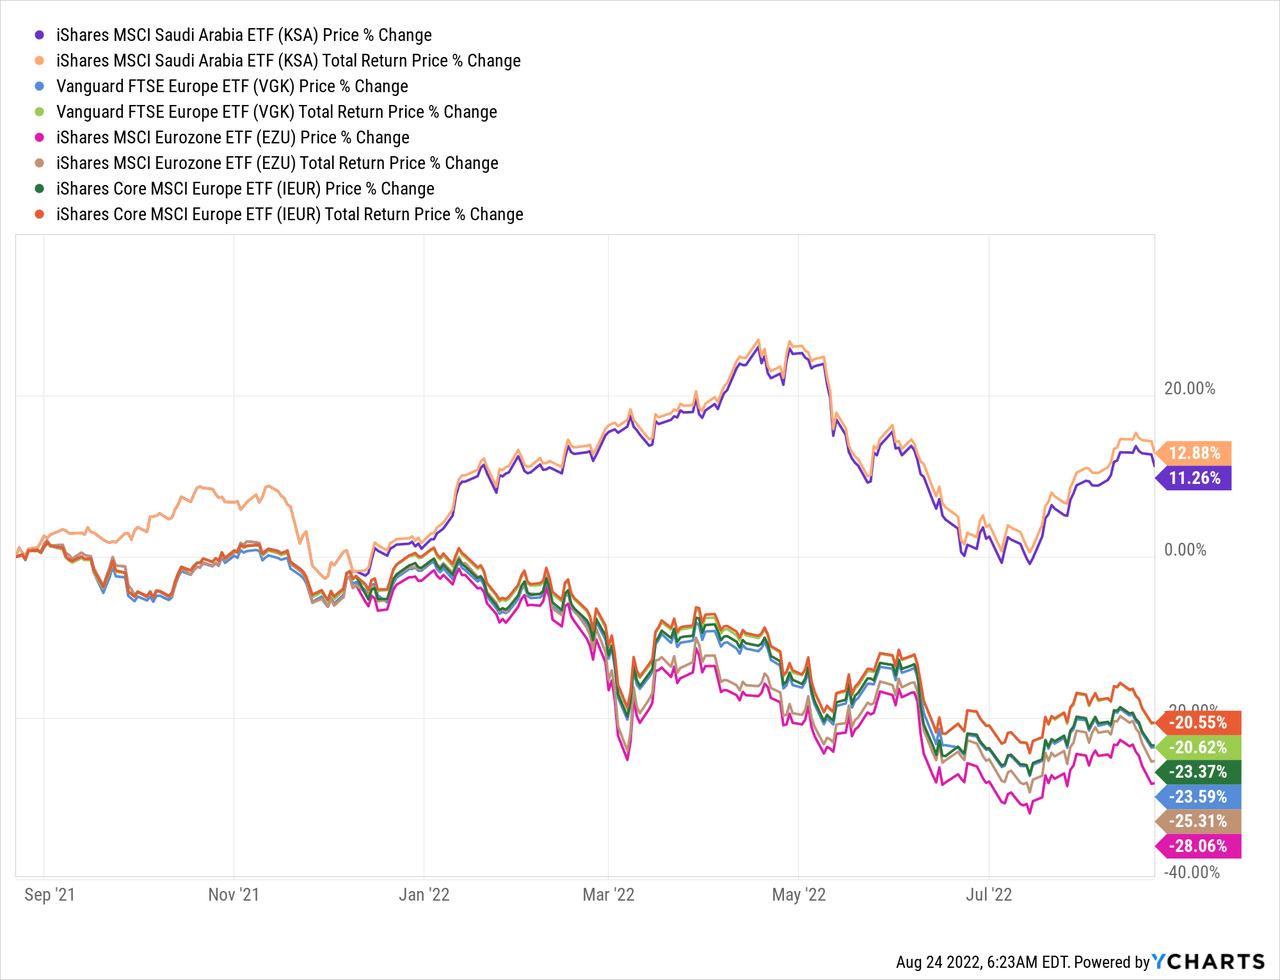
With that in mind, it’s no wonder this is how relevant-leading ETFs, representing the two sides of the energy coin, have traded over the past year:
The Duck/Suck Test
If it looks like a duck, swims like a duck, and quacks like a duck, then it probably is a duck.
When it comes to (investing in) Europe, all you need to do is use an “s” instead of the “d” in the word “duck.”
Our best advice to you is to try making lemonade out of the lemon – invest in non-European companies that are coming out stronger as a result of the European crisis.
For example: non-EU fertilizer/chemical companies.
While in Europe, factories are being shut-down due to the too high gas prices they need to pay (which is crucial for their activity), U.S. fertilizer stocks are benefiting from the decreasing competition.
ICIS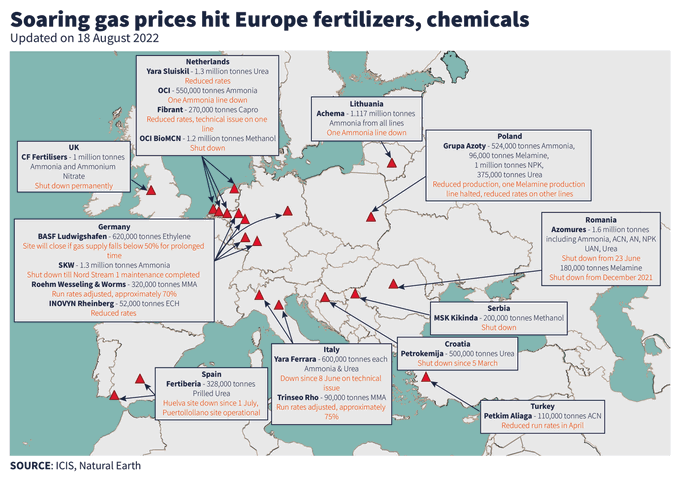
The last victim (in a long, and growing, list) is Azoty, Poland’s largest chemical corporation and the EU’s second largest producer of mineral fertilizers, that has stopped production of nitrogen fertilizers and cut output of ammonia as a result of record gas prices.
Meanwhile, non-EU fertilizer/chemical stocks are doing great, posting very nice gains over the past year (and beyond).
Y-Charts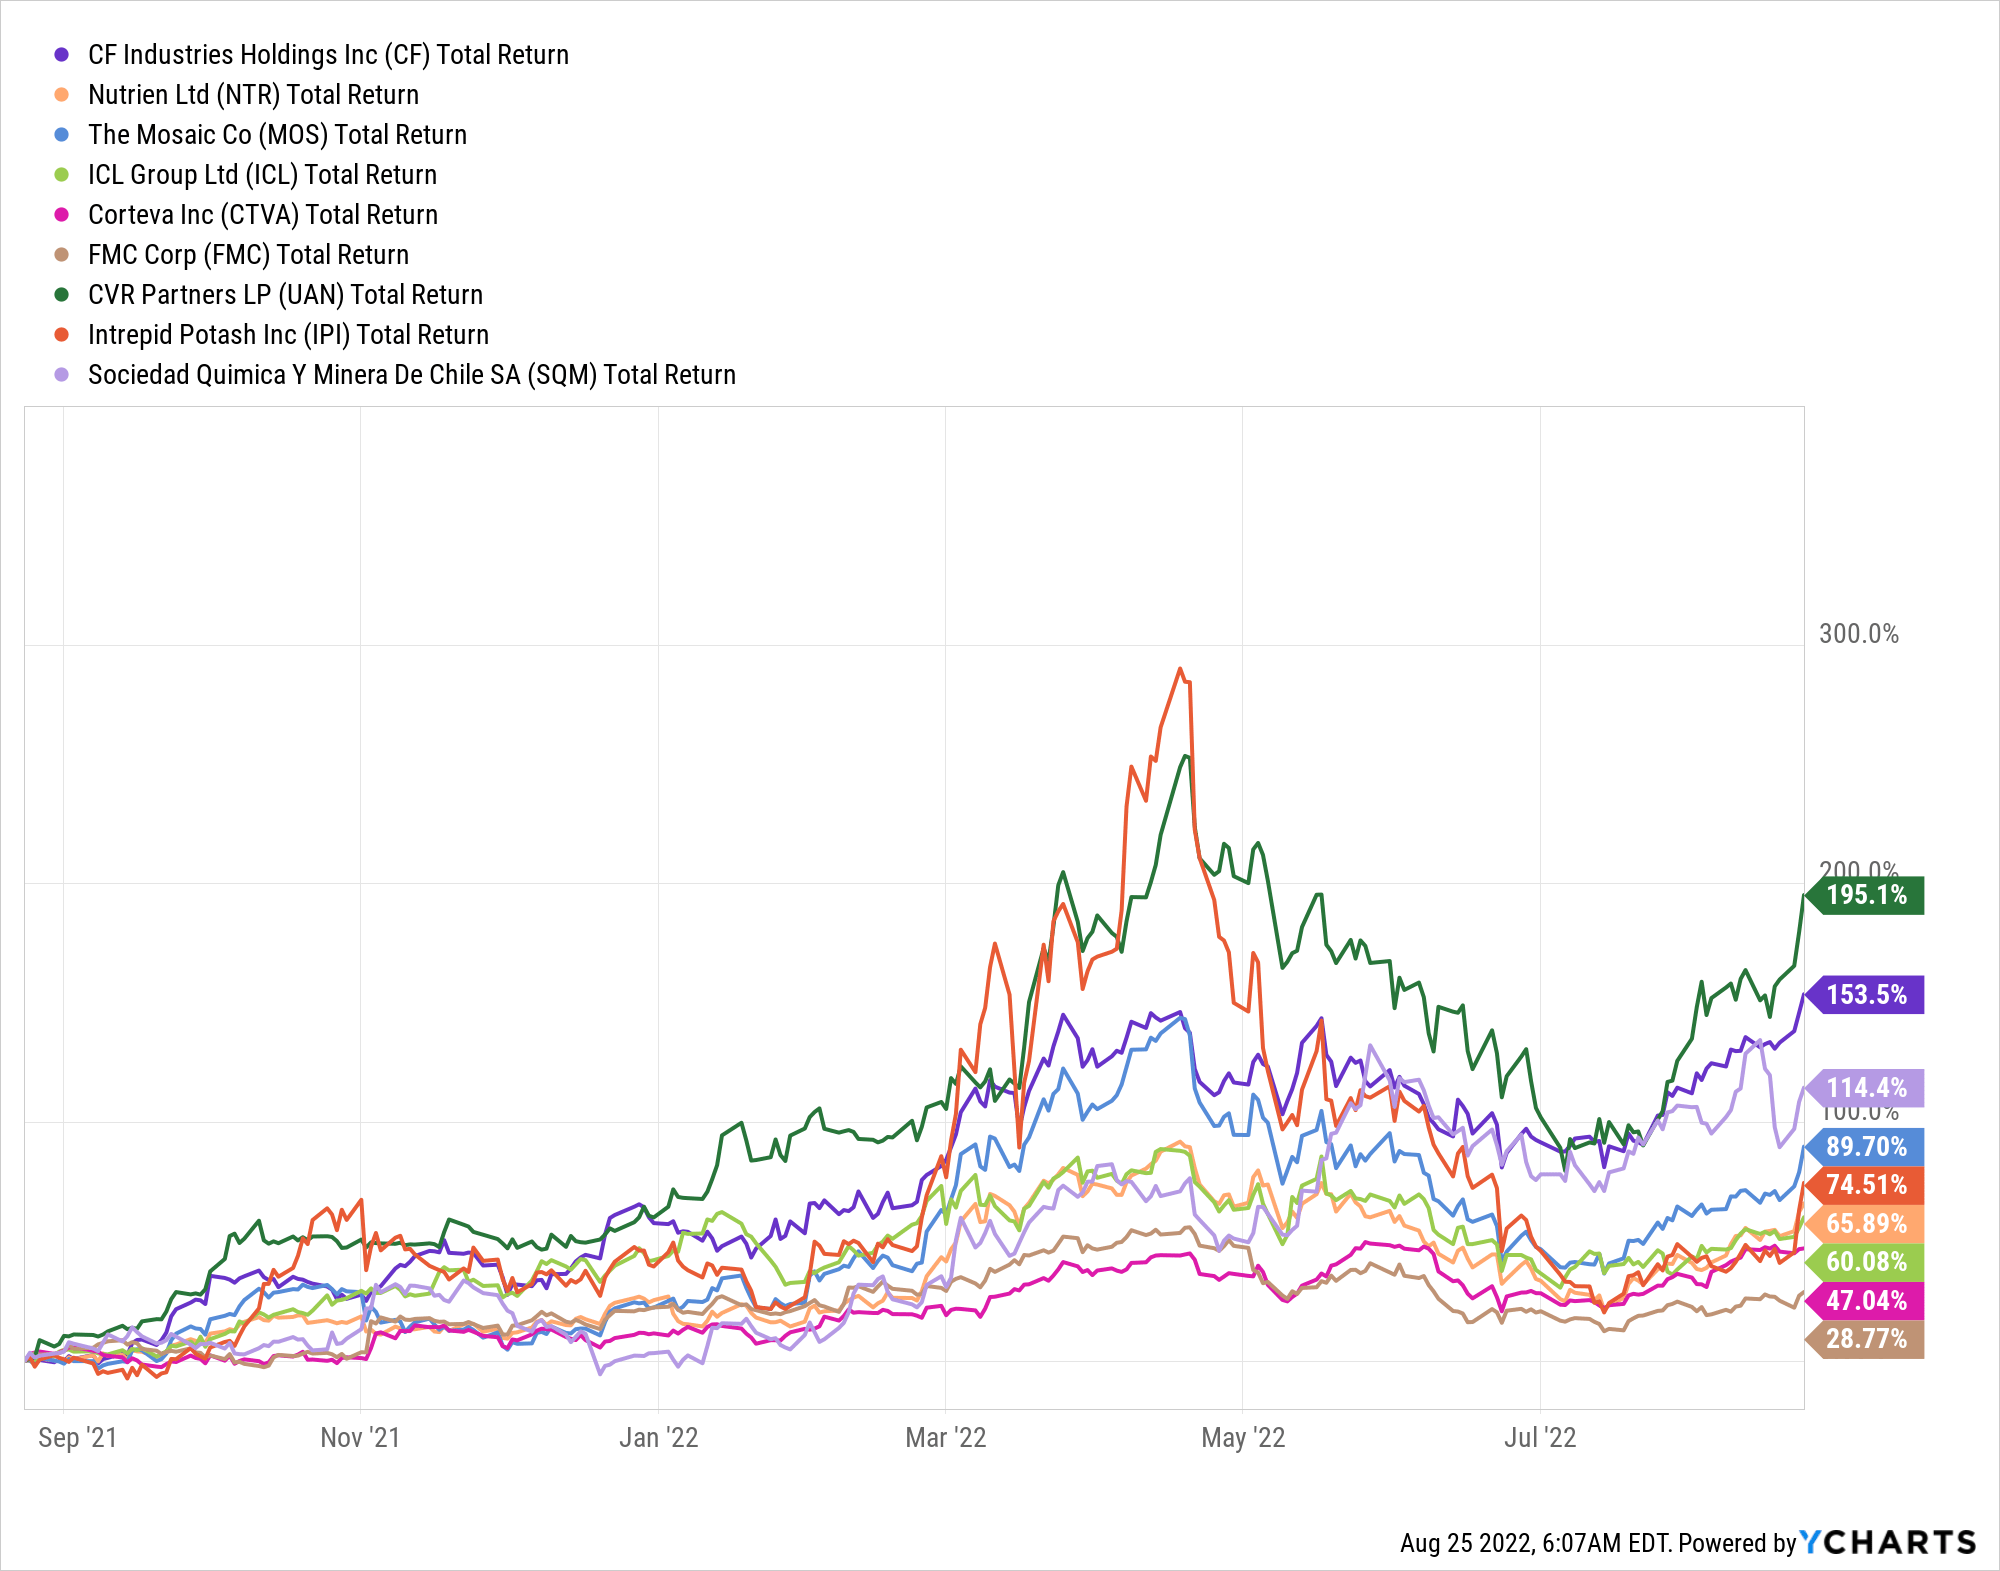
Following a serious pullback between mid-April to mid-July this year, prices of fertilizer/chemical stocks have lost a lot of ground, however over the past 40 days the uptrend has resumed, with very strong performance across the board.
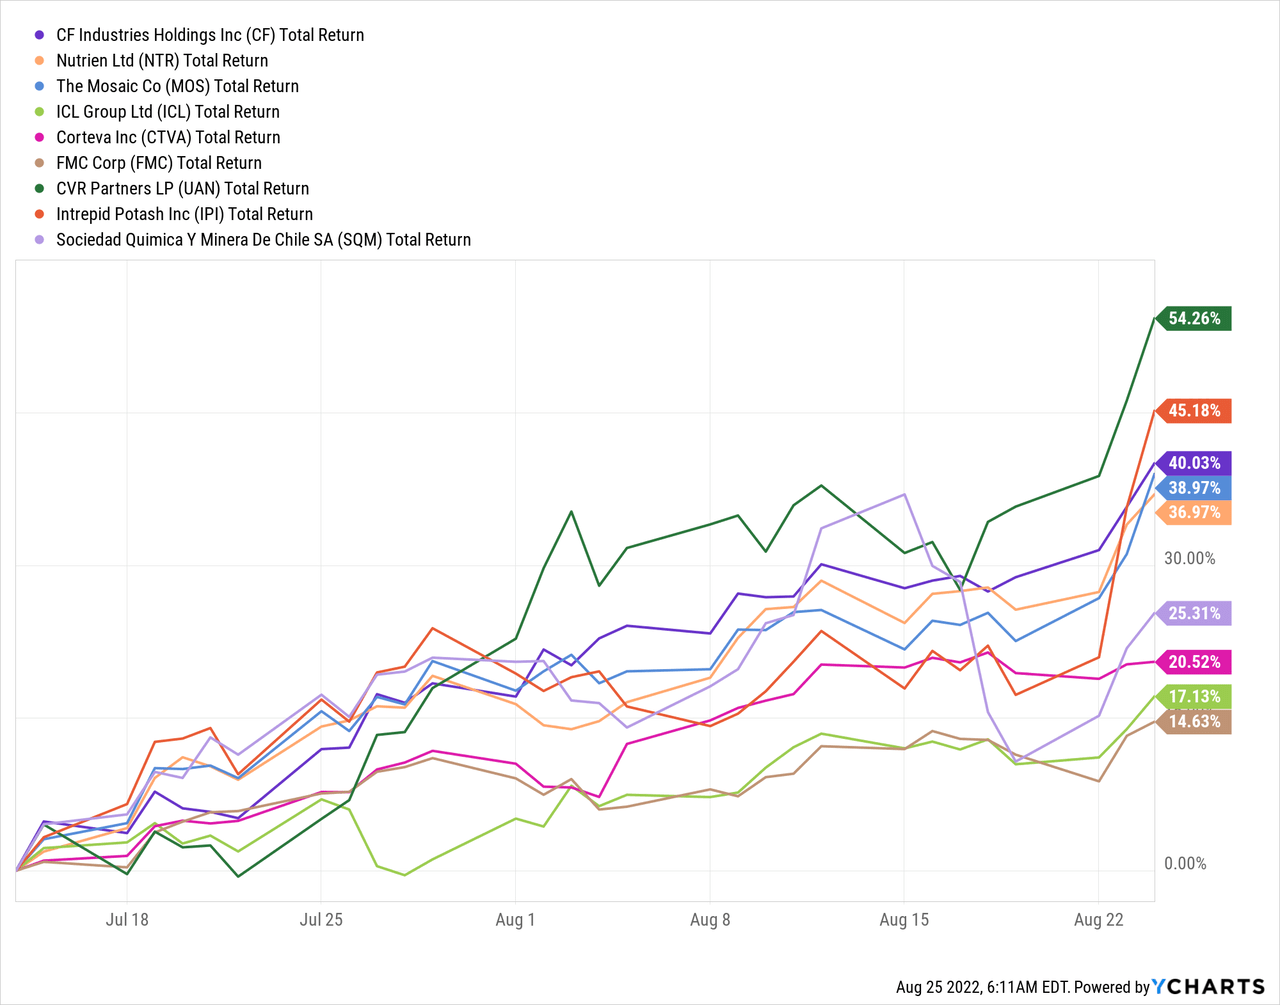
Over the past year, we’ve highlighted this segment twice (here and here) and we still think that there’s room for these stocks to rise further.
When it comes to investing, “Duck” and “Suck” may end up with good Luck.
Be the first to comment