

EUR/USD started another decline from the 1.0200 resistance. USD/JPY is rising and might gain pace above the 138.00 resistance zone.
Important Takeaways for EUR/USD and USD/JPY
· The Euro started a fresh decline and even traded below the 1.0000 support.
· There was a break above a key bearish trend line with resistance near 0.9955 on the hourly chart of EUR/USD.
· USD/JPY started a fresh increase after it broke the 133.50 resistance zone.
· There was a break above a major bearish trend line with resistance near 134.00 on the hourly chart.
EUR/USD Technical Analysis
This past week, the Euro started a fresh decline from well above the 1.0180 level against the US Dollar. The EUR/USD pair declined below the 1.0150 and 1.0120 support levels.
The bears even pushed the pair below the 1.0050 level. There was a close below 1.0000 and the 50 hourly simple moving average. The pair traded as low as 0.9898 and recently started a minor upside correction.
There was a move above the 23.6% Fib retracement level of the downward move from the 1.0203 swing high to 0.9898 low. Besides, there was a break above a key bearish trend line with resistance near 0.9955 on the hourly chart of EUR/USD.
However, the pair struggled to clear the 1.0000 resistance zone and the 50 hourly simple moving average. An immediate resistance on the upside is near the 0.9970 level.
The next major resistance is near the 1.0000 level. An upside break above 1.0000 could set the pace for a steady increase. In the stated case, the pair might revisit 1.0050. It is near the 50% Fib retracement level of the downward move from the 1.0203 swing high to 0.9898 low.
If not, the pair might drop and test the 0.9920 support. The next major support is near 0.9900, below which the pair could drop to 0.9850 in the near term.
USD/JPY Technical Analysis
The US Dollar started a fresh increase from the 130.80 support zone against the Japanese Yen. The USD/JPY pair cleared the 132.20 and 133.00 resistance levels to move into a positive zone.
It gained pace for a close above the 134.50 level and the 50 hourly simple moving average. Besides, there was a break above a major bearish trend line with resistance near 134.00 on the hourly chart. The pair even climbed above the 137.00 resistance zone.
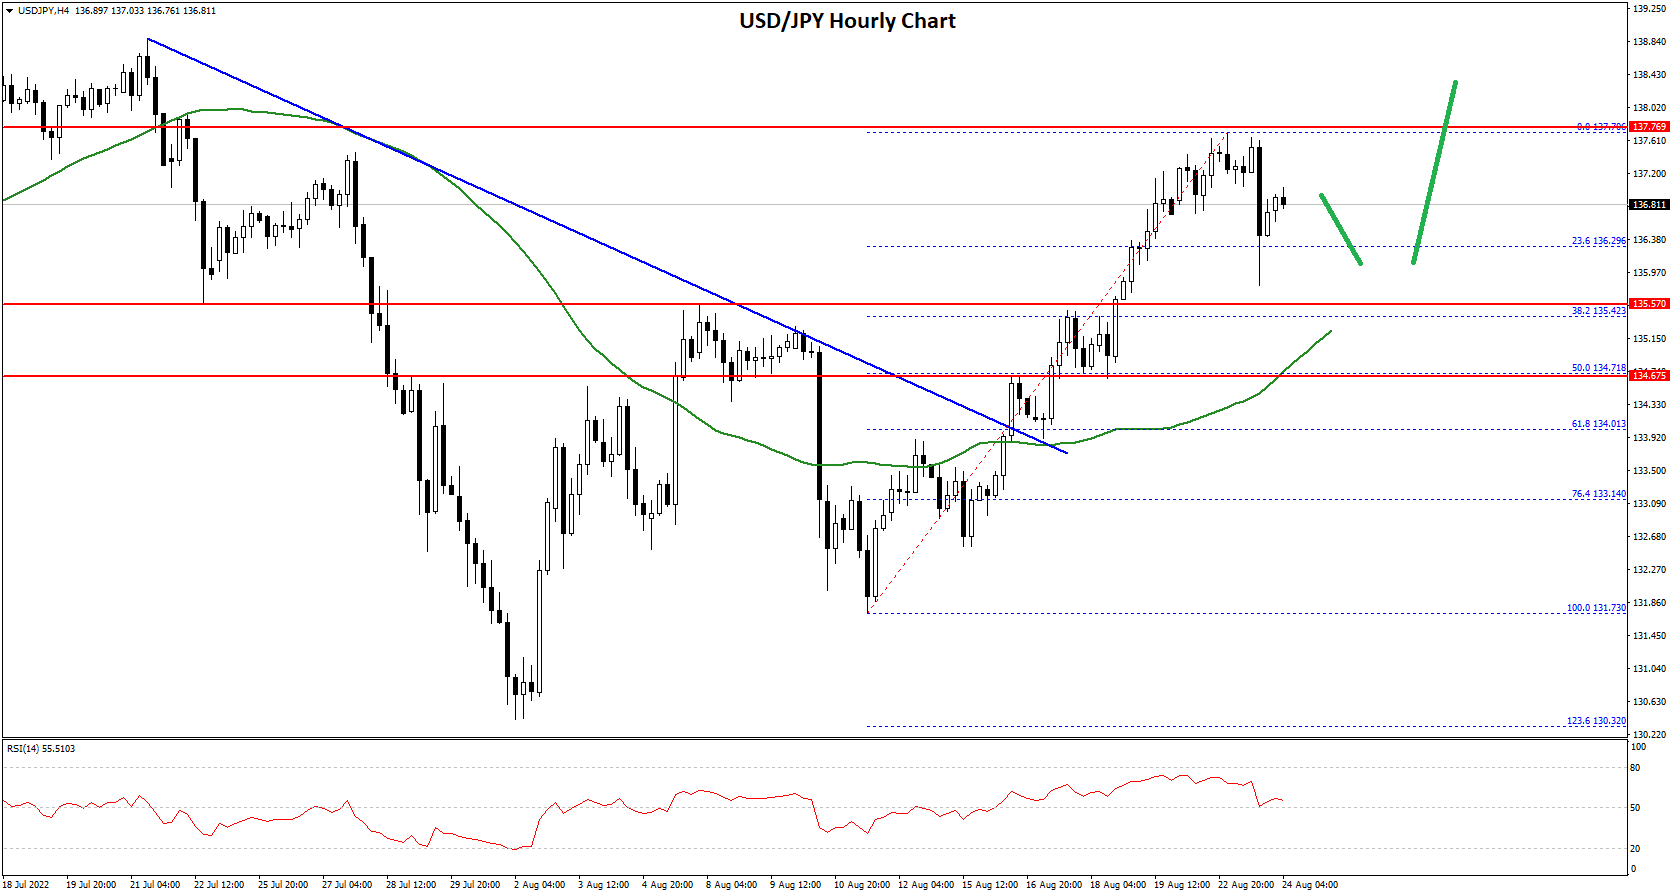
A high was formed near 137.70 and the pair is now correcting lower. There was a move below the 23.6% Fib retracement level of the upward move from the 131.73 swing low to 137.70 high.
An initial support on the downside is near the 135.50 level. The next major support is near the 134.70 level. It is near the 50% Fib retracement level of the upward move from the 131.73 swing low to 137.70 high.
Any more downsides might lead the pair towards the 133.50 support zone, below which the bears might aim a test of the 132.00 support zone.
On the upside, an initial resistance is near the 137.00 level. The next major resistance is near the 137.70 level. Any more gains could send the pair towards the 138.50 level. The next key hurdle is near the 140.00 level.
This forecast represents FXOpen Markets Limited opinion only, it should not be construed as an offer, invitation or recommendation in respect to FXOpen Markets Limited products and services or as financial advice.
Trade global forex with the best ECN broker of 2021*.
Choose from 50+ forex markets 24/5.
Open your FXOpen account now or learn more about making your money go further with FXOpen.
* FXOpen International, best ECN broker of 2021, according to the IAFT

Be the first to comment