

EUR/USD extended decline and tested the 1.0000 support. USD/JPY is rising and might continue to gain pace towards the 140.00 resistance
Important Takeaways for EUR/USD and USD/JPY
· The Euro started a fresh decline and even tested the 1.0000 support.
· There is a major bearish trend line forming with resistance near 1.0035 on the hourly chart of EUR/USD.
· USD/JPY gained pace after it broke the 136.00 resistance zone.
· There is a key rising channel forming with support near 135.70 on the hourly chart.
EUR/USD Technical Analysis
This past week, the Euro started a major decline from well above the 1.0500 level against the US Dollar. The EUR/USD pair declined below the 1.0320 and 1.0250 support levels.
The bears even pushed the pair below the 1.0100 level. There was a close below 1.0100 and the 50 hourly simple moving average. It tested the parity zone and a low is formed near 1.0000 on FXOpen.
It is now consolidating losses and trading above the 1.0020 level. An immediate resistance on the upside is near the 1.0035 level. There is also a major bearish trend line forming with resistance near 1.0035 on the hourly chart of EUR/USD.
The trend line is near the 23.6% Fib retracement level of the downward move from the 1.0189 swing high to 1.0000 low. The next major resistance is near the 1.0070 level and the 50 hourly simple moving average.
The main resistance is near the 1.0100 level. It is near the 50% Fib retracement level of the downward move from the 1.0189 swing high to 1.0000 low. An upside break above 1.0100 could set the pace for a steady increase.
If not, the pair might drop and test the 1.0000 support. The next major support is near 0.9950, below which the pair could drop to 0.9900 in the near term.
USD/JPY Technical Analysis
The US Dollar started a fresh increase above the 135.00 resistance zone against the Japanese Yen. The USD/JPY pair broke the 135.50 level to move further into a positive zone.
It gained pace for a close above the 136.20 level and the 50 hourly simple moving average. A new multi-year high is formed near the 137.75 level. The pair is now consolidating gains near the 137.00 level.
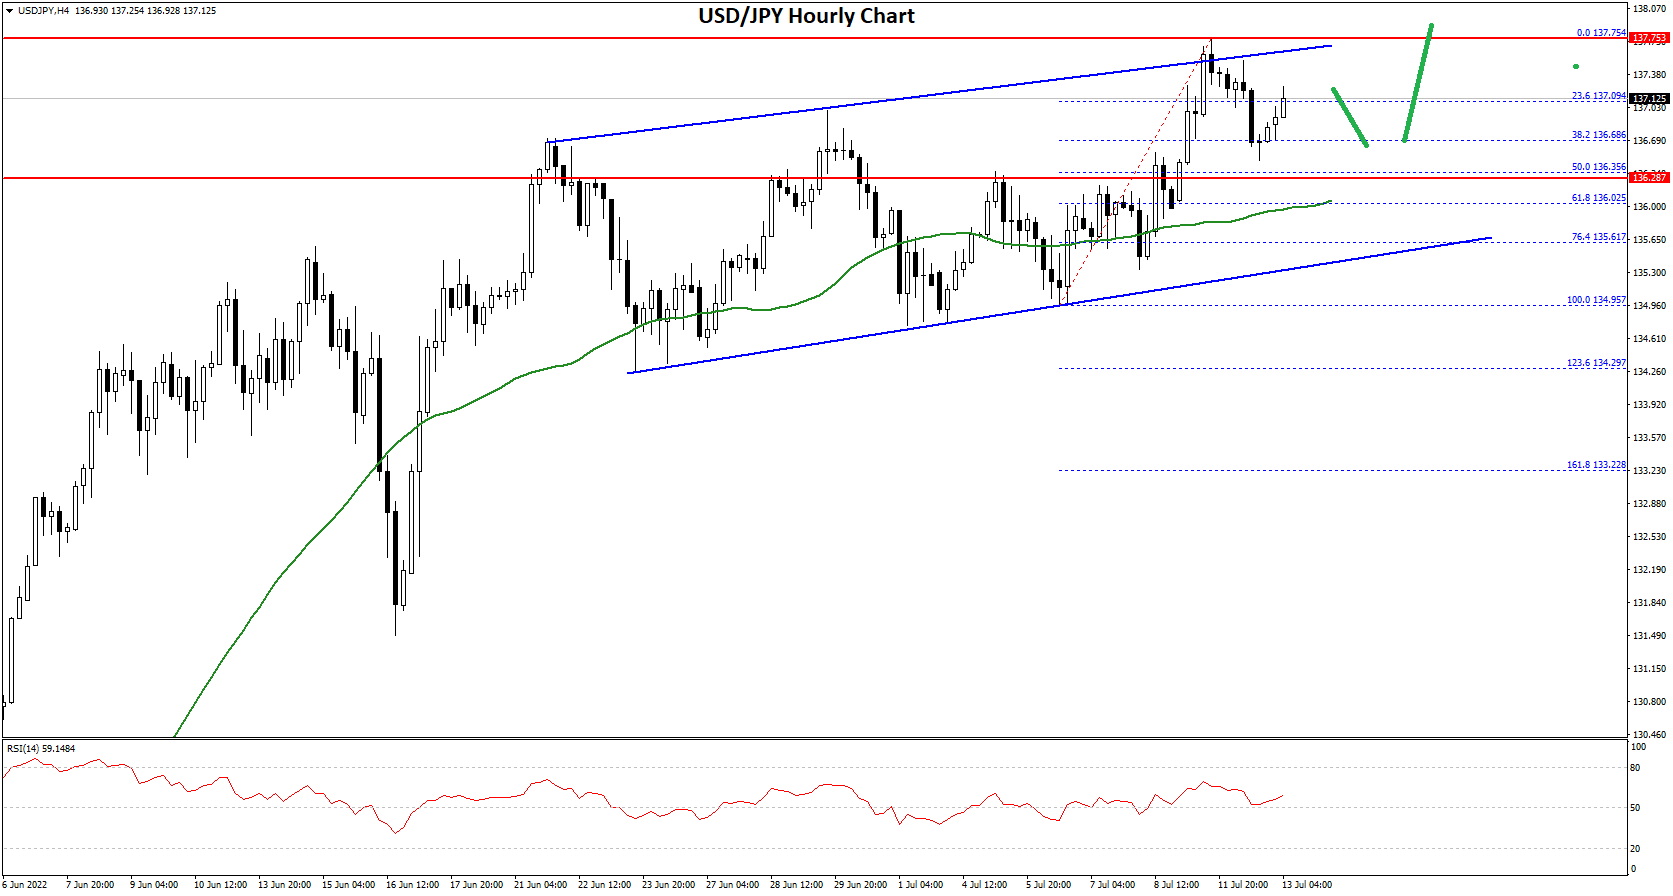
An initial support on the downside is near the 136.70 level. It is near the 38.2% Fib retracement level of the upward move from the 134.95 swing low to 137.75 high. The next major support is near the 136.35 level.
The 50% Fib retracement level of the upward move from the 134.95 swing low to 137.75 high is also near the 136.35 zone. Besides, there is a key rising channel forming with support near 135.70 on the hourly chart.
Any more downsides might lead the pair towards the 135.65 support zone, below which the bears might aim a test of the 135.00 support zone.
On the upside, an initial resistance is near the 137.70 level. The next major resistance is near the 138.20. Any more gains could send the pair towards the 138.80 level. The next key hurdle is near the 140.00 level.
This forecast represents FXOpen Markets Limited opinion only, it should not be construed as an offer, invitation or recommendation in respect to FXOpen Markets Limited products and services or as financial advice.

Be the first to comment