

EUR/USD struggled near 1.0785 and corrected lower. USD/JPY is rising and might continue to gain pace towards the 130.20 resistance
Important Takeaways for EUR/USD and USD/JPY
· The Euro started a downside correction after it failed to surpass 1.0785.
· There is a key bearish trend line forming with resistance near 1.0725 on the hourly chart of EUR/USD.
· USD/JPY gained pace after it broke the 127.50 resistance zone.
· It surpassed a major bearish trend line with resistance near 127.55 on the hourly chart.
EUR/USD Technical Analysis
This past week, the Euro started a decent recovery wave above the 1.0680 level against the US Dollar. The EUR/USD pair cleared the 1.0720 and 1.0740 resistance levels.
However, the pair faced sellers near the 1.0785 level. A high was formed near 1.0786 on FXOpen and EUR/USD started a downside correction. There was a move below the 1.0740 support and the 50 hourly simple moving average.
A low was formed near 1.0679 and the pair is now correcting higher. There was a move above the 1.0700 resistance level. It even spiked above the 50% Fib retracement level of the downward move from the 1.0786 swing high to 1.0679 low.
However, the pair failed to gain pace above the 1.0740 level. It failed near the 61.8% Fib retracement level of the downward move from the 1.0786 swing high to 1.0679 low.
There is also a key bearish trend line forming with resistance near 1.0725 on the hourly chart of EUR/USD. It is now moving lower and trading below 1.0710. An immediate resistance on the upside is near the 1.0725 level.
The next major resistance is near the 1.0740 level. The main resistance is near the 1.0785 level. An upside break above 1.0785 could set the pace for a steady increase.
If not, the pair might drop and test the 1.0675 support. The next major support is near 1.0650, below which the pair could drop to 1.0580 in the near term.
USD/JPY Technical Analysis
The US Dollar started a downside correction from the 131.35 resistance zone against the Japanese Yen. The USD/JPY pair traded below the 130.00 support zone.
It traded as low as 126.35 before the bulls emerged. The pair started a fresh increase above the 127.50 resistance and the 50 hourly simple moving average. There was a break above a major bearish trend line with resistance near 127.55 on the hourly chart.
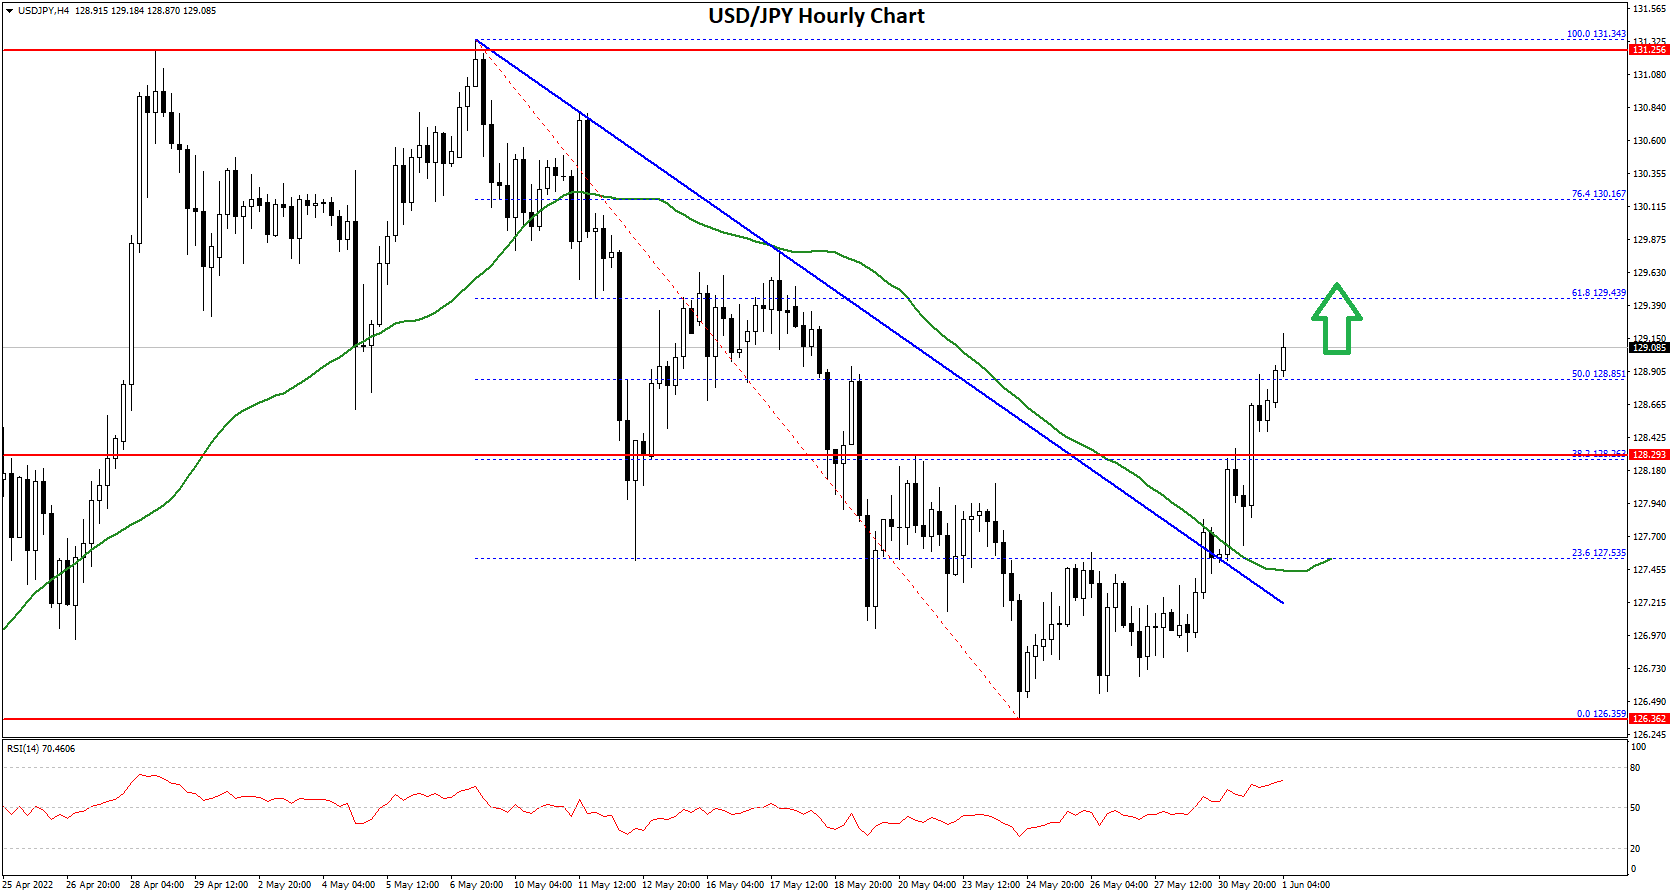
The pair traded above the 50% Fib retracement level of the downward move from the 131.34 swing high to 126.35 low. On the upside, an initial resistance is near the 129.40 level.
The 61.8% Fib retracement level of the downward move from the 131.34 swing high to 126.35 low is also near the 129.43 level. The next major resistance is near the 130.00. Any more gains could send the pair towards the 131.35 level. The next key hurdle is near the 132.00 level.
An initial support on the downside is near the 128.50 level. The next major support is near the 128.20 level. Any more downsides might lead the pair towards the 126.50 support zone, below which the bears might aim a test of the 125.40 support zone.
This forecast represents FXOpen Markets Limited opinion only, it should not be construed as an offer, invitation or recommendation in respect to FXOpen Markets Limited products and services or as financial advice.

Be the first to comment