

EUR/USD is correcting lower and trading below 1.0820. USD/JPY could gain bullish momentum if there is a clear move above the 130.80 resistance.
Important Takeaways for EUR/USD and USD/JPY
· The Euro started a downside correction from the 1.0870 resistance zone.
· There was a break below a key bullish trend line with support near 1.0800 on the hourly chart of EUR/USD.
· USD/JPY is attempting a fresh increase above the 130.00 support zone.
· There was a break above a major bearish trend line with resistance near 129.20 on the hourly chart.
EUR/USD Technical Analysis
This past week, the Euro found support near the 1.0700 zone against the US Dollar. The EUR/USD pair started a steady upward move above the 1.0750 and 1.0800 resistance levels.
There was a clear increase above the 1.0820 resistance zone and the 50 hourly simple moving average. The pair even climbed towards the 1.0850 resistance zone. A high was formed near 1.0874 on FXOpen and the pair is now correcting gains.
There was a move below the 1.0820 support zone. The bears pushed the pair below the 50% Fib retracement level of the upward move from the 1.0730 swing low to 1.0874 high.
Besides, there was a break below a key bullish trend line with support near 1.0800 on the hourly chart of EUR/USD. The pair is now showing bearish signs near 1.0785.
It is consolidating near the 61.8% Fib retracement level of the upward move from the 1.0730 swing low to 1.0874 high. An initial support on the downside is near the 1.0775 level. The first major support is near the 1.0750 level.
The main support sits near the 1.0720 zone, below which the pair could start a major decline. In the stated case, the pair might dive towards the 1.0650 support zone.
On the upside, an immediate resistance is near the 1.0820 level. The next major resistance is near the 1.0850 level. An upside break above 1.0850 could set the pace for another increase. In the stated case, the pair might visit 1.0920. Any more gains might send the pair towards 1.0980.
USD/JPY Technical Analysis
The US Dollar started a fresh increase from the 127.20 zone against the Japanese Yen. The USD/JPY pair started a decent increase above the 128.50 resistance zone.
There was a break above a major bearish trend line with resistance near 129.20 on the hourly chart. The pair jumped above the 50% Fib retracement level of the downward move from the 132.87 swing high to 127.20 low.
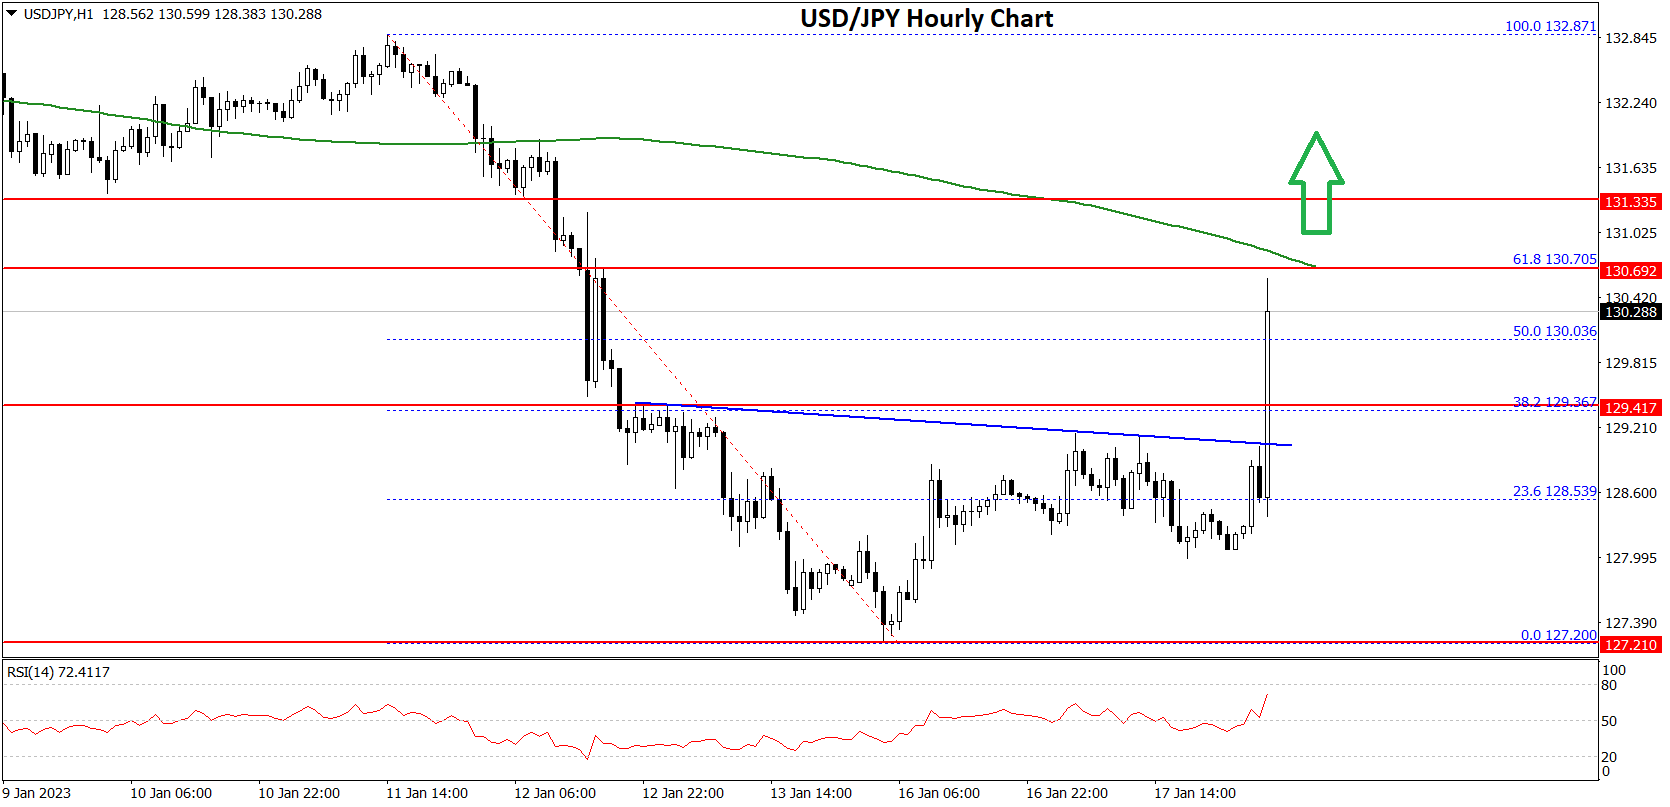
An immediate resistance is near the 130.70 level the 50 hourly simple moving average. It is close to the 61.8% Fib retracement level of the downward move from the 132.87 swing high to 127.20 low.
The next major resistance is near the 131.20 level. Any more gains could send the pair towards the 132.00 level. The next key hurdle is near the 132.50 level, above which USD/JPY may perhaps rise towards the 133.50 level in the coming days.
An initial support on the downside is near the 130.00 level. The first major support is near the 129.50 level. The main support sits near the 128.80 zone, below which the pair could start a major decline. In the stated case, the pair might dive towards the 127.20 support zone.
This forecast represents FXOpen Companies opinion only, it should not be construed as an offer, invitation or recommendation in respect to FXOpen Companies products and services or as financial advice.
Trade global forex with the best ECN broker of 2021*.
Choose from 50+ forex markets 24/5.
Open your FXOpen account now or learn more about making your money go further with FXOpen.
* FXOpen International, best ECN broker of 2021, according to the IAFT

Be the first to comment