

EUR/USD is consolidating below the 1.0650 resistance zone. EUR/JPY declined heavily below 143.00 and is currently attempting a recovery wave.
Important Takeaways for EUR/USD and EUR/JPY
· The Euro started a downside correction from the 1.0735 resistance zone.
· There is a key contracting triangle forming with support near 1.0600 on the hourly chart.
· EUR/JPY started a strong decline and settled below the 142.50 support zone.
· There was a break below two bullish trend lines with support at 145.80 and 145.55 on the hourly chart.
EUR/USD Technical Analysis
The Euro formed a base above the 1.0550 zone and started a decent increase against the US Dollar. The EUR/USD pair was able to clear the 1.0650 and 1.0680 resistance levels.
There was a clear move above the 1.0700 level and the 50 hourly simple moving average. The pair even climbed above 1.0720 and traded as high as 1.0735 on FXOpen. Recently, there was a downside correction below the 1.0650 support zone.
The pair even tested the 1.0580 level and started a consolidation phase. On the upside, an immediate resistance is near the 1.0635 level. It is near the 38.2% Fib retracement level of the downward move from the 1.0735 swing high to 1.0575 low.
The next major resistance is near the 1.0650 level. There is also a key contracting triangle forming with support near 1.0600 on the hourly chart.
The 50% Fib retracement level of the downward move from the 1.0735 swing high to 1.0575 low also sits near 1.0655. A clear move above the 1.0655 resistance might send the price towards 1.0700. If the bulls remain in action, the pair could visit the 1.0750 resistance zone in the near term.
On the downside, the pair might find support near the 1.0600 level. The next major support sits near the 1.0585 level, below which the pair could even test the 1.0520 support zone.
If there is a downside break below the 1.0520 support, the pair might accelerate lower in the coming sessions. In the stated case, it could even test 1.0425.
EUR/JPY Technical Analysis
The Euro started a major decline from well above the 146.00 level against the Japanese Yen. The EUR/JPY pair gained pace and traded below the 145.00 support.
There was a clear move below the 143.50 support and the 50 hourly simple moving average. Besides, there was a break below two bullish trend lines with support at 145.80 and 145.55 on the hourly chart. The pair even broke the 142.00 level and traded as low as 138.80.
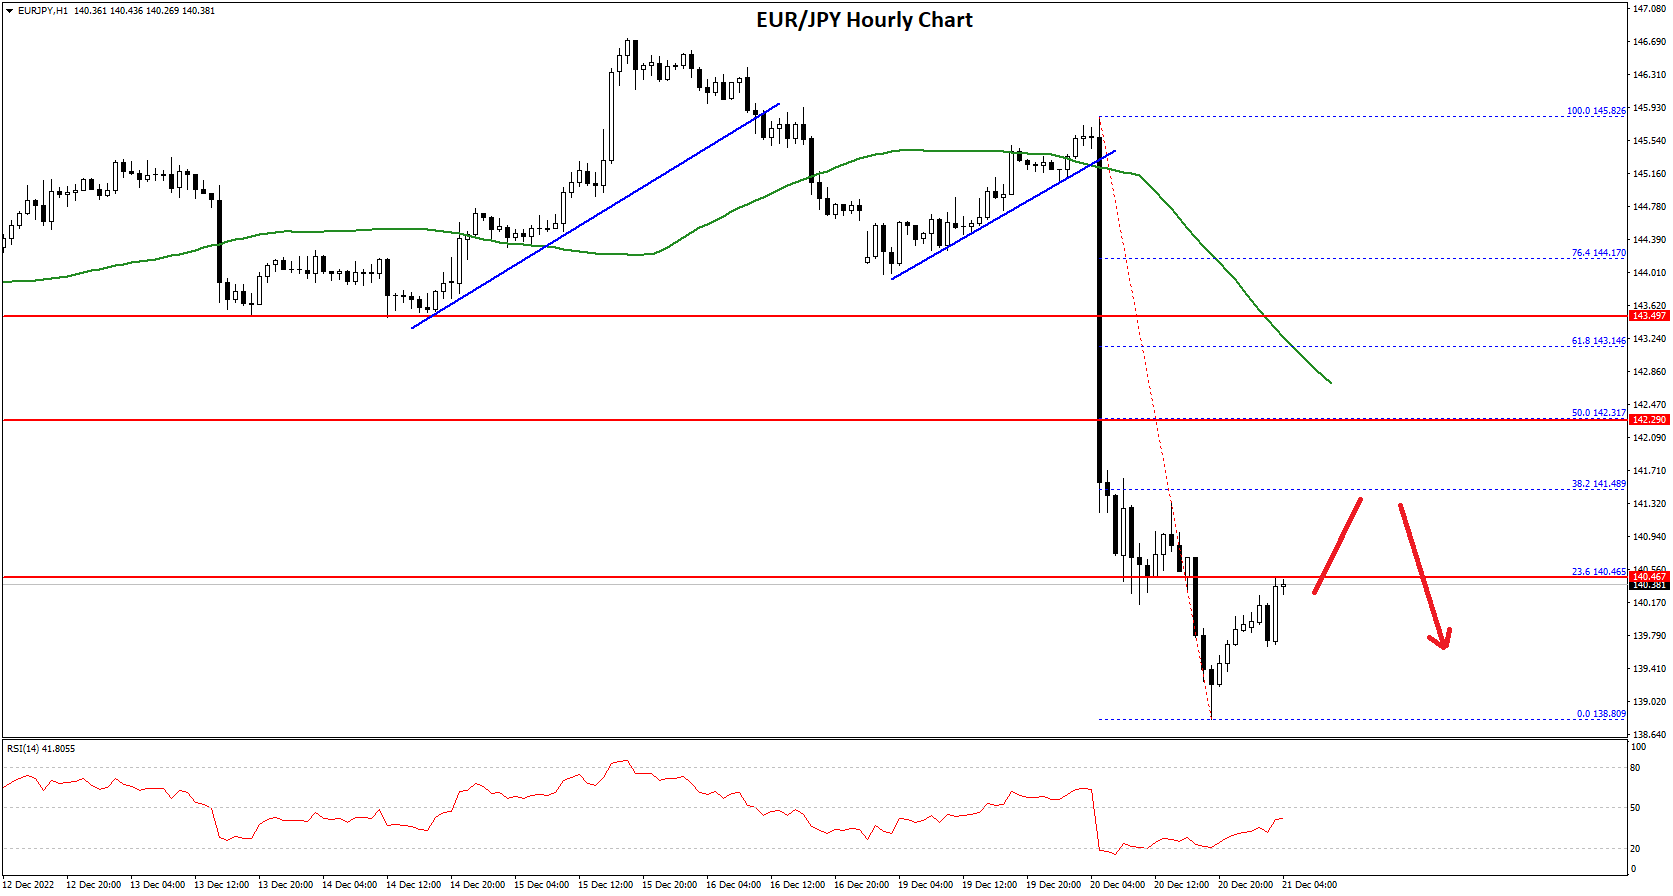
It is now consolidating losses near the 140.40 level. It is near the 23.6% Fib retracement level of the downward move from the 145.82 swing high to 138.80 low.
An immediate resistance on the upside is near the 140.45 level. The next major resistance could be near the 141.50 level. If there is an upside break above the 141.50 resistance, the pair could test the 142.50 resistance or the 50 hourly simple moving average.
Any more gains might send the pair towards the 143.20 level or the 50% Fib retracement level of the downward move from the 145.82 swing high to 138.80 low.
On the downside, the pair might find support near the 139.50 level. The next major support is near 138.80. Any more losses could lead the pair towards the 137.20 support level in the near term.
This forecast represents FXOpen Companies opinion only, it should not be construed as an offer, invitation or recommendation in respect to FXOpen Companies products and services or as financial advice.
Trade global forex with the best ECN broker of 2021*.
Choose from 50+ forex markets 24/5.
Open your FXOpen account now or learn more about making your money go further with FXOpen.
* FXOpen International, best ECN broker of 2021, according to the IAFT

Be the first to comment