

gustavofrazao/iStock via Getty Images
Written by Nick Ackerman, co-produced by Stanford Chemist. This article was originally published to members of the CEF/ETF Income Laboratory on August 5th, 2022.
Eaton Vance Tax-Managed Global Diversified Equity Income Fund (NYSE:EXG) and Eaton Vance Tax-Managed Global Buy-Write Opportunities Fund (NYSE:ETW) are two funds both offered by Eaton Vance – a subsidiary of Morgan Stanley (MS). This is yet another example of two similarly named funds from this sponsor that doesn’t tell us a whole lot of what could be different between these funds from the name alone.
There are some key differences between these funds. Over the long run, these differences between the funds have resulted in different results. Short-term, we’ve seen the performance of these funds mirror each other quite closely.
We’ve previously explored this theme from other Eaton Vance and BlackRock (BLK) funds. Another example was even comparing ETW with Eaton Vance Tax-Managed Buy-Write Opportunities Fund (ETV). Readers have shown an interest to keep exploring these types of comparison articles.
Eaton Vance Tax-Managed Global Diversified Equity Income Fund (EXG)
First, we will start out with some of the basics. EXG will “invest in a diversified portfolio of domestic and foreign common stocks with an emphasis on dividend-paying stocks and writes call options on one or more U.S. and foreign indices with respect to a portion of the value of its common stock portfolio to generate current cash flow from the options premium received.” They last reported being overwritten by 48%.
They have a “tax-managed” focus, as the name would suggest. They do this by “evaluating returns on an after-tax basis and seeks to minimize and defer federal income taxes incurred by shareholders in connection with their investment in the fund.”
In investing in this manner, they hope to achieve the fund’s investment objectives. The primary objective here is “to provide current income and gains, with a secondary objective of capital appreciation.”
Eaton Vance Tax-Managed Global Buy-Write Opportunities Fund (ETW)
ETW will “invest in a diversified portfolio of common stocks and write call options on one or more U.S. and foreign indices on a substantial portion of the value of its common stock portfolio to seek to generate current earnings from the option premium.” The fund last reported being overwritten at 95% of the portfolio.
This is aggressive and can be up to 100% of the portfolio. Option writing is the main focus of the fund. It can be a slightly defensive strategy, though it won’t be completely immune to strong sell-offs. The strategy will work best in a mostly flat market.
The tax-managed focus comes in with the “fund evaluating returns on an after-tax basis and seeks to minimize and defer federal income taxes incurred by shareholders in connection with their investment in the Fund.” The investment policy is designed to achieve its main objective; “to provide current income and gains, with a secondary objective of capital appreciation.”
Key Differences
As we can see, they are mostly similar in their approach that they will invest in a portfolio of equities. They will also utilize a call writing strategy against indexes. Both funds are fairly sizeable, but ETW is smaller, with around $992 million in managed assets compared to EXG’s $2.646 billion.
Index call writing and single stock covered call writing can make a difference on its own; that’s a topic we’ve discussed previously. For the sake of simplicity, just realize that the main difference is that index options are cash-settled. You can’t own an index directly, so it can’t technically be “covered.”
Where we get key difference number one is the amount that they target when they are overwriting their portfolio.
EXG has a target of roughly overwriting 50% of their portfolio, whereas ETW is looking at a target of 100% being overwritten. In general, that will make ETW more of a defensive play as more of their portfolio is going towards this defensive strategy.
The option writing strategy also leads to another subtle difference that wouldn’t be able to be seen with an initial superficial glance of the funds. ETW benchmarks against the S&P 500 and MSCI Europe Indexes. EXG’s benchmark is simply the MSCI World Index. This impacts which indexes they will write calls against, though they both utilize a fairly mixed option writing portfolio in this case.
Below is a look at ETW’s last annual report showing every index they had written calls against.
ETW Written Options (Eaton Vance)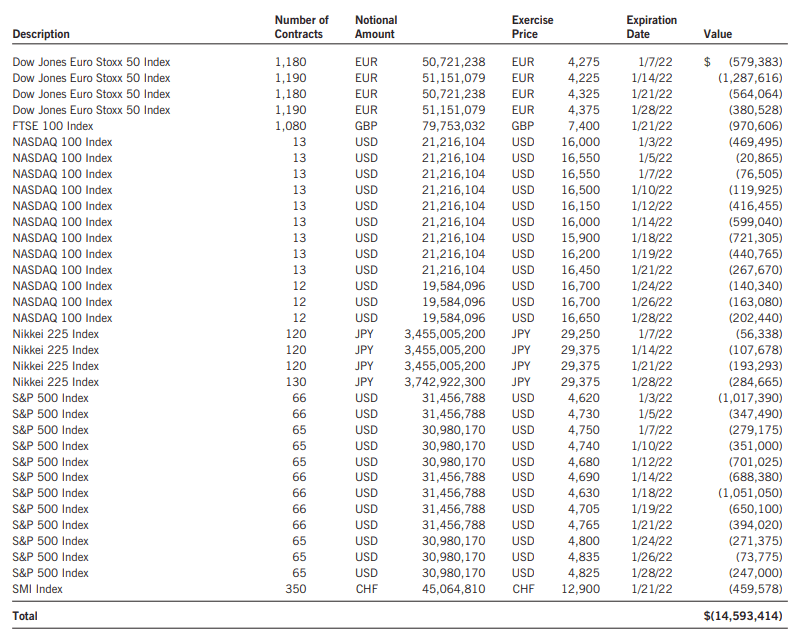
Then there are the options indexes that EXG had written against at the end of their fiscal year-end as shown in their annual report. Note that the fiscal year-end for EXG is October and ETW is December.
EXG Index Writing (Eaton Vance)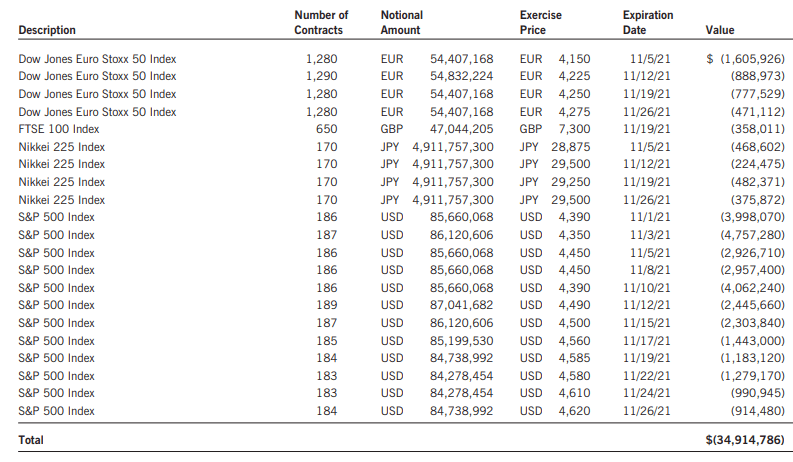
The key difference here is that ETW has options written against the NASDAQ 100 Index and EXG does not.
The indexes they write against are an important distinction because, with the Eaton Vance funds, they also have to “hedge” their call writing. As I stated above, an index cannot be owned directly. Since these are cash-settled, that means the higher the index rises, the more losses that can be realized on the options trade. This needs to be offset with their portfolio of holdings.
Both funds carry several names in the top holdings that overlap. Primarily, we see overlap with the mega-cap tech names. This is to be expected given the weighting of these names in the indexes that they track. MSCI World Index looks quite a bit like the S&P 500 with some of the top constituents.
ETW and EXG Holdings (Eaton Vance)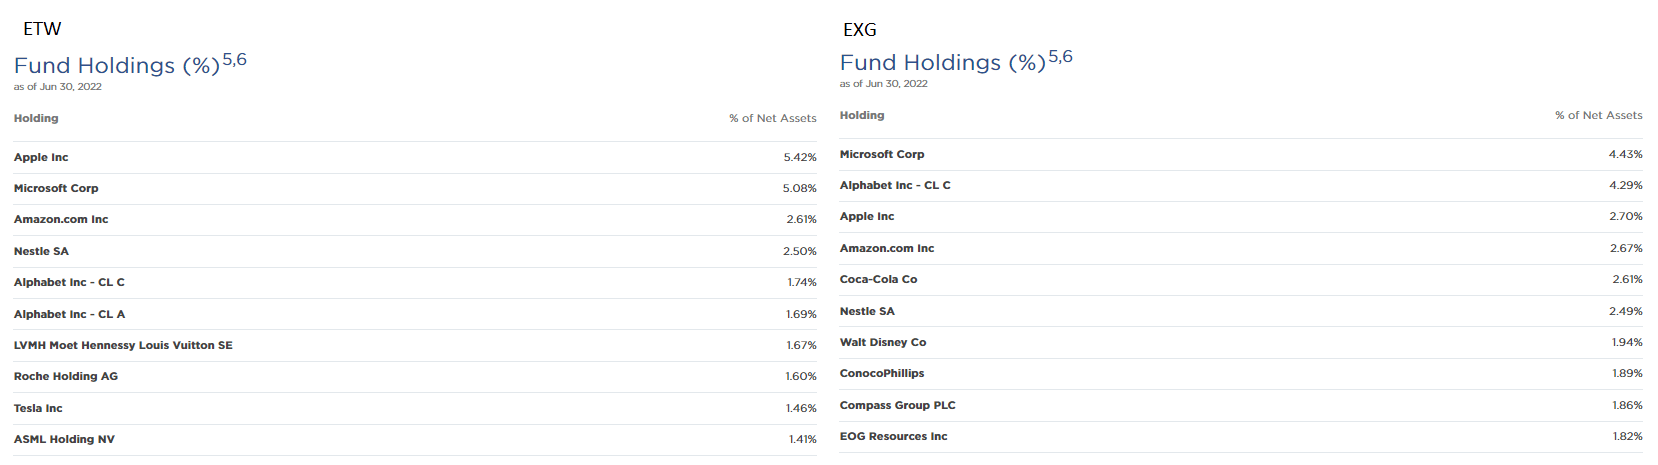
If they didn’t have sizeable weightings towards these holdings, then the fund’s options writing could produce sizeable losses while the portfolio could also create losses. With the mega-cap tech names having meaningful positions, if the indexes are rising, then that would have a lot to do with these mega-cap tech names appreciating as well.
Another difference between the funds is the number of holdings. EXG holds a fairly narrow 81 different positions. ETW holds 317 names. So EXG is more concentrated in the way its portfolio is positioned.
That being said, this isn’t reflected in the top ten of EXG comes to a 26.7% weighting compared to ETW’s 25.18%. Both these funds carry a rather sizeable allocation to their top ten. That would suggest that despite ETW’s almost having 4x the number of holdings, as you get closer to the bottom, these positions will have a reduced impact due to small weightings.
These differences in holdings and benchmarks also result in some differences in portfolio weighting in terms of sector allocations. However, do note once again that ETW’s weightings listed here are as of the end of December 2021, and EXG’s is showing the end of October 2021.
ETW and EXG Sector Weighting (Eaton Vance)
To sum up, the key differences are;
- ETW targets 100% of its portfolio being overwritten compared to EXG’s 50% target.
- ETW’s benchmark is the S&P 500 and MSCI Europe; EXG’s benchmark is MSCI World Index.
- While the benchmark indexes tend to have sizeable overlap, the number of positions held in each portfolio is quite different. ETW is arguable more diversified with its greater number of holdings.
- The differences there result in a bit of a difference in sector allocations of the fund more broadly.
How Have These Differences Played Out?
Over the longer run, ETW has underperformed EXG. However, this is more specifically over the last decade in terms of performance. We can also see that these funds had been tracking each other fairly closely. It was around 2019 to 2020 that saw these funds starting to diverge. Out of the COVID crash, we can see that EXG had really started to outpace and run away with better results.
Ycharts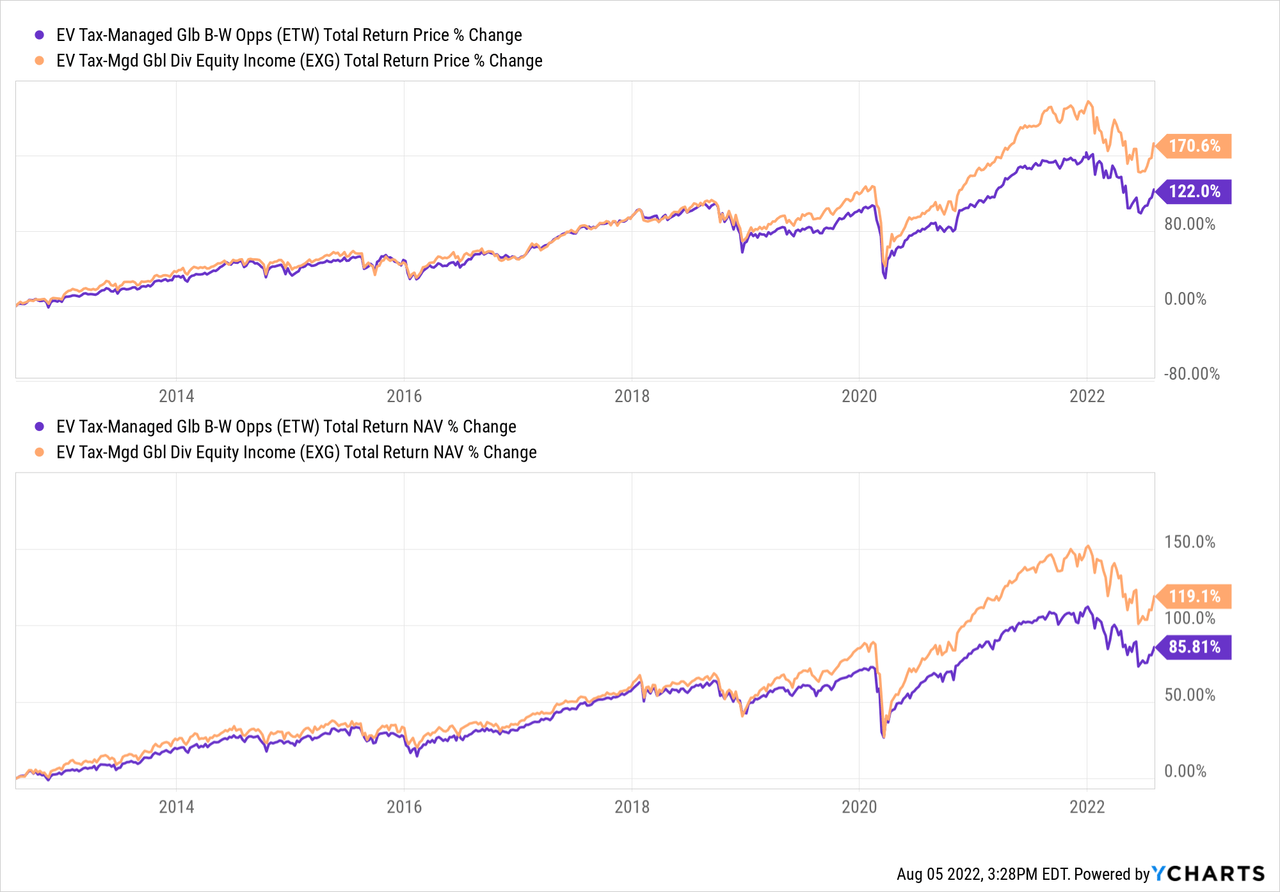
One of the reasons I believe this is the case is because of the higher options weighting that ETW has. With 100% of the portfolio being overwritten, that means more of a drag in terms of performance. When the indexes are rising more rapidly, losses are generated on the options writing side of the equation. Remember, these are cash-settled, so the higher the index goes, the more that these funds have to fork over to settle the trades.
This is more specifically where having a different fiscal year-end is unfortunate. We can’t compare the same time frame in terms of what losses on their options strategy resulted in. Though, it can give us a rough gauge of what was happening.
For EXG, we can see the written options generated a realized loss of $80,895,279. Total assets at the end of October 31st, 2021, were at $3,205,859,717 – which puts those losses generated around 2.52% of assets.
ETW generated realized losses due to written options of $47,748,413 but for the twelve months ended December 31st, 2021. Against the total assets at that time of $1,207,188,051 – which works out to around 3.96% of assets.
Additionally, we can simply look at the period between March 23rd, 2020 to today and compare the performance. March 23rd, 2020, was the low we reached in the COVID crash. In that case, we can see just how much stronger EXG performed. Although we can’t nail down exactly what portion was due to being more aggressively overwritten vs. simply differences in the portfolio composition.
Ycharts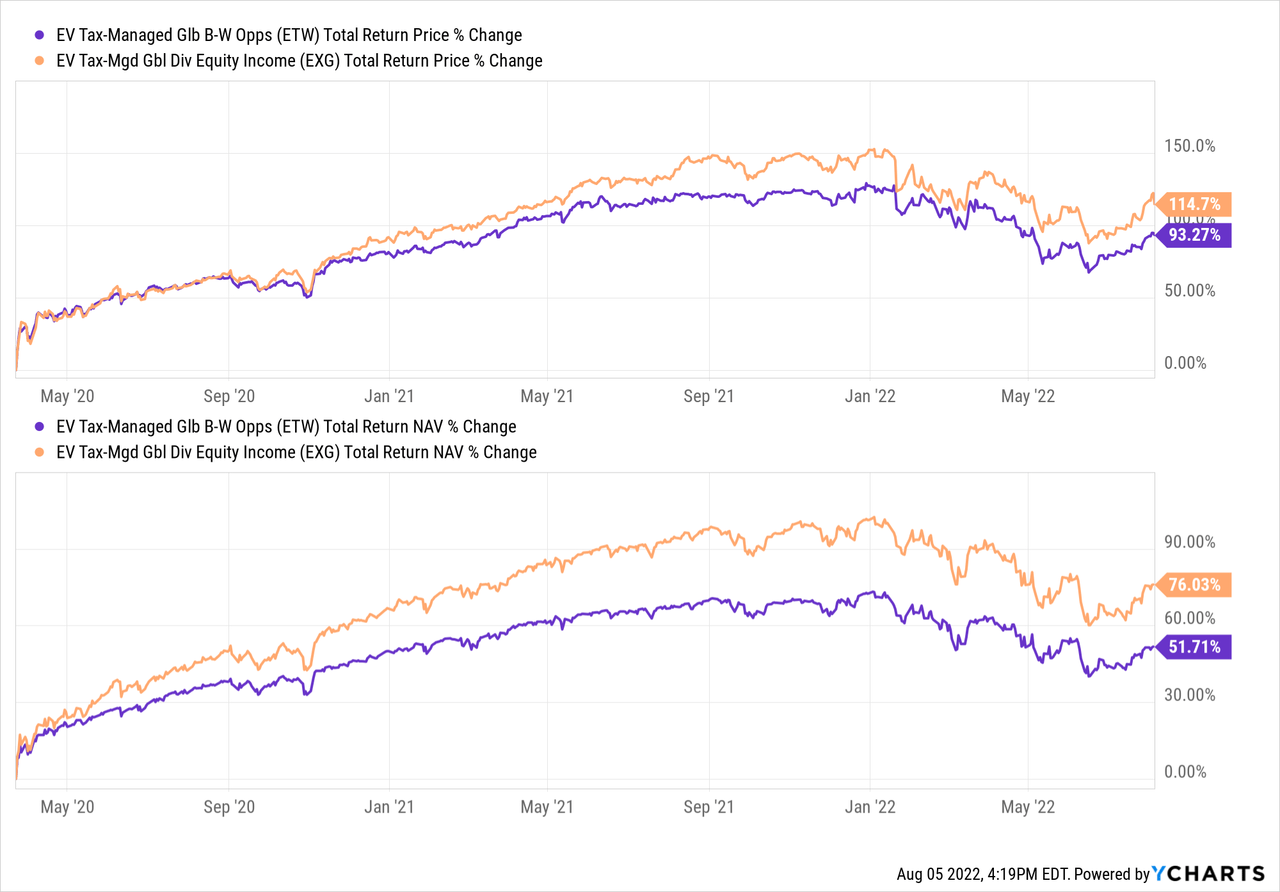
One other performance period I wanted to take a look at was the YTD period for 2022. These funds have struggled, as have the overall broader markets. In this case, ETW has eked out a slight total NAV return performance above EXG.
Ycharts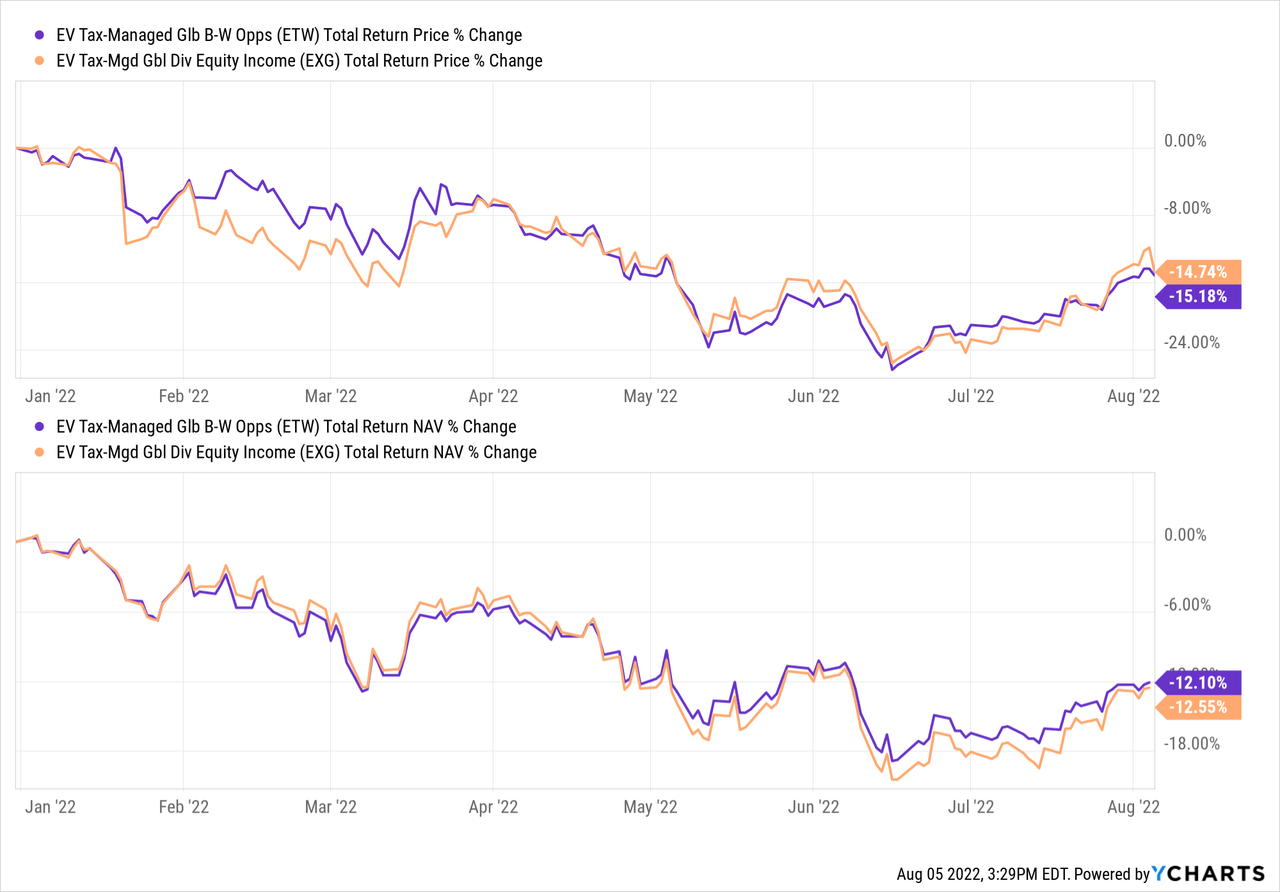
Distribution And Taxes
Another important factor for looking at a closed-end fund is the distribution yield and the taxes associated with those often higher than normal distributions. We can see that the actual yields have followed each other fairly closely, going back to around 2014.
Ycharts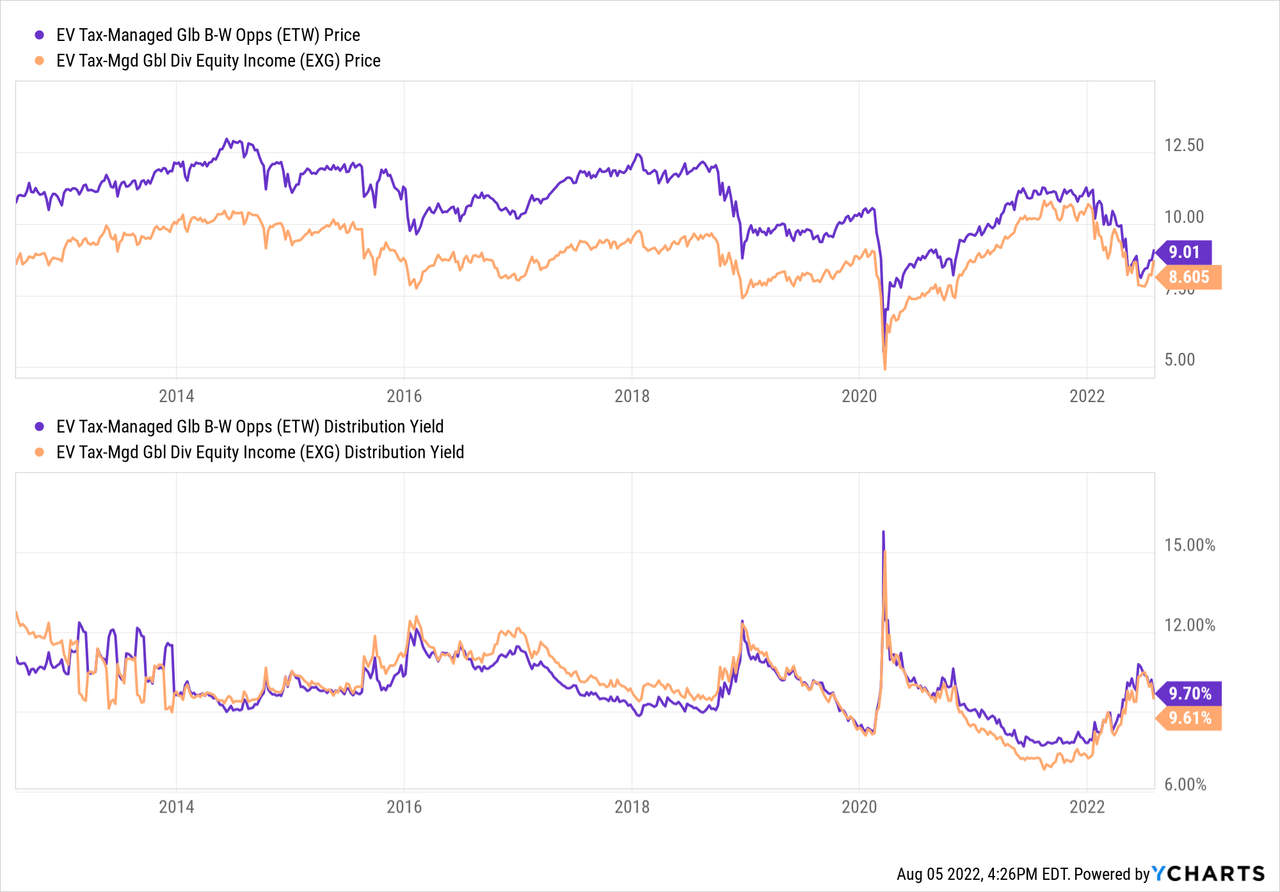
Both funds have had to trim their distributions over the years. The largest cuts happened shortly after 2008, which was a period when many CEFs cut their distributions.
Here is ETW’s distribution history.
ETW Distribution History (CEFConnect)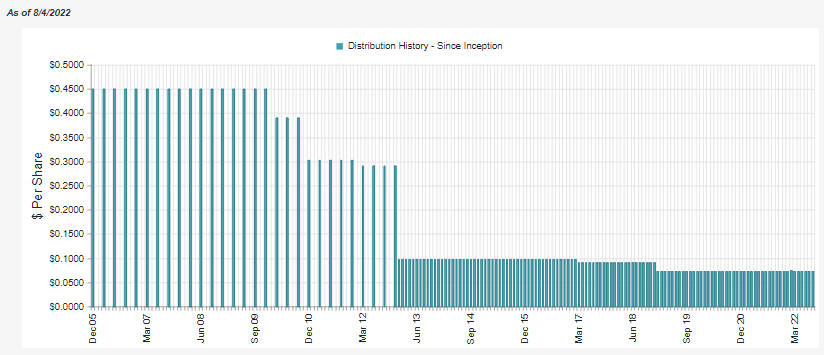
Here is EXG’s distribution history. For what it’s worth, EXG saw a small bump in 2021.
EXG’s Distribution History (CEFConnect)
For tax purposes in 2021, both funds were fairly close in their classifications. Each had some ordinary dividends but was considered entirely qualified dividends. Then the largest classification of each distribution was long-term capital gains. Then each had a fair amount of return of capital.
Tax Classifications (Eaton Vance (highlights from author))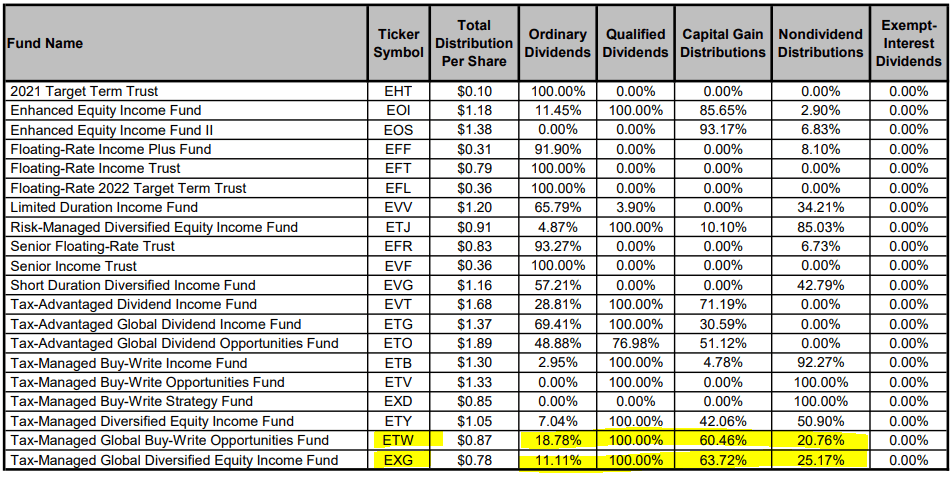
Since they utilize index writing, this is one of the key benefits is the return of capital distributions that can often be associated with the strategy. The strategy can generate losses while indexes are appreciating, which can offset any realized gains for the fund.
With not enough gains realized, that would translate into seeing return of capital for shareholders. That is despite if unrealized appreciation is still keeping up, meaning that unrealized appreciation is enough to offset the losses realized. We could call that non-destructive return of capital if the NAV is still rising or staying flat.
Conclusion
Hopefully, one can make a more informed decision now after reading this article on the differences between the funds. I own ETW and have been quite content with the results, even though knowing the higher overwritten portion can mean sizeable underperformance in a bull market.
Ycharts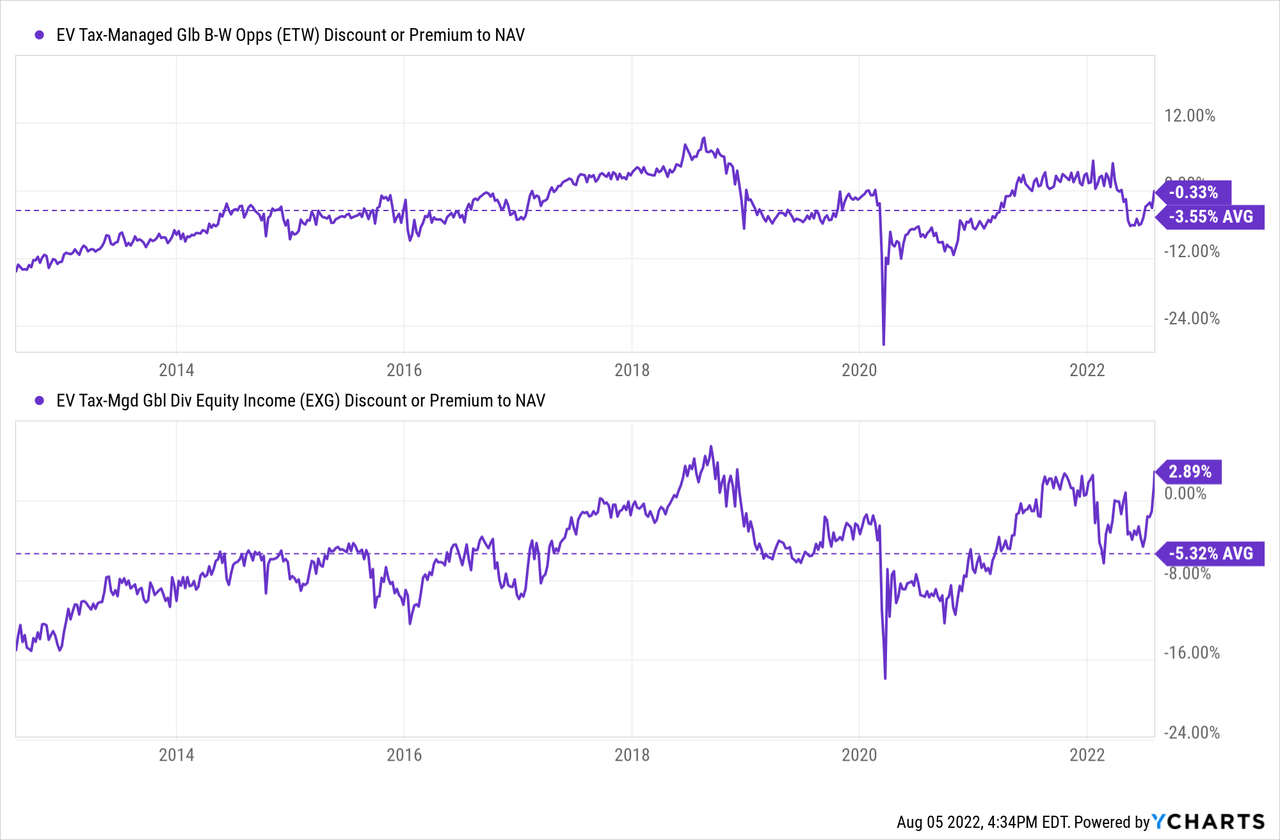
The funds were both trading above their longer-term historical average discounts. EXG’s even at a slight premium. That puts it well above the average discount. That could be another reason why ETW could be the more appropriate investment at this time.
Be the first to comment