

ETHUSD: Bullish Engulfing Pattern above $2,750
Ethereum was moving in a bearish phase last week and touched a low of 2,725 on May 1st, after which it entered into a consolidation channel above the $2,750 handle.
This week, ETHUSD started moving in a bullish channel, and managed to cross the $2,900 handle in the European trading session today.
We can clearly see a bullish engulfing pattern above $2,750 which signifies the end of a bearish trend and the start of a bullish trend.
We can see that the price of Ethereum has retracted from its highs due to some profit taking, but the bullish channel continues, and we are aiming for the upsides of $3,100 and $3,300 this week.
ETH is now trading just below its pivot level of 2,936 and moving in a mild bullish momentum. The price of ETHUSD is now facing its classic resistance level of 2,944, Fibonacci resistance level of 2,960, and is now aiming towards the $3,000 handle in the US trading session.
Most of the moving averages are giving a BUY signal.
ETH is now trading below both its 100 hourly and 200 hourly simple MAs.
- Ethereum is in a mildly bullish channel
- Short-term trend reversal seen above $2,750
- All the major technical indicators are giving a NEUTRAL to BUY signal
- The average true range is indicating LESSER market volatility
Ether: Bullish Channel Above $2900 Confirmed
ETHUSD has consolidated its gains above $2,900 in the European trading session, and we can clearly see that the bullish channel is back.
We are now aiming for the upsides of $3,000 to $3,100 in today’s US trading session. The retracement from $2,721 was very strong which suggests that there is more room for the upsides in Ethereum this month, and a level of $3,500 is the next target.
We can see the MA crossover pattern above the level of 2,850 which means that in the immediate short term we will see the continuation of the bullish channel.
ETH has gained 2.86% with a price change of 81.25$ in the past 24hrs, and has a trading volume of 17.890 billion USD.
We can see an increase of 36% in the trading volume as compared to yesterday which means that new buyers are entering the markets and waiting for further correction in the levels of Ethereum.
The Week Ahead
Ether is printing above $2,980 today, and we can see levels of $3,000 to $3,200 this week.
The medium-to-long term outlook for Ether remains bullish with targets of above 3,500 in May.
With the US Federal Reserve increasing its benchmark interest rate by half a percentage point, the price of Ethereum continues rising along with other top cryptocurrencies.
Ether has already broken its major resistance level of $2,800 and is now facing the next resistance level of $3,000.
Technical Indicators:
The commodity channel index (14-day): at 135.24 indicating a BUY
The moving averages convergence divergence (14-day): at 14.80 indicating a BUY
The ultimate oscillator: at 61.44 indicating a BUY
The rate of price change: at 3.39 indicating a BUY
LTCUSD: Bullish Engulfing Pattern Above $97
Litecoin had a major bearish correction last week and touched a low of $94 on May 1st, after which we can see a mild bullish momentum above the $100 handle.
We can see a bullish engulfing pattern today above $97 which signifies a bullish trend reversal. We are aiming for the upside of $105 in the US trading session today.
Litecoin is consolidating above the $100 handle forming a triangle pattern which is expected to push its price towards the level of $110.
This week, we can see an increase in the bullish momentum, which is a positive signal for fresh buyers.
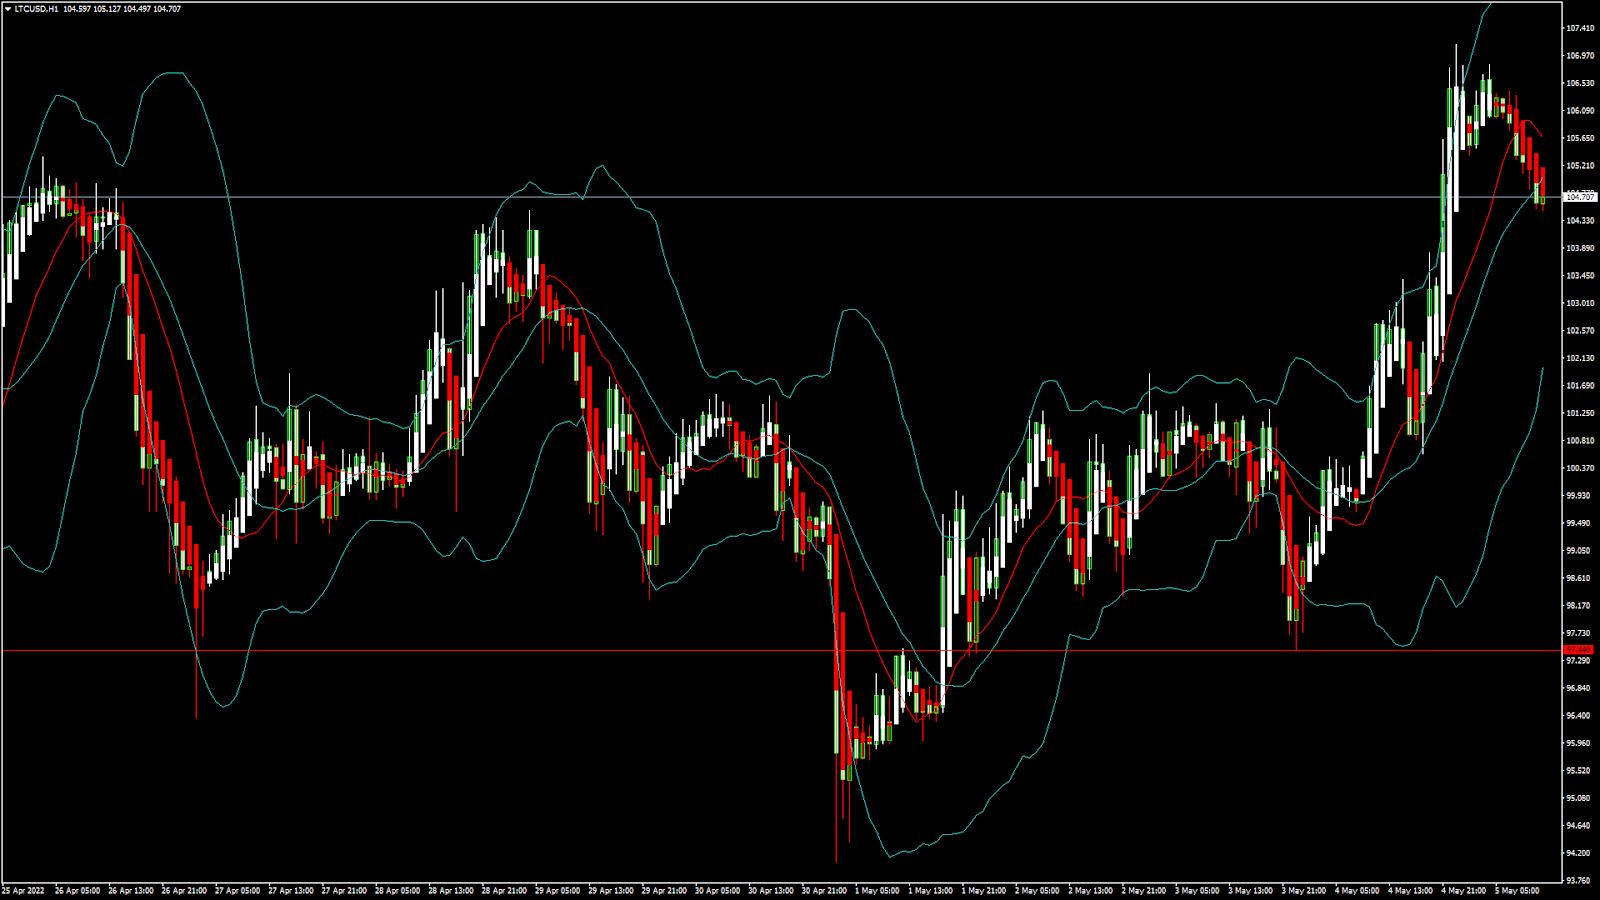
Litecoin is now trading below its 100 hourly simple and 200 hourly exponential MAs. The price of LTCUSD is trading below its pivot level of 105.63.
Litecoin touched a high of 106.81 in the early Asian trading session, after which we can see a fall in its levels towards a low of 104.51.
The immediate short-term outlook for Litecoin has turned bullish.
- Medium-to-long term outlook for Litecoin remains bullish
- Most of the MAs are giving a BUY signal
- A confirmed uptrend is seen in medium-term range above $100
- The average true range is indicating LESSER market volatility
Litecoin: Bullish Momentum Above $100 Confirmed
The price of Litecoin has come out of the Consolidation phase today and is now moving in a mildly bullish channel above the $100 handle in the European trading session.
After touching the level of 106.81, a contraction in its prices is expected as seen from the MA5 crossover pattern.
The price of LTCUSD is now facing its classic resistance level of 106.16 and Fibonacci resistance level of 106.93, after which the path towards $110 will get cleared.
We have seen a 20-day SMA crossover which also signifies the shift in the trends towards the bullish channel.
Litecoin trading volume has increased by 27.54% in the last 24hrs as new investors are entering into the market now.
In the last 24hrs LTCUSD has gained 2.32% by 2.38$, and has a 24hr trading volume of 0.757 billion USD.
The Week Ahead
Litecoin is witnessing increased trading volumes today as compared to yesterday; we can see the prices of LTCUSD entering into a consolidation phase above the $104 handle.
At present market levels, we can see a mildly bullish channel which is expected to keep the prices of Litecoin above the $100 handle.
We will need to wait and see if the price of LTCUSD continues to remain above the $100 mark: then fresh buying could be expected.
It is also possible for the prices to continue moving in a narrow range between $100 and $115.
The weekly outlook is projected at $115 with a consolidation zone of $110.
Technical Indicators:
The ultimate oscillator: at 64.04 indicating a BUY
Stoch (9, 6): at 74.65 indicating a BUY
The Williams percent range: at -20.83 indicating a BUY
The average directional change (14-day): at 22.83 indicating a NEUTRAL level
Be the first to comment