

ThitareeSarmkasat/iStock via Getty Images
Investment Thesis
ESG Investing has exploded in the ETF space in recent years. I’ve counted 38 ETFs with “ESG” in the title and another dozen or so that tackle various themes from climate change to gender diversity to minority empowerment. Two have emerged as leaders through all the noise: the iShares ESG Aware MSCI USA ETF (NASDAQ:ESGU) and the Vanguard ESG U.S. Stock ETF (BATS:ESGV). These two funds have a combined $27.50 billion in assets under management and have managed to keep pace with the SPDR S&P 500 ETF (SPY) since their launch dates. This article explores how they’ve done it, compares their strategies and fundamentals, and ultimately decides if they’re worth pursuing over a more straightforward S&P 500 Index ETF.
ETF Overview
ESGU Strategy and Exposures
iShares lists three reasons to invest in ESGU:
- Obtain large- and mid-cap exposure to U.S. stocks with favorable environmental, social, and governance ratings.
- Seek similar risk and return to the MSCI USA Index.
- It helps to build a sustainable long-term equity portfolio.
These statements don’t offer much, but looking at the MSCI USA Extended ESG Focus Index adds more color. The Index seeks to maximize exposure to ESG factors after setting a target tracking error of 0.50% against the MSCI USA Index. Furthermore, a minimum constituent weight of 0.05% is applied, and companies in the following industries aren’t eligible:
- Tobacco
- Controversial Weapons
- Civilian Firearms
- Thermal Coal
- Oil Sands
The 0.50% target tracking error is critical. My interpretation is that its sector exposures are unlikely to be substantially different than the parent Index. That’s great news for investors looking to dip their toes into ESG investing without sacrificing results, as I believe is the case for most investors. Since the Index is optimized based on ESG factors subject to certain constraints, ESGU is considered a “principles-based” ETF according to FactSet.
ESGU’s sector exposures are below. These sector exposures are similar to SPY, though it’s overweight Technology by 1.21% and underweight Communication Services by 0.90%. Other than that, the differences are immaterial.
iShares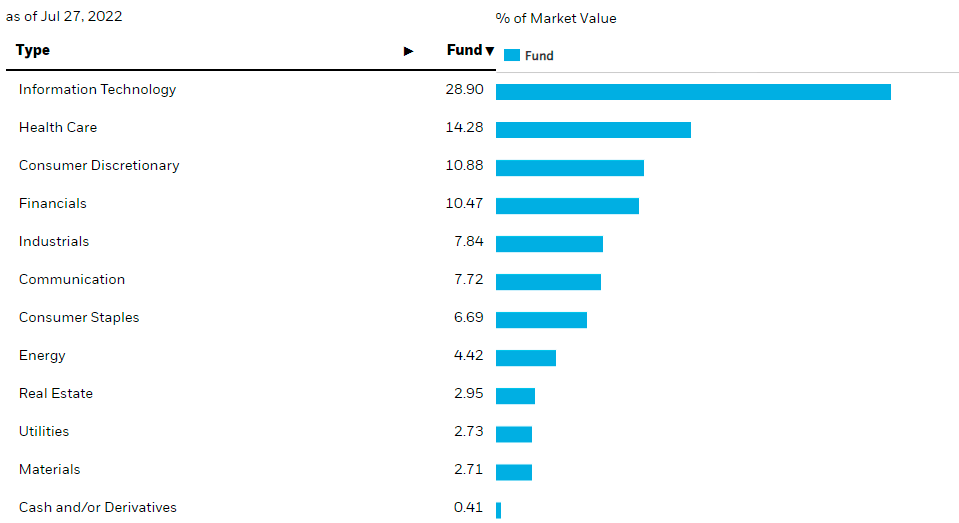
You’ll also find ESGU’s top ten holdings list almost identical to SPY, albeit with slightly different weights. Apple (AAPL) is the leading stock, followed by Microsoft (MSFT), Amazon (AMZN), Tesla (TSLA), and Alphabet (GOOGL, GOOG). These top 10 holdings total 26.07% compared to 27.72% for SPY.
iShares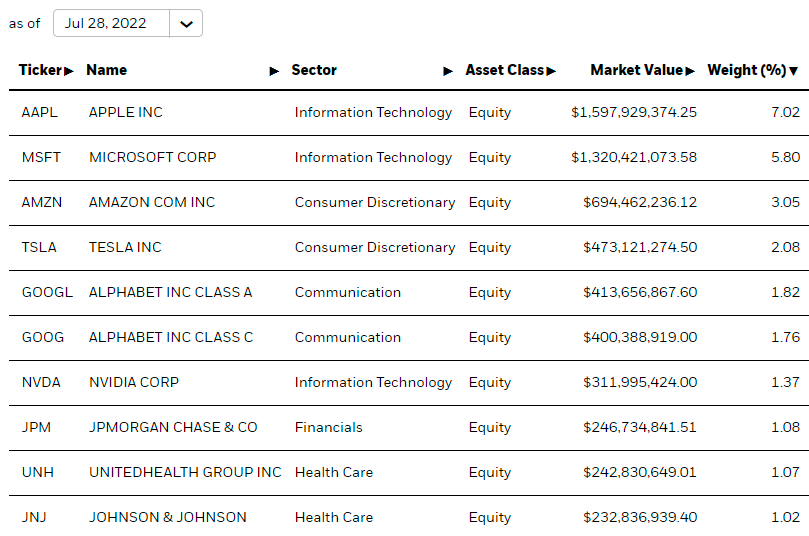
Berkshire Hathaway (BRK.B) is missing from this list, replaced by JPMorgan Chase (JPM). According to Sustainalytics, Berkshire Hathaway is a low-risk company, and JPMorgan Chase is a medium-risk company, so I’m thinking the change merely satisfies the tracking error requirement rather than any ESG-related reason. ESG rating systems often offer conflicting results, too.
ESGV Strategy and Exposures
ESGV tracks the FTSE US All Cap Choice Index, screening companies under two broad categories: product-related and conduct-related. The product-related screens are:
- Non-Renewable Energy (Fossil Fuel & Nuclear Power)
- Vice Products (Adult Entertainment, Alcohol, Gambling, Tobacco)
- Weapons (Chemical & Biological Weapons, Cluster Munitions, Anti-Personnel Landmines, Nuclear Weapons, Conventional Military Weapons, Civilian Firearms)
The conduct-related screens cover controversies based on the UN Global Compact Principles and a company’s diversity practices. The Index is market-cap-weighted, and constituents are reviewed annually for eligibility.
In my view, these screens are more strict, especially when it comes to excluding non-renewable energy stocks. As a result, ESGV’s Energy exposure is almost zero, and the difference mostly went to the Technology sector. The Industrials sector is also underweight by about 2% relative to SPY.
Vanguard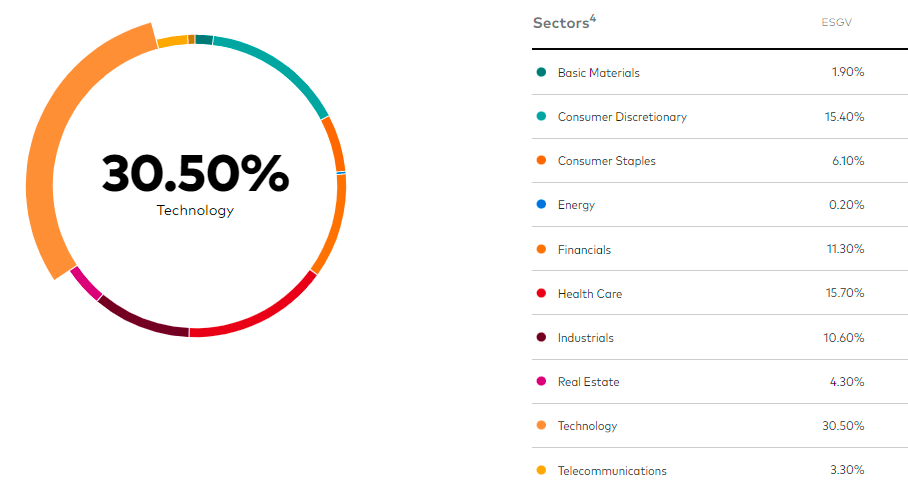
ESGV’s top holdings are below, and while there’s no change at the top of the list, Meta Platforms (META) and Procter & Gamble (PG) are included instead of Berkshire Hathaway and Johnson & Johnson (JNJ).
Vanguard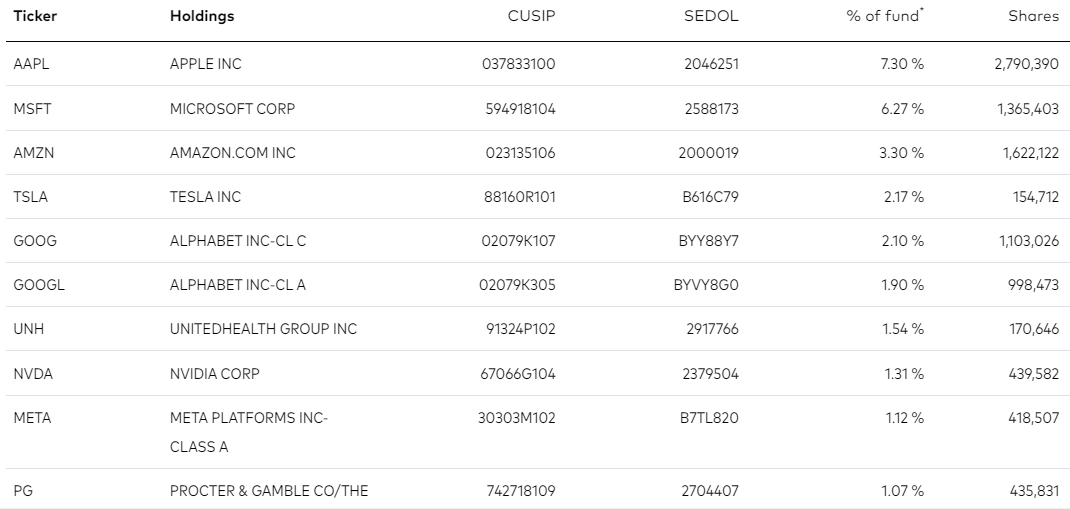
ESGV is a much larger fund with over 1,500 holdings compared with about 300 for ESGU, so it’s a better total market ETF if that’s what one desires. However, it’s worth noting that about 940 holdings in ESGV aren’t in ESGU, but their combined weight is just 23.43%. In contrast, 63 stocks are in ESGU but not ESGV, representing 15.21% of the total weight.
I’m not focused too much on these figures since most of a portfolio’s returns are driven by sector and industry exposures rather than individual stock selections. With that in mind, here are the top five industries that ESGV overweights relative to ESGU:
- Biotechnology: 3.48% vs. 2.67% = 0.81%
- Restaurants: 1.25% vs. 0.47% = 0.78%
- Interactive Media & Services: 5.41% vs. 4.64% = 0.77%
- Systems Software: 8.63% vs. 7.91% = 0.72%
- Regional Banks: 1.88% vs. 1.17% = 0.71%
And here are ESGV’s top five underweighted industries relative to ESGU:
- Integrated Oil & Gas: 0.00% vs. 1.82% = -1.82%
- Electric Utilities: 0.00% vs. 1.42% = -1.42%
- Oil & Gas Exploration & Production: 0.00% vs. 1.21% = -1.21%
- Aerospace & Defense: 0.02% vs. 1.15% = -1.13%
- Industrial Conglomerates: 0.00% vs. 1.07% = -1.07%
The underweighted securities caught my eye since Oil & Gas and Electric Utilities stocks have provided excellent downside protection in this high-inflation environment. In 2022, we’ve seen ESGU outperform ESGV by 2.46% (-14.29% vs. -16.75%), and the above pretty much explains this. I think ESG investors need to be prepared for lower returns if they decide to exclude entire sectors or industries. However, the bet is that over the long run, ESG-friendly companies will outperform.
Performance Analysis
ESGV only launched in September 2018, so we don’t have too much data to work with. However, the results so far are promising. ESGU and ESGV have gained an annualized 11.47% and 11.40% compared to 11.37% for SPY. Volatility was slightly higher, leading to inferior risk-adjusted returns (Sharpe and Sortino Ratios), but overall, they are satisfactory alternatives.
Portfolio Visualizer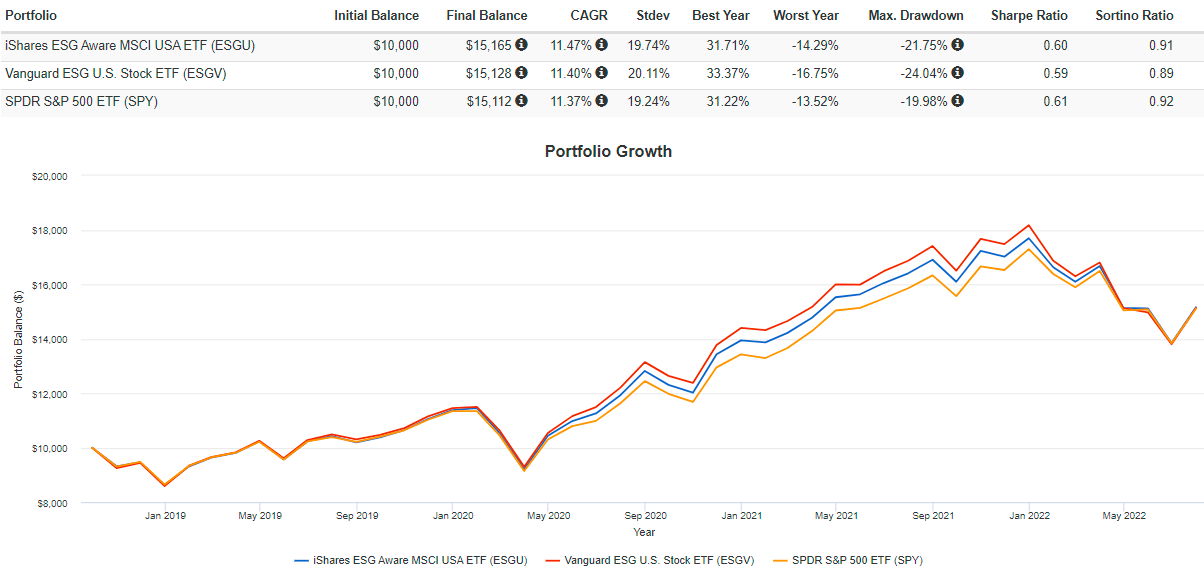
ESGU has a longer history dating back to December 2016, showing an annualized return of 0.05% better than SPY alongside similar volatility.
Portfolio Visualizer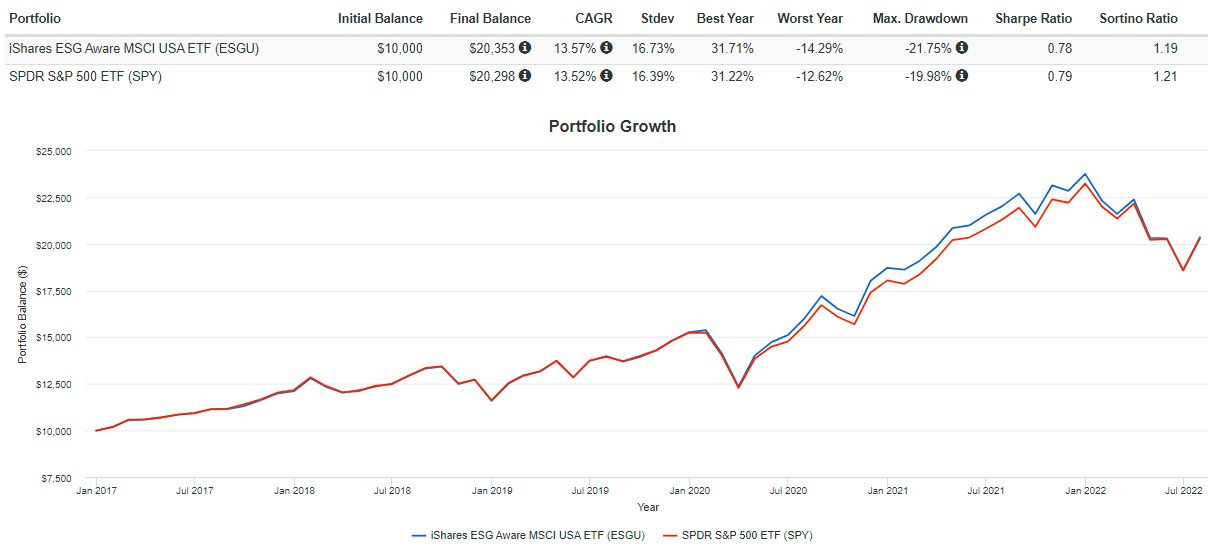
And to get a better sense of the long-term potential of ESG ETFs, we can consider the performance of the iShares MSCI USA ESG Select ETF (SUSA) dating back to February 2005.
Portfolio Visualizer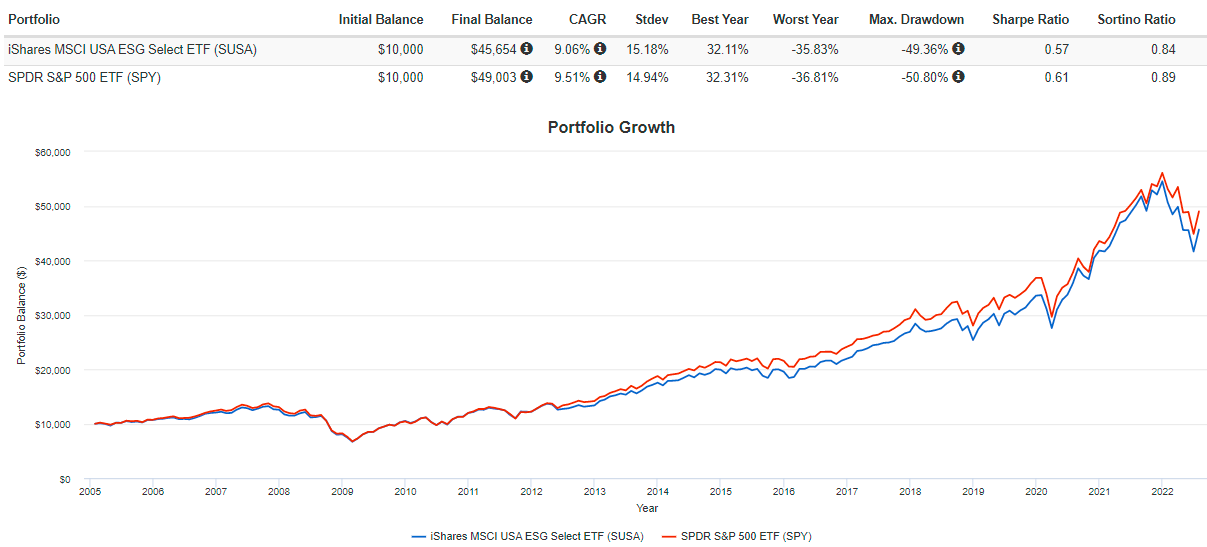
SUSA has trailed SPY by an annualized 0.45%, which adds up over the long run. However, SUSA has an expense ratio of 0.25%, which covers at least half of the difference. The remainder is likely due to the “Select” nature of SUSA. Select ESG ETFs tend to take a stronger ESG stance, while “Aware” ETFs like ESGU are much more moderate. In my view, the latter has a better chance of appealing to skeptical investors, as they don’t eliminate exposure to sectors like Energy.
Fundamental Analysis
ESGU vs. ESGV
The following table highlights selected fundamental metrics for ESGU’s top 20 industries compared with ESGV and SPY. The bolded rows at the bottom are metrics for the entire fund, and the similarities help explain why both ESG ETFs have produced nearly identical returns to SPY in recent years.
The Sunday Investor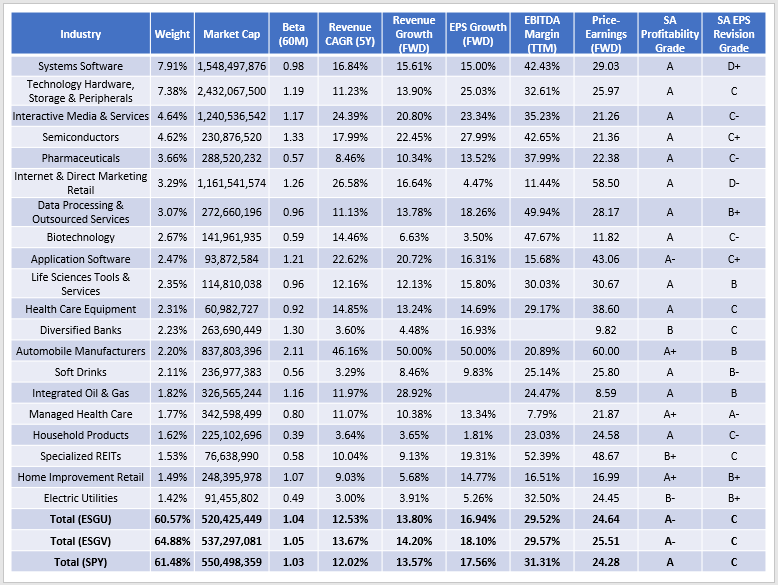
ESGU has a weighted-average market capitalization of $520 billion and a 1.04 five-year beta, making it slightly more volatile than SPY. Constituents have a better five-year revenue growth record (12.53% vs. 12.02%), and analysts are more optimistic about ESGU’s one-year revenue growth (13.80% vs. 13.57%) but less so about one-year earnings per share growth (16.94% vs. 17.56%).
ESGU trades at 24.64x forward earnings, about in line with SPY, but its weighted-average Seeking Alpha Profitability Grade isn’t as strong (A- vs. A). For me, this suggests a slightly lower quality fund. ESGU’s underweighting of Berkshire Hathaway, which has an A+ Profitability Grade, is a key driver.
ESGV vs. ESGU
Looking at ESGV’s top 20 industries, we can see that Tech is prominent. Systems Software (primarily Microsoft) is the leading industry, followed by Technology Hardware, Storage & Peripherals (Apple). Both have excellent growth prospects, but they’re also why ESGV is the most expensive of the three, with a 25.51 forward price-earnings ratio.
The Sunday Investor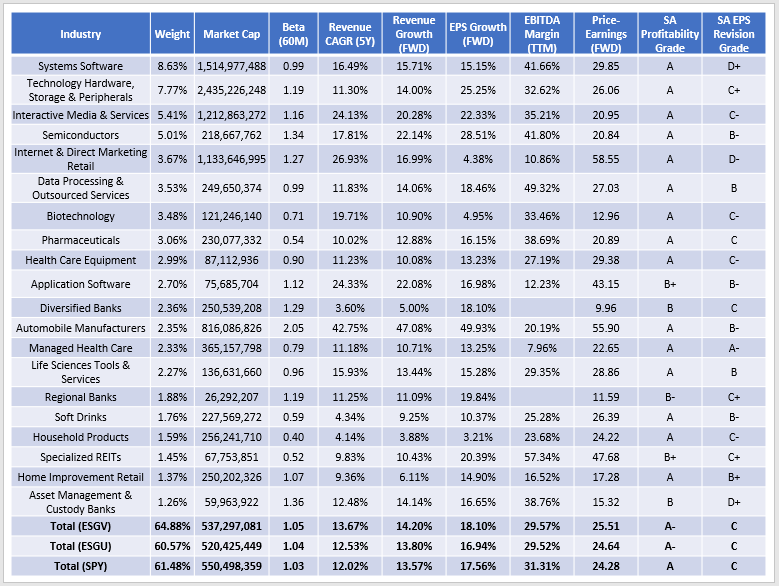
ESGV is the least diversified of the three, with 64.88% of assets in its top 20 industries. It’s also the most volatile, measured by its 1.05 five-year beta, and has the best historical and forward growth rates on sales and earnings. Finally, ESGV’s “A-” Profitability Grade implies a lower-quality ETF. Still, all three ETFs have the same “C” EPS Revision Grade from Seeking Alpha, indicating analysts aren’t very optimistic about markets these days.
Investment Recommendation
ESGU and ESGV are today’s two most popular ESG ETFs because they don’t stray too far from the broad market sector and industry exposures. ESGV is the more aggressive ESG fund, but even its exposure differences are minimal. Energy, for example, is only 4.13% of the S&P 500 Index, so even eliminating Energy stocks isn’t going to make much difference over the long run.
If ESG investing makes you feel better about yourself, start with ESGU. You’re unlikely to sacrifice much, if any, performance, given its model’s constraints when optimizing the portfolio. ESGV will also work if you’re intent on eliminating Energy from your portfolio but prepare for underperformance should inflation continue to run hot. Reducing the stock universe isn’t my approach, so I won’t be buying either of them. Still, I hope this article helped you understand the different types of ESG ETFs available, and I’m happy to answer any questions in the comments section below.
Be the first to comment