

DKosig
Written by Nick Ackerman, co-produced by Stanford Chemist. This article was originally published to members of the CEF/ETF Income Laboratory on July 5th, 2022.
Allspring Utilities and High Income Fund (NYSE:ERH) is a closed-end fund we’ve touched on in the past. However, it was when it was still branded under the Wells Fargo name. After Wells Fargo (WFC) sold off their asset management division, it rebranded to Allspring. They then followed this up by, of course, renaming the traditional mutual funds and CEFs by dropping the WFC name. The new names were effective as of December 6th, 2021. There was no investment policy or objective change through this rebranding.
The more unusual focus on utilities and high yield makes this more of a unique fund in the CEF space. A space that can get rather niche, as actively managed funds can get rather distinctive in their investment approach already. I believe that Virtus Total Return Fund (ZTR) is a somewhat similar fund but not a perfect match. I’ll be using some comparisons throughout this article between the two.
One reason to revisit ERH at this time is that in my previous article, the fund was quite expensive on the basis of its historical valuation. In this case, being a CEF, we are looking at relative historical premium/discounts. Now we are sitting right below its average historical discount, meaning that it could be worth investing for some investors.
Since that previous update, the fund’s total returns have been negative. However, most of that has been due to its discount expansion or, more accurately, in this situation, a premium decline.
ERH Performance Since Last Coverage (Allspring)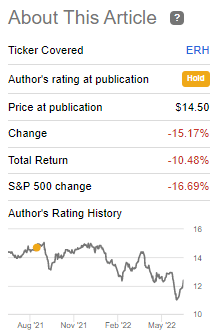
The Basics
- 1-Year Z-score: -1.25
- Discount: 2.13%
- Distribution Yield: 7.38%
- Expense Ratio: 1.09%
- Leverage: 20.3%
- Managed Assets: $147.613 million
- Structure: Perpetual
ERH’s investment objective is “a high level of current income and moderate capital growth, with an emphasis on providing tax-advantaged dividend income.”
To achieve this objective, the fund will simply invest “approximately 70% of its total assets to a sleeve that places a focus on common, preferred and convertible preferred stocks of utility companies and approximately 30% of its total assets to a sleeve of U.S. dollar-denominated below investment grade (high yield) debt.”
The small size of the fund is quite interesting here because the expense ratio is still reasonable. In the CEF space, it’s actually on the lower end. When including its leverage expense, we come to 1.27%. The fund uses a fairly modest amount of leverage.
That being said, they’ve increased their leverage again with the latest report. This is noteworthy because, in the previous update, we had noted they increased their leverage too. This latest report was for the last six months ended February 28th, 2022. Unfortunately, that would indicate that the prices were higher than they are now as the market sold off, meaning ill-timed additions to the portfolio. Easy to say for me in hindsight, though.
The small size of the fund is negative. It generally means that even for retail investors, it can be somewhat limiting when trying to put through large buys or sells. The average volume comes to just ~24k per day.
Their leverage is based on a rate of LIBOR plus 0.70%, as most CEF leverage is. That means with higher rates comes higher leverage costs. With increasing leverage also comes with higher leverage costs. This rate will be renegotiated as LIBOR is being discontinued.
Performance – Discount Showing Up
The historical performance of the fund has been fair. Here is a look at the annualized returns as of March 31st, 2022. Since that time, the fund has been moving lower, so the results we see here would also be a bit lower.
ERH Annualized Returns (Allspring)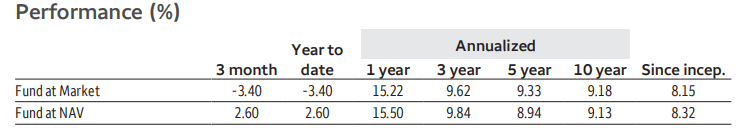
When compared to ZTR, we can see that they track somewhat similarly over the last decade. That’s interesting to note because ZTR isn’t a perfect match. ZTR has a fixed-income sleeve just as ERH does, but it isn’t purely looking at high yield. Instead, it also incorporates investment-grade debt.
On a side note, ZTR had authorized a rights offering earlier this year. I haven’t yet seen an official announcement. That will likely negatively impact the fund in the short term.
Ycharts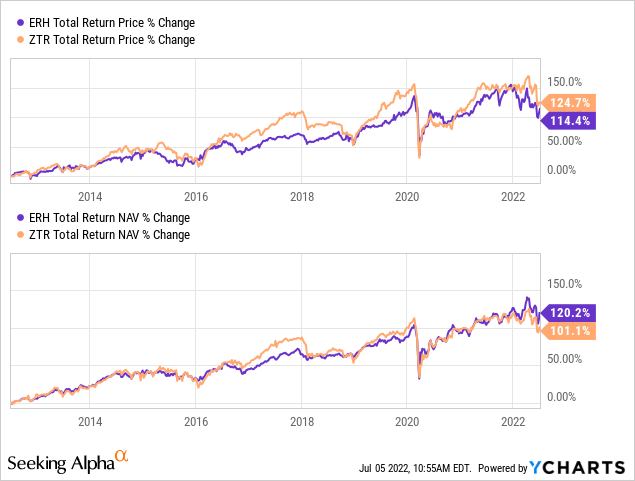
What makes ERH more of a tempting play here is a discount has shown up. It also slightly trades less than ZTR’s current discount. We are slightly below the historical average discount of the last decade.
Ycharts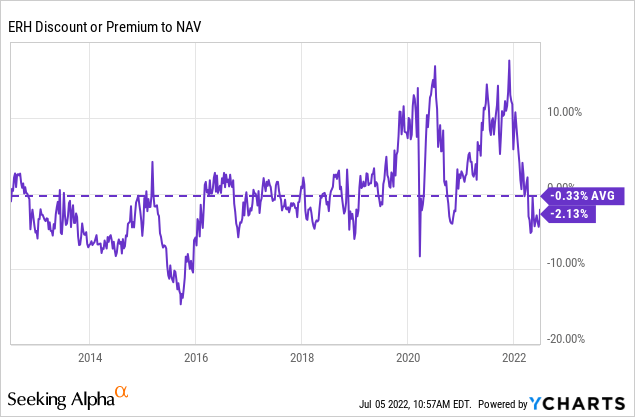
I think that makes it attractive, but not really entering into a buy territory yet. On the other hand, when we last looked at the fund, it had an over 9% premium, which was quite unusual.
Distribution – Managed Distribution Plan
The Allspring transition saw the fund’s distribution policies remain in place. For ERH, that means they pay a minimum fixed rate of 7% for the year. The way this works is they take the average monthly NAV per share from the prior 12 months and divide it by 12. This means that as the NAV rises, we will see the distribution increase. As it lowers, we will see the opposite, with the monthly distribution decreasing.
ERH Distribution (CEFConnect)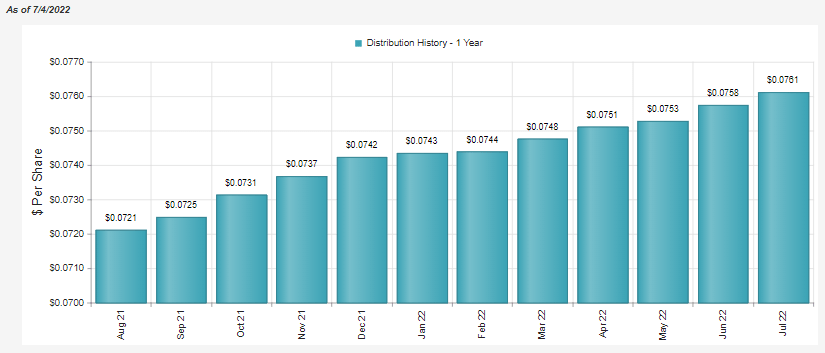
Given the 12-month span, there will be a lag in seeing distribution changes. So while the fund’s NAV has been slipping now over the last few months, the distribution is still increasing because of the higher NAVs reported from August through April, when the NAV was trending higher. The latest declines haven’t necessarily been reflected in this yet.
Ycharts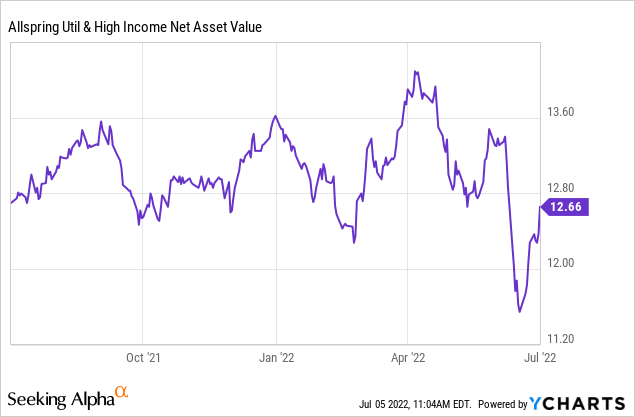
One thing that will help keep the fund relatively steady is the utility and high yield bond exposure. That should see a higher amount of dividends and interest coming in. For CEFs, we would be looking at the net investment income [NII]. This is the total investment income received minus the expenses of the fund.
ERH Semi-Annual Report (Allspring)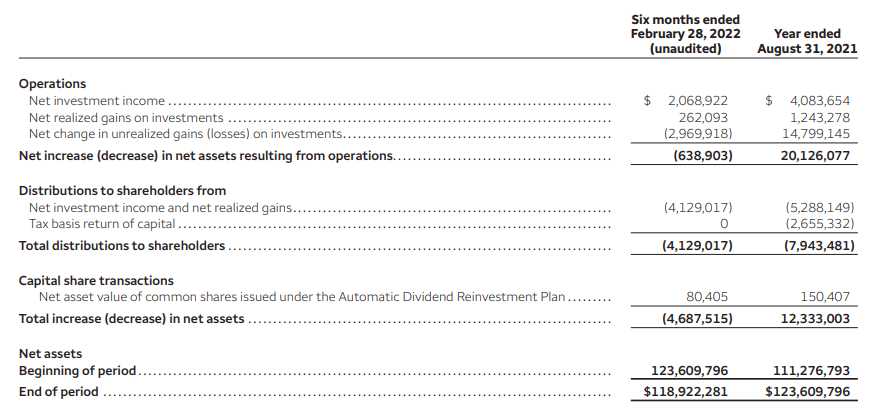
The NII coverage here comes to 50%. While that sounds low, for a fund that has a meaningful allocation to equities, it’s actually not as bad as it might first appear.
To compare to ZTR again, that fund’s NII coverage comes to around 23% as of their last fiscal year-end. However, a higher yield overall is a big factor in the lack of coverage.
The tax character of the distributions for ERH has had a meaningful portion identified as ordinary income. Unfortunately, I wasn’t able to find if any of this was considered qualified dividends or not. Additionally, the fund has, in the last two years, classified a meaningful portion as a return of capital as well.
ERH Annual Report (Allspring)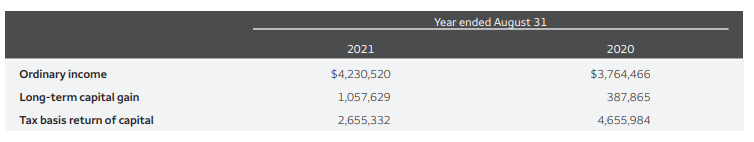
For 2021, it wouldn’t have been considered destructive return of capital as the fund’s NAV rose. In 2020, some of this could have technically been considered destructive ROC. The NAV in 2020 went from $13.01 to $12.58.
ERH’s Portfolio
The data discussed here were from their Q1 Fact Sheet. At that time, the fund’s allocation was heaviest in equity. That would be the utility exposure of the fund.
ERH Asset Allocation (Allspring)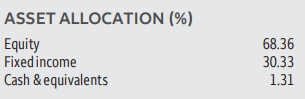
This was split among 345 positions. That’s a rather large number of positions but relatively normal for high-yield funds. Infrastructure/utility CEFs tend to be more concentrated in a fewer number of holdings. We will see that the top ten of ERH are rather concentrated at the top. The approach for high yield funds is the “buckshot” approach. Invest in everything, so when a default happens, it only has a minimal impact.
The fund’s credit quality is exactly where we would expect it to be within the junk ratings of BB and B debt. This would be for the fixed-income sleeve of the portfolio.
ERH Credit Quality (Allspring)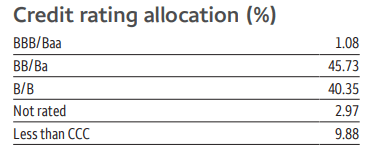
The fund is concentrated in U.S. positions, with just over 95% allocation in the country. That leaves any other exposure to other countries rather meaningless.
For sector exposure, we also see a high concentration in utilities – as we would expect. The fixed income allocations are a bit more diversified. That highlights again the buckshot approach of investing across various companies over many sectors to attempt to protect the downside.
ERH Sector Allocations (Allspring)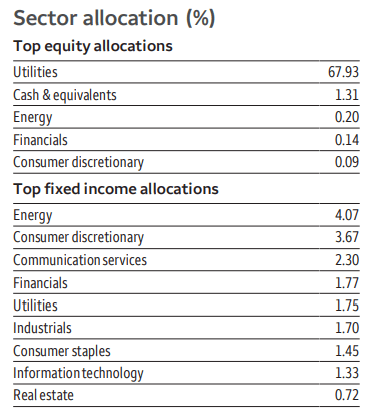
Taking a look at the latest top ten, we are provided with those holdings as of the end of May 2022. A more recent list compared to the data provided above.
ERH Top Ten (Allspring)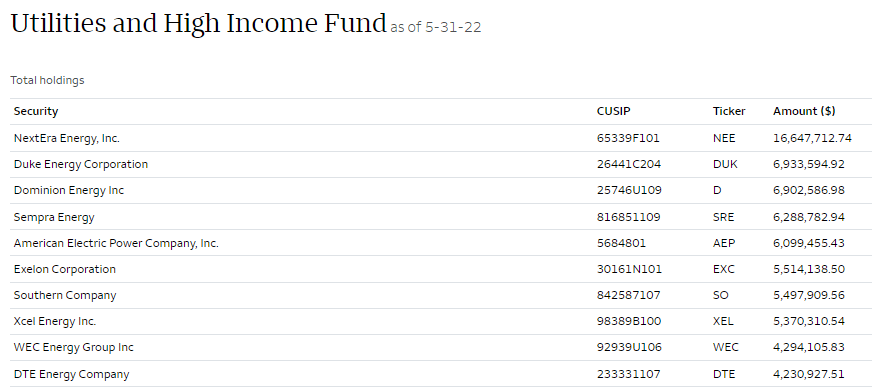
The largest position here is NextEra Energy (NEE) by a significant margin. I hold a position in NEE personally, as well as WEC Energy (WEC) and DTE Energy (DTE). So the managers here obviously have some good taste when it comes to selecting utility names.
NEE is basically a staple in most utility and infrastructure funds. If it isn’t a top position, it’s generally a top ten or, at a minimum, somewhere in the portfolio. That is either the equity shares or one of the equity unit investments. With around $147.6 million in AUM, NEE comes to a significant ~11.3% allocation for ERH.
Over the last decade, that has really been a smart move as NEE has blown away the performance of the SPDR Utility Sector ETF (XLU).
Ycharts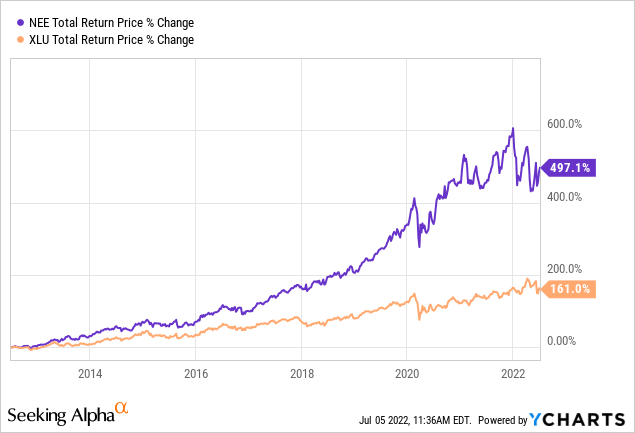
On a YTD basis, it certainly has been shakier as NEE’s valuation gets reassessed. Admittedly, we are looking at a utility stock that is more on the expensive side. The other side of the argument, though, is that they just recently increased EPS expectations. As they continue to grow, higher share prices should be in the future, or they can grow into the valuation.
Ycharts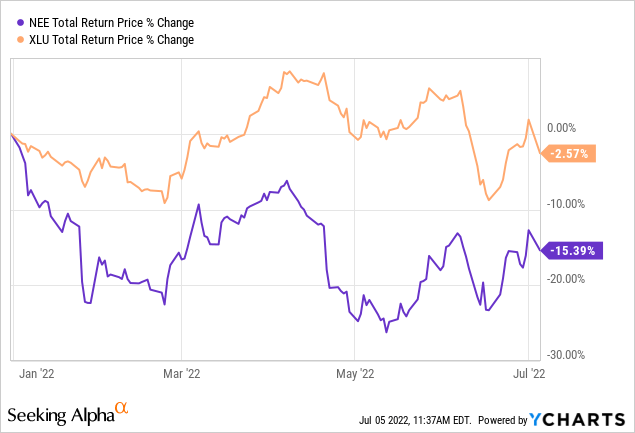
The top ten overall makeup around 46% of the fund, given the capital invested listed above and the $147.6 million AUM. Therefore, the other 335 positions in the fund are rather small relative to the top ten.
Conclusion
ERH is a more interesting name now that its valuation has come down. It isn’t necessarily a buy yet but is certainly more attractive than where we were. The fund’s heavy exposure to utilities and high yield is attractive as a steady cash stream comes into the fund via dividends and interest. The high yield exposure has credit risks heading into a slowdown. However, the diversification and the sheer number of holdings can help diversify some risks. It’s also the smaller allocation of the fund that further limits the potential risks here.
Be the first to comment