

monsitj
The month of September is living up to its reputation as one of the worst-performing months during a year. In just the past two weeks alone the S&P 500 Index is down 9.53%. The equity market weakness has pushed the S&P 500 Index down to a level that is testing the June 16 closing low of 3,666 with Friday’s close at 3,693.
This brings the year to date return for the S&P 500 Index to -22.51% on a price-only basis. Recent weakness has come on the back of the Fed raising the Fed Funds rate by another 75 basis points or .75% last week.
The rate increases are the Fed’s attempt to rein in inflation. As a recent strategist stated though,
“Powell runs the Fed like I play golf. He crushes his driver but has no feel around the greens…He realizes he was too loose last year and he is over-steering the economy into a ditch. He’s 50 yards out from the pin and rather than grabbing his lob wedge [to] stick it next to the pin, he’s pulling out his driver and pounding it 200 yards past the hole.”
The point in the comment is the Fed may be moving too quickly on rate hikes and not giving prior rate increases sufficient time to achieve the Fed’s desired result.
The potential outcome is a Fed error that pushes rates higher too quickly and tips the economy into a recession, keeping in mind first and second quarter GDP were negative already. In short though, inflation is a problem and needs to be brought under control, but a thoughtful hiking path is important.
The market pullback in both stocks and bonds has resulted in individual investor sentiment turning bearish on the market outlook looking forward. The past week’s Sentiment Survey published by the American Association of Individual Investors (AAII) has bullish sentiment at a low 17.7% as seen in the below chart.
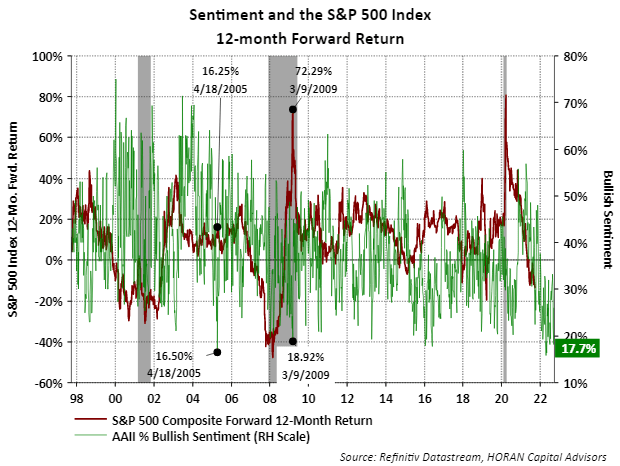
Sentiment measures are contrarian ones, and a low bullish reading by individuals is considered a bullish measure for equities. The maroon line on the above chart shows the forward 12-month return for the S&P 500 Index at various bullish sentiment levels. At low bullish sentiment levels, the 12-month return for the S&P 500 Index tends to be some of its strongest.
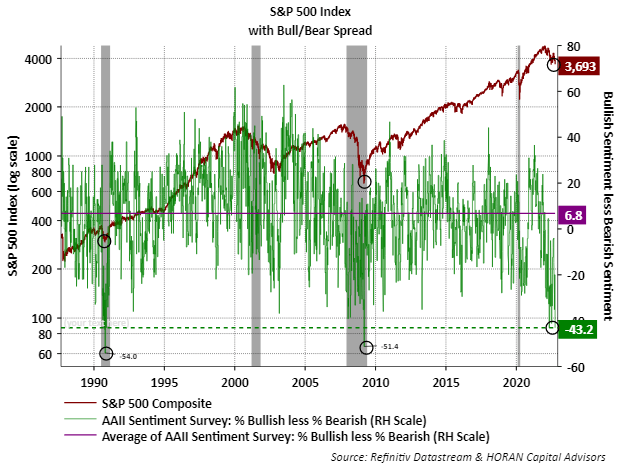
The next chart below shows the bull bear spread equaled 43.2 this past week and has only been lower two other times since the inception of the AAII sentiment survey in 1987. The other two low points occurred near market bottoms.
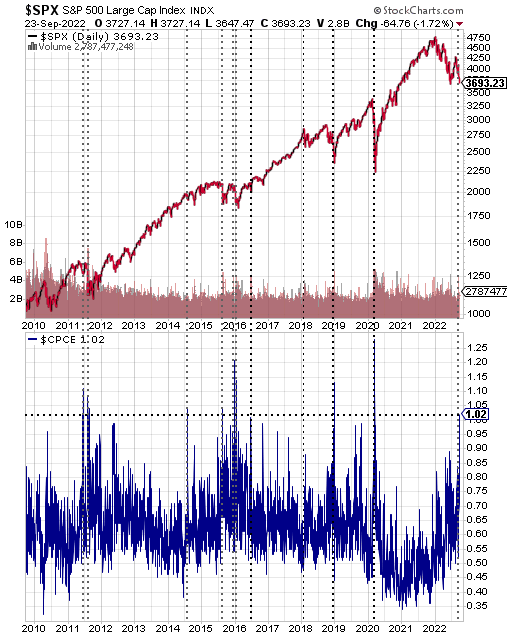
And lastly, the CBOE equity put/call ratio spiked above 1.0 on Friday. Levels above 1.0 signal overly bearish sentiment by investors. Additional commentary can be read in an earlier post I wrote.
In conclusion, a large amount of the sentiment data is pointing to a bearish investor and historically this has occurred near market lows. At the time of this writing though S&P 500 futures Monday morning are down 28 points or .76%.
The equity market does not move higher in a straight line; however, any positive market news in an environment with bearish investor sentiment, could be a catalyst for a move higher in stocks.
It probably goes without saying the risk at the moment is the Fed’s tighter monetary action removes the punch bowl too quickly in its effort to have an economic environment in place that results in inflation coming down.
Editor’s Note: The summary bullets for this article were chosen by Seeking Alpha editors.
Be the first to comment