

arild lilleboe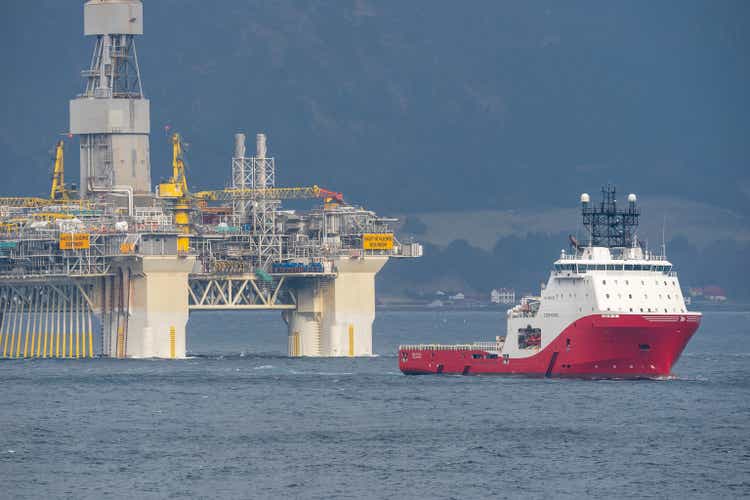
Introduction
The Norwegian-based Equinor ASA (NYSE:EQNR) reported its first quarter 2022 results on May 4, 2022.
Note: This article is an update of my article published on April 12, 2022. I have followed EQNR on Seeking Alpha since January 2017.
1 – 1Q22 result Snapshot
Equinor reported strong first-quarter results. The company said Russia’s invasion of Ukraine led to uncertainty in already tight European energy markets, especially in gas, sending energy prices sky high this quarter.
Equinor generated a whopping $13.59 billion in generic free cash flow this quarter, and revenues were $36.39 billion, more than double the revenues of 1Q21.
The company realized a financial windfall from an unprecedented surge in European gas prices due to the lack of gas supply to compensate for production from Russia.
Russia was Europe’s largest natural gas supplier, shipping about 40% of the continent’s supplies by pipeline. However, recently Gazprom shut down the Nord Stream 1 pipeline — the European Union’s most significant gas pipeline for annual maintenance.
Some fear the Kremlin could use planned maintenance works to turn off the taps for good. The summer maintenance activities on the pipeline, which runs under the Baltic Sea from Russia to Germany, are scheduled to take place from July 11 through to July 21.
After posting significant revenues and cash flow, Equinor proposed a second tranche of the share buyback program of $1.33 billion this quarter.
Also, due to the increase in commodity prices and ongoing recovery, Equinor’s Board of Directors proposed a quarterly dividend of $0.20 per share and added an extra $0.20 per share in 1Q22.
The integrated company is primarily an oil and gas producer with a robust crude oil segment, as we can see below:
EQNR Quarterly revenues per segment 4Q21 versus 1Q22 (Fun Trading) 2 – EQNR compared to its peers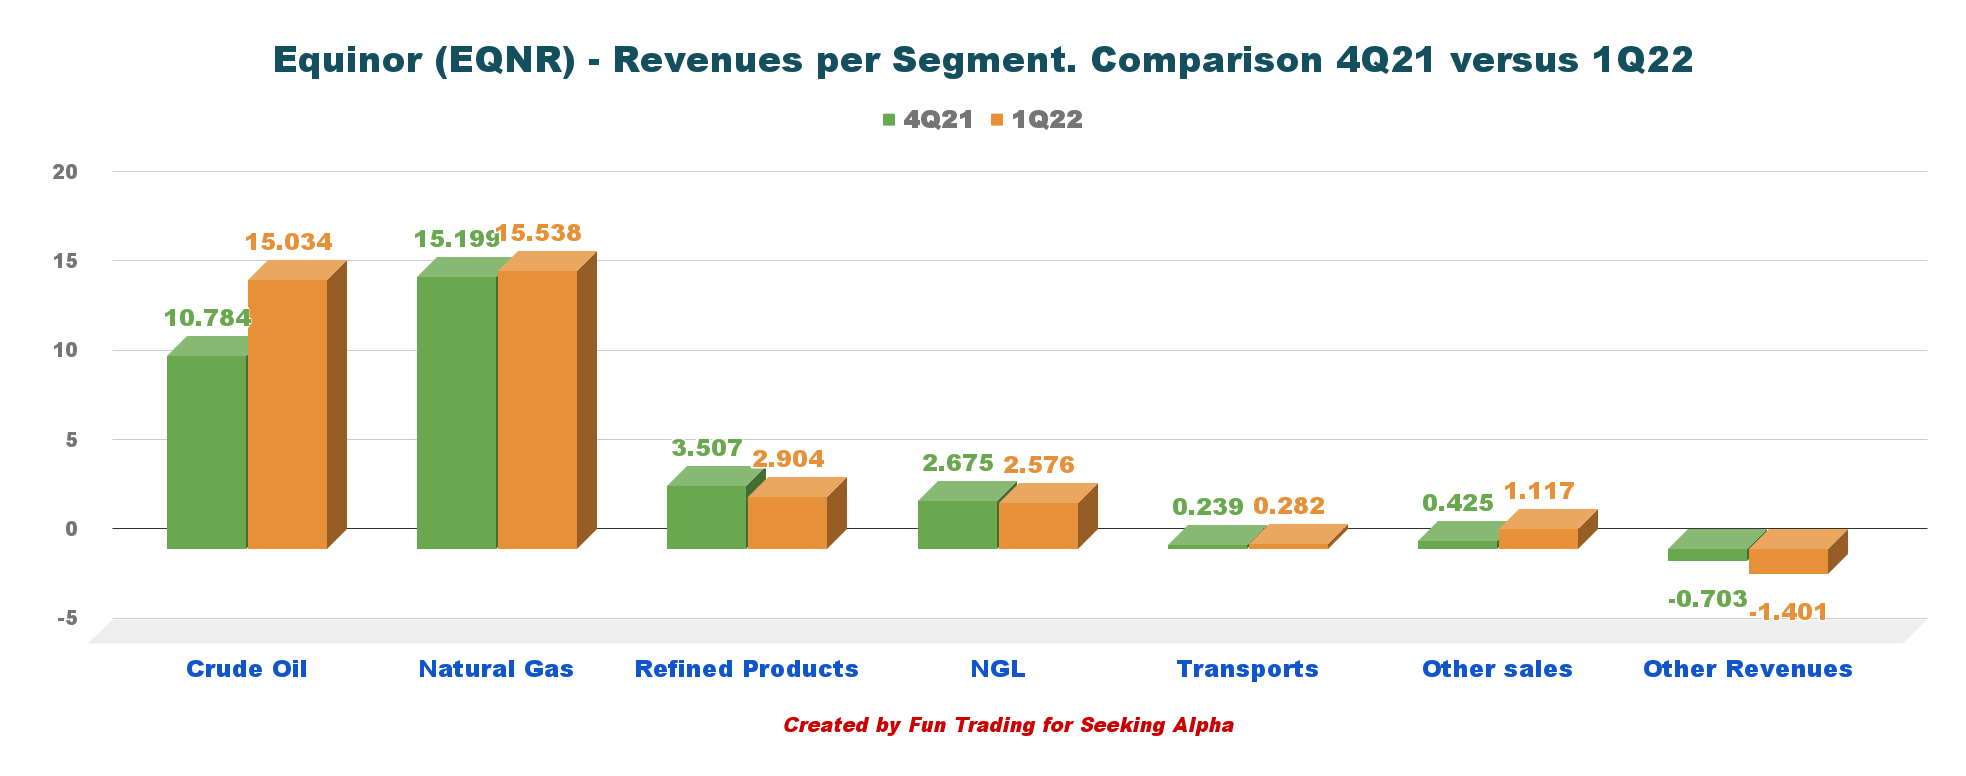
Equinor is one of the smallest in market cap amongst its peers and pays a small dividend with a withholding tax of 25%, limiting its attractiveness for dividend-oriented investors. However, with the extra $0.20 per share, the dividend yield is now 4.64%.
EQNR Dividend comparison (Fun Trading)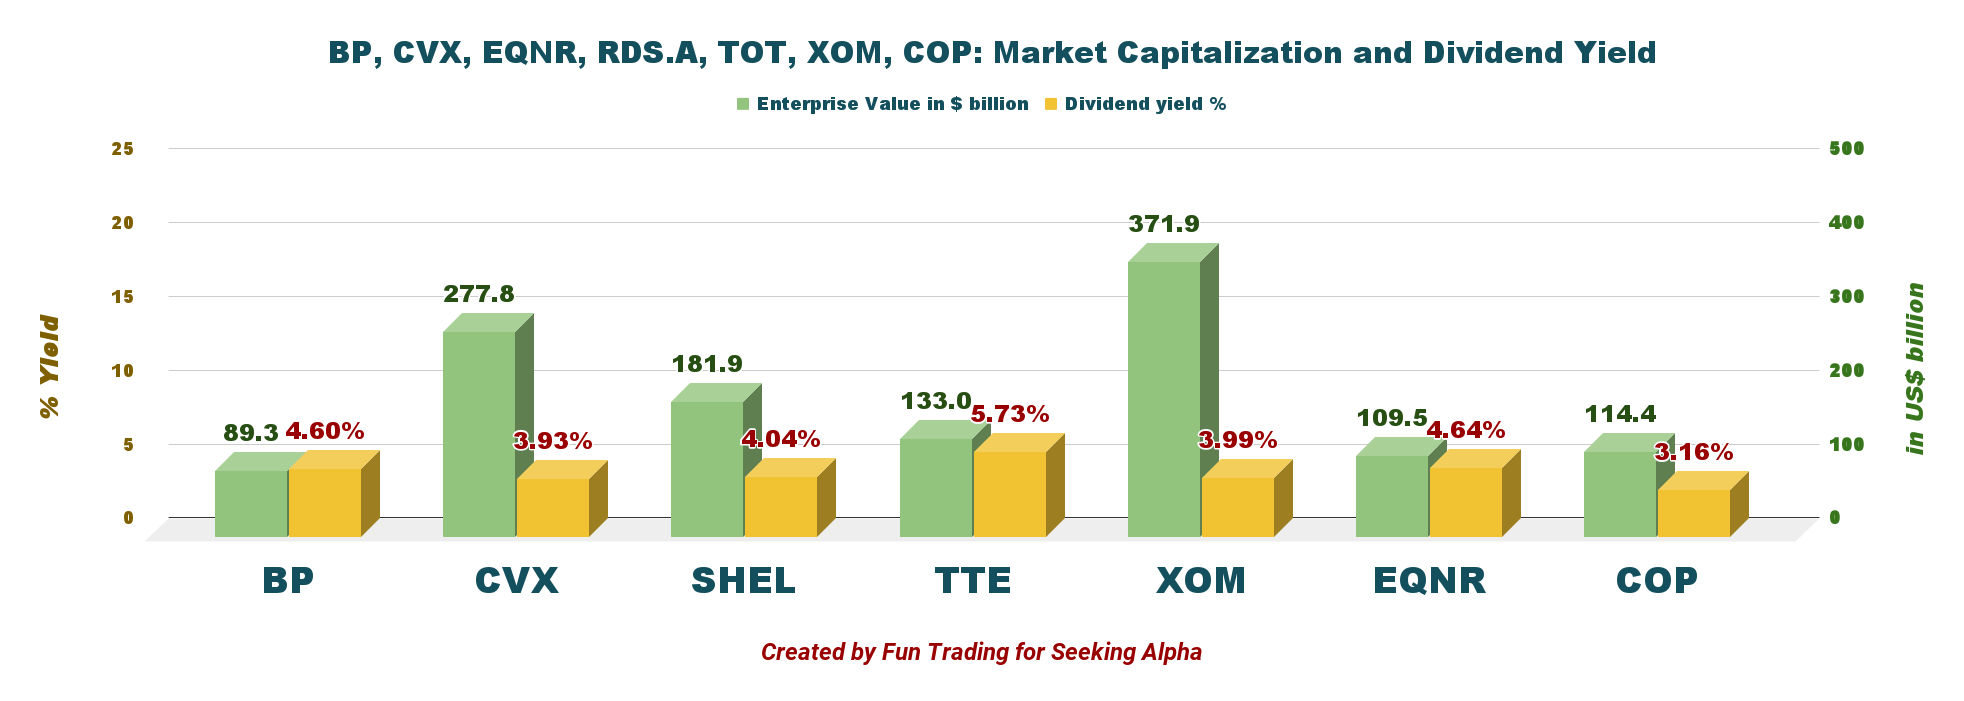
Equinor decided to exit Russia following BP, SHEL, and TTE. CFO Ulrica Fearn said in the conference call:
In the first quarter, we do demonstrate our ability to put our ambitions into action. However, the background of the results reflect the dark realities of a war in Europe, adding to an already tight and volatile energy market. We acted decisively after the Russian invasion, announcing the plan for exiting our Russian assets just 3 days later. After 30 years in Russia, it’s no longer possible for us to operate in the country.
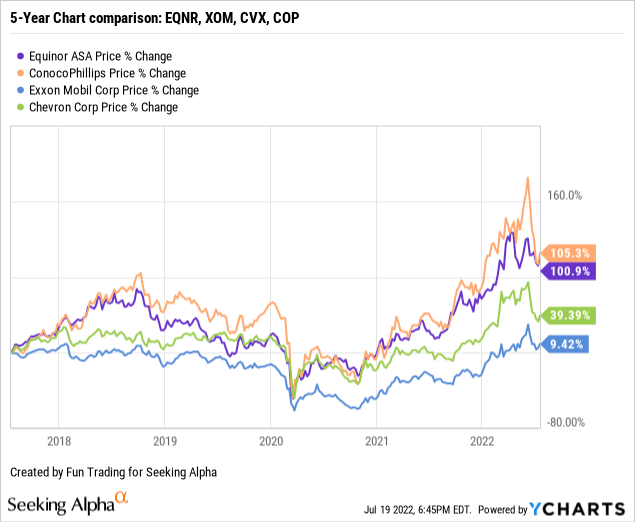
3 – Stock Performance
EQNR’s long-term performance shows that it outperforms its US peers with a 100% increase over the past five years.
Balance Sheet And Production 1Q22: The Raw Numbers
| Equinor | 1Q21 | 2Q21 | 3Q21 | 4Q21 | 1Q22 |
| Revenues in $ billion | 16.13 | 17.38 | 23.11 | 32.13 | 36.05 |
| Total Revenues and others in $ billion | 17.59 | 17.46 | 23.26 | 32.61 | 36.39 |
| Net Income in $ million | 1,851 | 1,938 | 1,406 | 3,368 | 4,710 |
| EBITDA $ billion | 7.622 | 7.320 | 11.37 | 17.76 | 19.51 |
| EPS diluted in $/share | 0.57 | 0.60 | 0.43 | 1.03 | 1.46 |
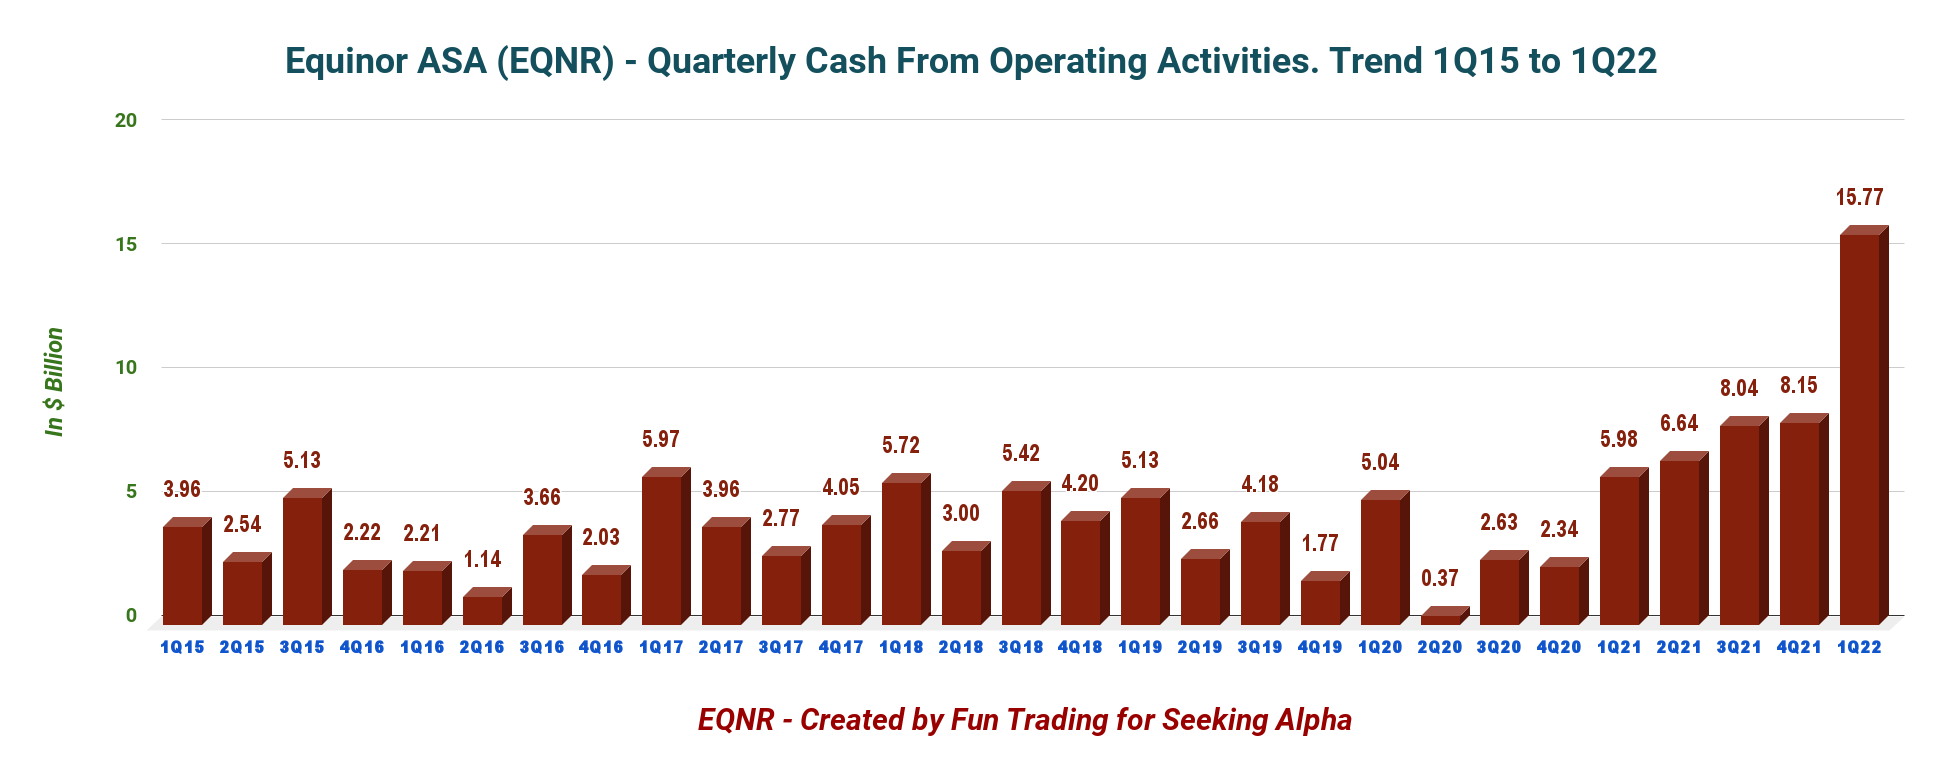
| Cash from operating activities in $ billion | 5.98 | 6.64 | 8.04 | 8.15 | 15.77 |
| Capital Expenditure in $ billion | 2.15 | 1.75 | 1.92 | 2.23 | 2.18 |
| Free Cash Flow in $ billion | 3.83 | 4.90 | 6.12 | 5.93 | 13.59 |
| Total cash $ billion | 19.91 | 25.06 | 28.85 | 33.28 | 44.57 |
| Long-term debt (+liabilities) in $ billion | 34.91 | 35.48 | 30.80 | 32.68 | 30.47 |
| Dividend per share in $ per share | 0.15 | 0.18 | 0.18 | 0.20 (+0.20) | 0.20 (+0.20) |
| Shares outstanding (diluted) in billion | 3.256 | 3.257 | 3.255 | 3.249 | 3.237 |
| Oil Production | 1Q21 | 2Q21 | 3Q21 | 4Q21 | 1Q22 |
| Oil Equivalent Production in K Boepd | 2,168 | 1,997 | 1,994 | 2,158 | 2,106 |
| Group average oil price ($/b) | 56.4 | 63.7 | 69.2 | 75.9 | 97.1 |
Courtesy: Company 2021 Press release
Financials: Revenues, Free Cash Flow, Debt, And Production
1 – Revenues and others were $36.39 billion in 1Q22
EQNR Quarterly Revenues history (Fun Trading) EQNR reported the first quarter of 2022 on May 4, 2022. Revenues and others were $36.39 billion, up from $17.59 billion in the same quarter a year ago and up 11.6% sequentially (please look at the graph above).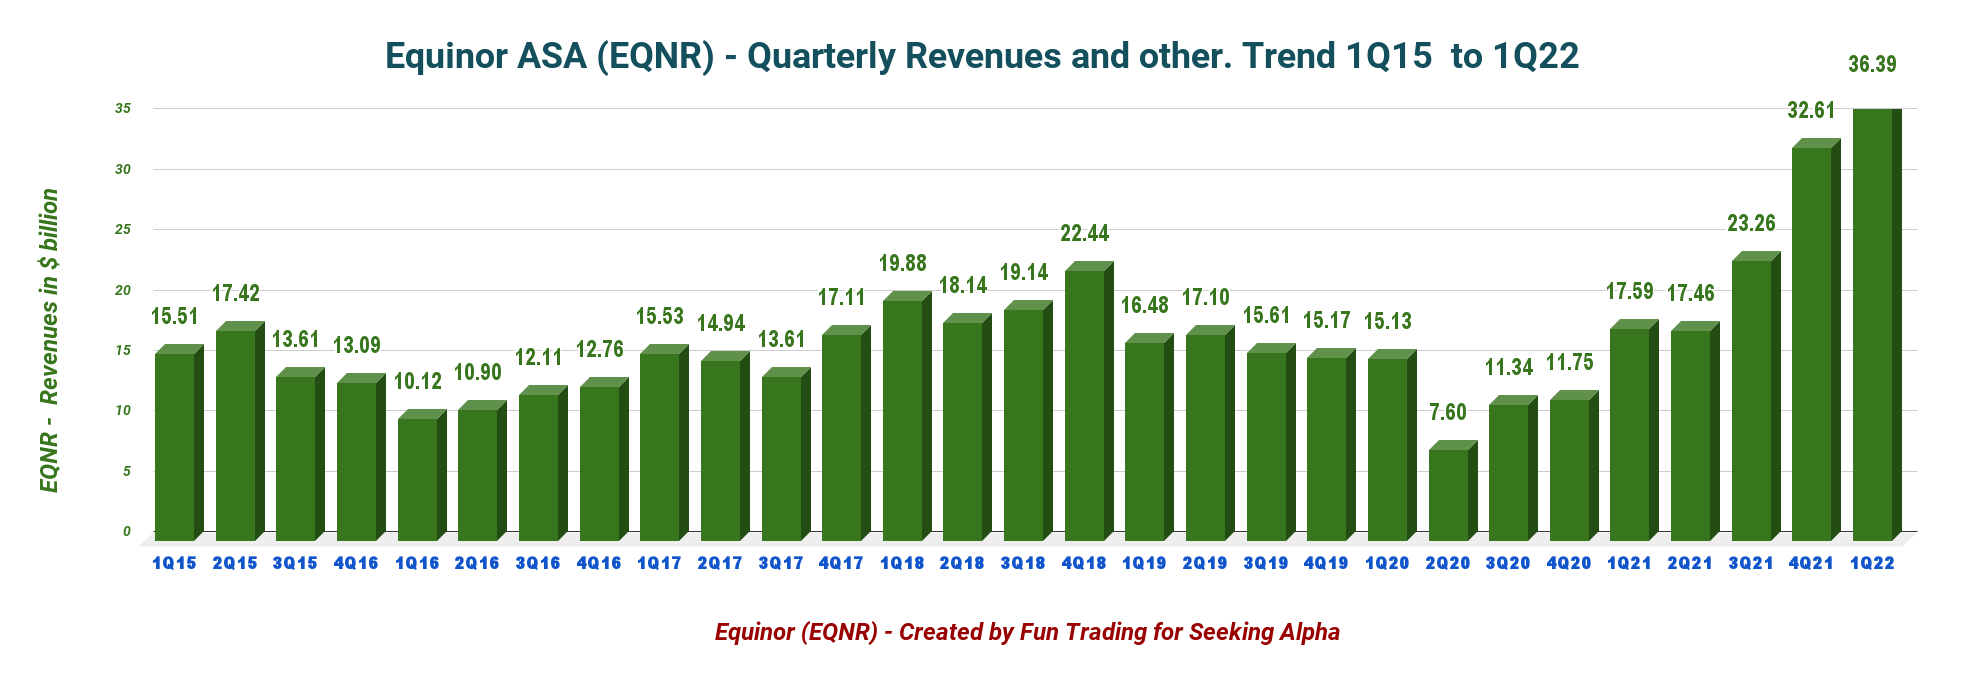
Net income was $4,710 million, or $1.46 per diluted share, up from $0.57 per diluted share in the same quarter last year.
Higher prices for liquids boosted the earnings this quarter. Details per segment are presented below:
EQNR Adjusted Earnings per segment Presentation (Equinor) 1.1 – Exploration & Production Norway (E&P Norway)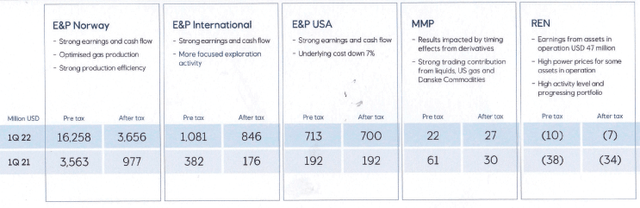
The adjusted earnings were $16,258 million, up from a profit of $3,563 million last year. This year’s increase was due to higher production and liquid prices. The company’s average daily liquids and gas production decreased 3.8% yearly to 1,436K Boepd.
EQNR Production Presentation (Equinor)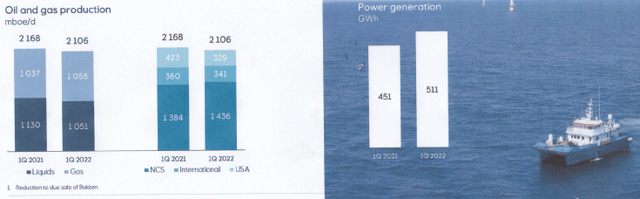
1.2 – E&P International
The adjusted operating profit was $1,081 million, compared to the year-ago quarter of $382 million. Liquids and gas prices boosted upstream activities. The company’s average daily equity production of liquids and gas decreased slightly to 341K Boepd from 360K Boepd last year.
Note: On February 28, 2022, Equinor announced that it started exiting its Russian JV.
The Russian exit resulted in a non-cash impairment of $1.1 billion.
1.3 – E&P USA
The adjusted quarterly income was $713 million, compared to $192 million last year. Oil and price contributed to the outperformance. More potent liquids and gas prices were helping.
Equinor’s average equity production of liquids and gas was 203K Boepd, down from 254K Boepd last year due to the divestment of unconventional U.S. onshore assets.
1.4 – Marketing, Midstream & Processing (“MMP”)
The adjusted earnings were $22 million, down from $61 million a year ago.
1.5 – Renewables
The segment’s adjusted loss was $10 million from a loss of $38 million a year ago.
1.6 – 1Q22 oil and gas prices realized
Equinor’s realized price for liquids was $97.1 per barrel during the first quarter of 2022. The price realized increased significantly from last year’s $56.4.
The average European invoiced gas price in the first quarter was $29.60 per million Btu for Europe ($6.65 last year) and $4.62 for North America. It was a massive improvement from a year ago.
EQNR Quarterly group average price liquids history (Fun Trading) Cash from operating activities was a new record of $15.77 billion in 1Q22. EQNR Quarterly Cash flow from operations history (Fun Trading) 2 – 2022 Guidance and Outlook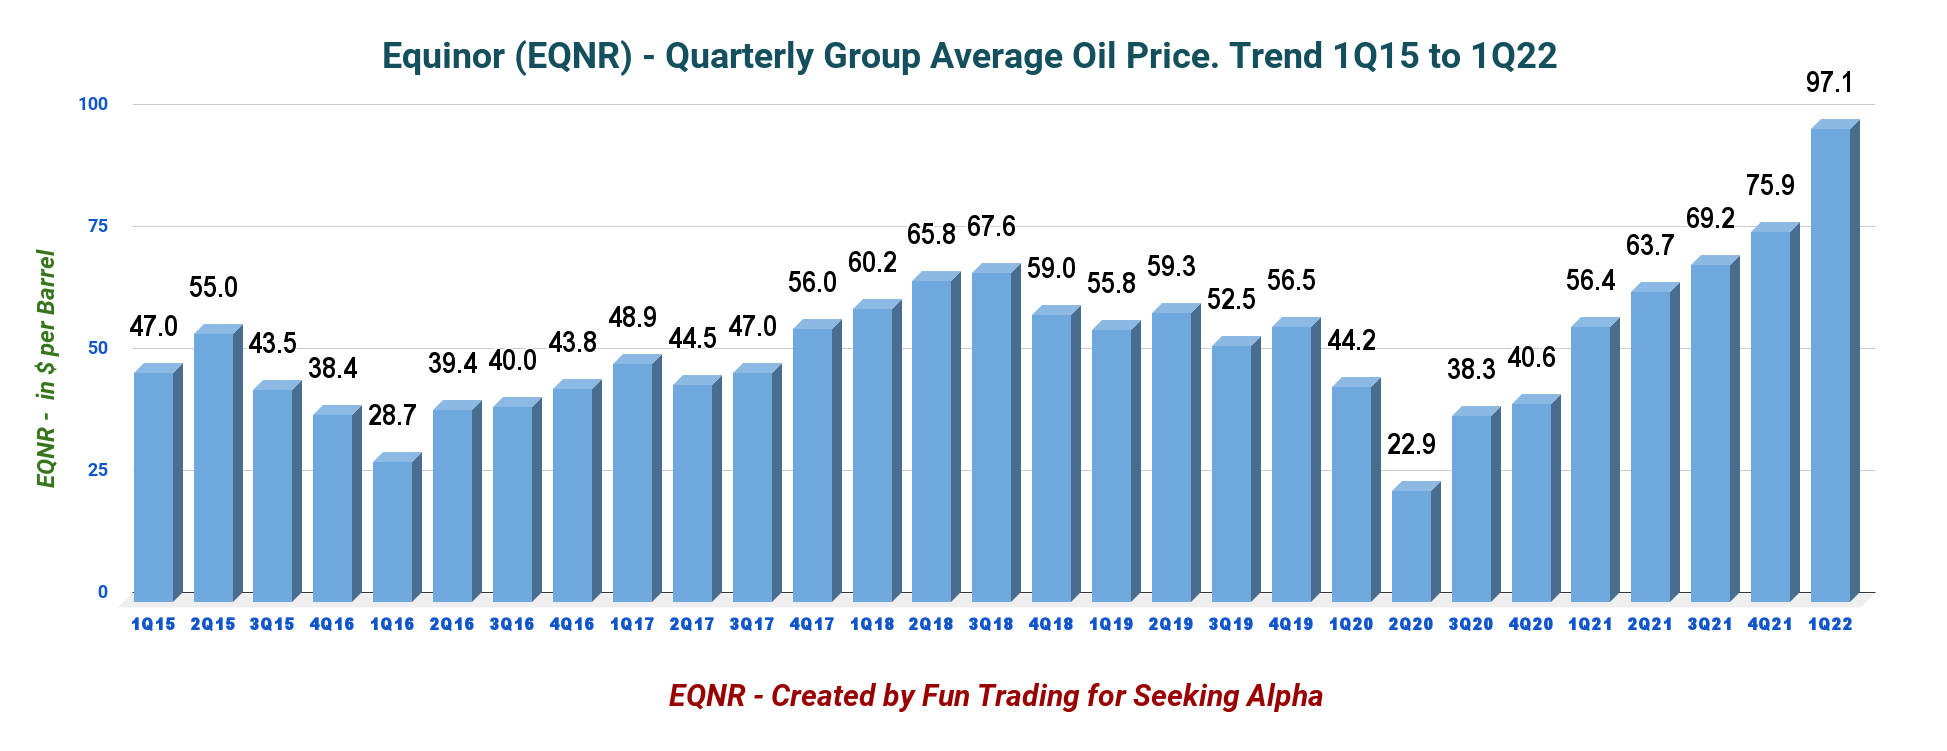
Organic CapEx is estimated at an annual average of $10 billion for 2022-2023, increasing to $12 billion in 2024-2025.
Equinor reaffirmed production growth expectations at 2% for 2022.
EQNR Outlook (Equinor) 3 – Free Cash Flow was a record of $13,589 million in 1Q22 EQNR Quarterly Free cash flow history (Fun Trading) Note: I use the generic free cash flow, not including divestitures. It is the cash flow from operations minus CapEx. The company has a different way of calculating the free cash flow.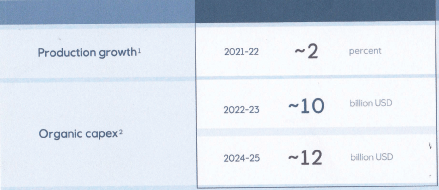
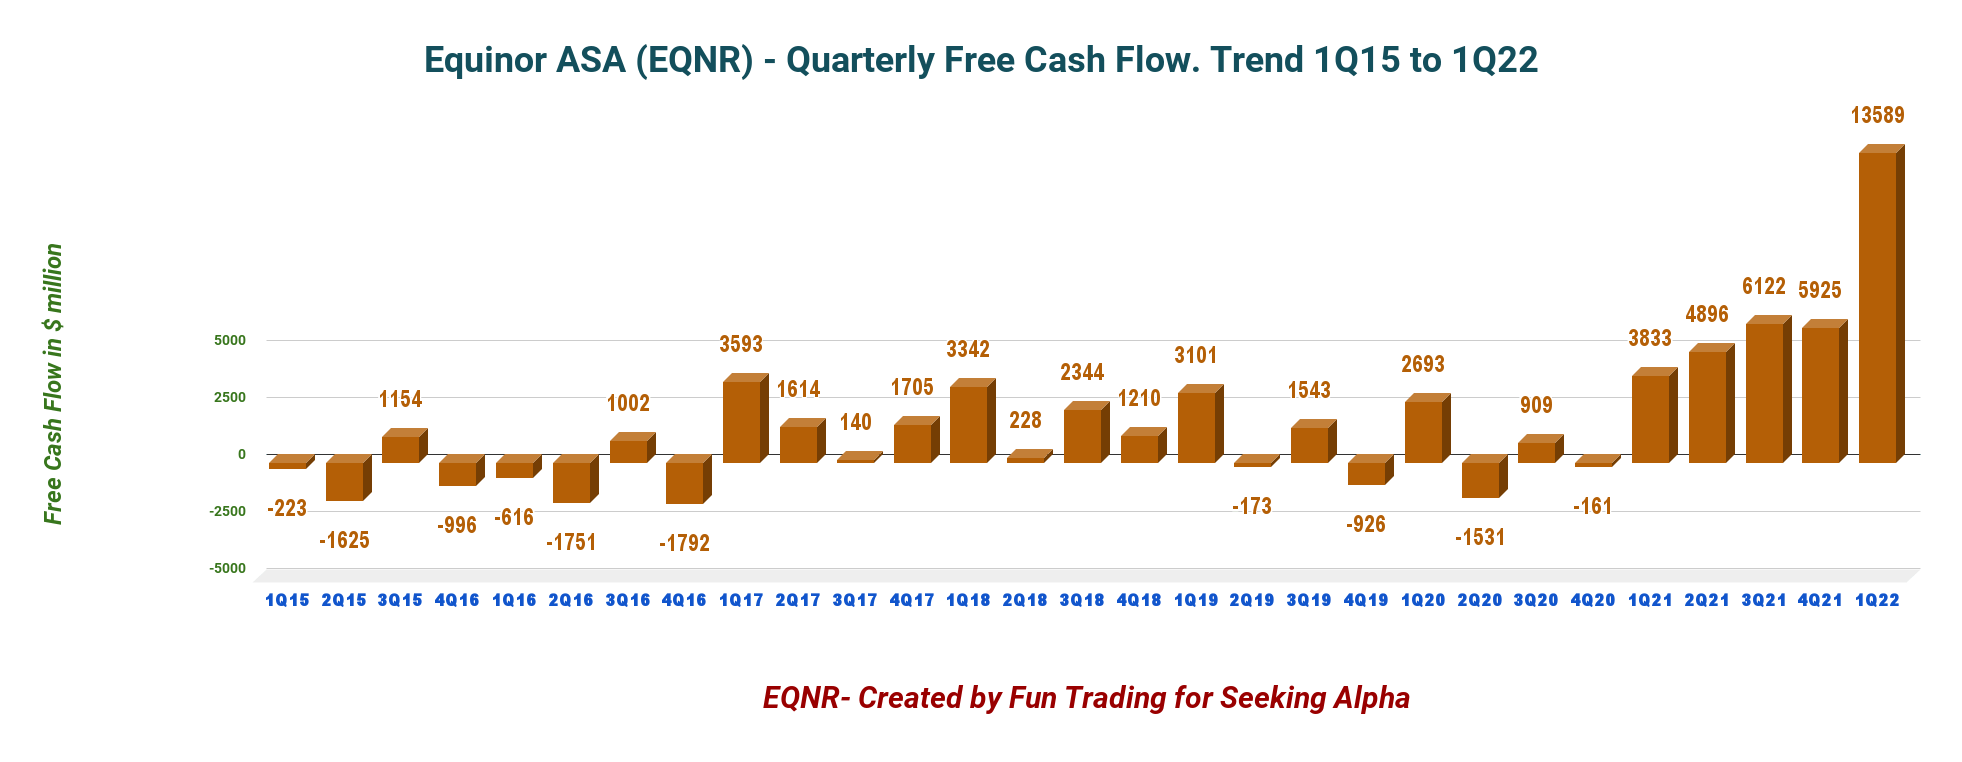
The company’s free cash flow was a record of $13,589 million in the first quarter of 2022, or a trailing 12-month free cash flow of $30,533 million.
Equinor announced a quarterly dividend of $0.20 per share, unchanged from the 4Q21. Also, its board declared a special quarterly cash dividend of $0.20 per share for the first quarter of 2022.
CFO Ulrica Fearn said in the conference call:
Based on the continued strong prices from second half of 2021 and earnings in the quarter, the Board has decided on a cash dividend of $0.20 per share and an extraordinary cash dividend of $0.20 per share.
Subject to approval at the AGM, we proposed a second tranche of the share buyback program of $1.33 billion, in line with the level communicated at CMU of up to $5 billion in 2022.
4 – No Net Debt in 1Q22
EQNR Quarterly Cash versus Debt history (Fun Trading)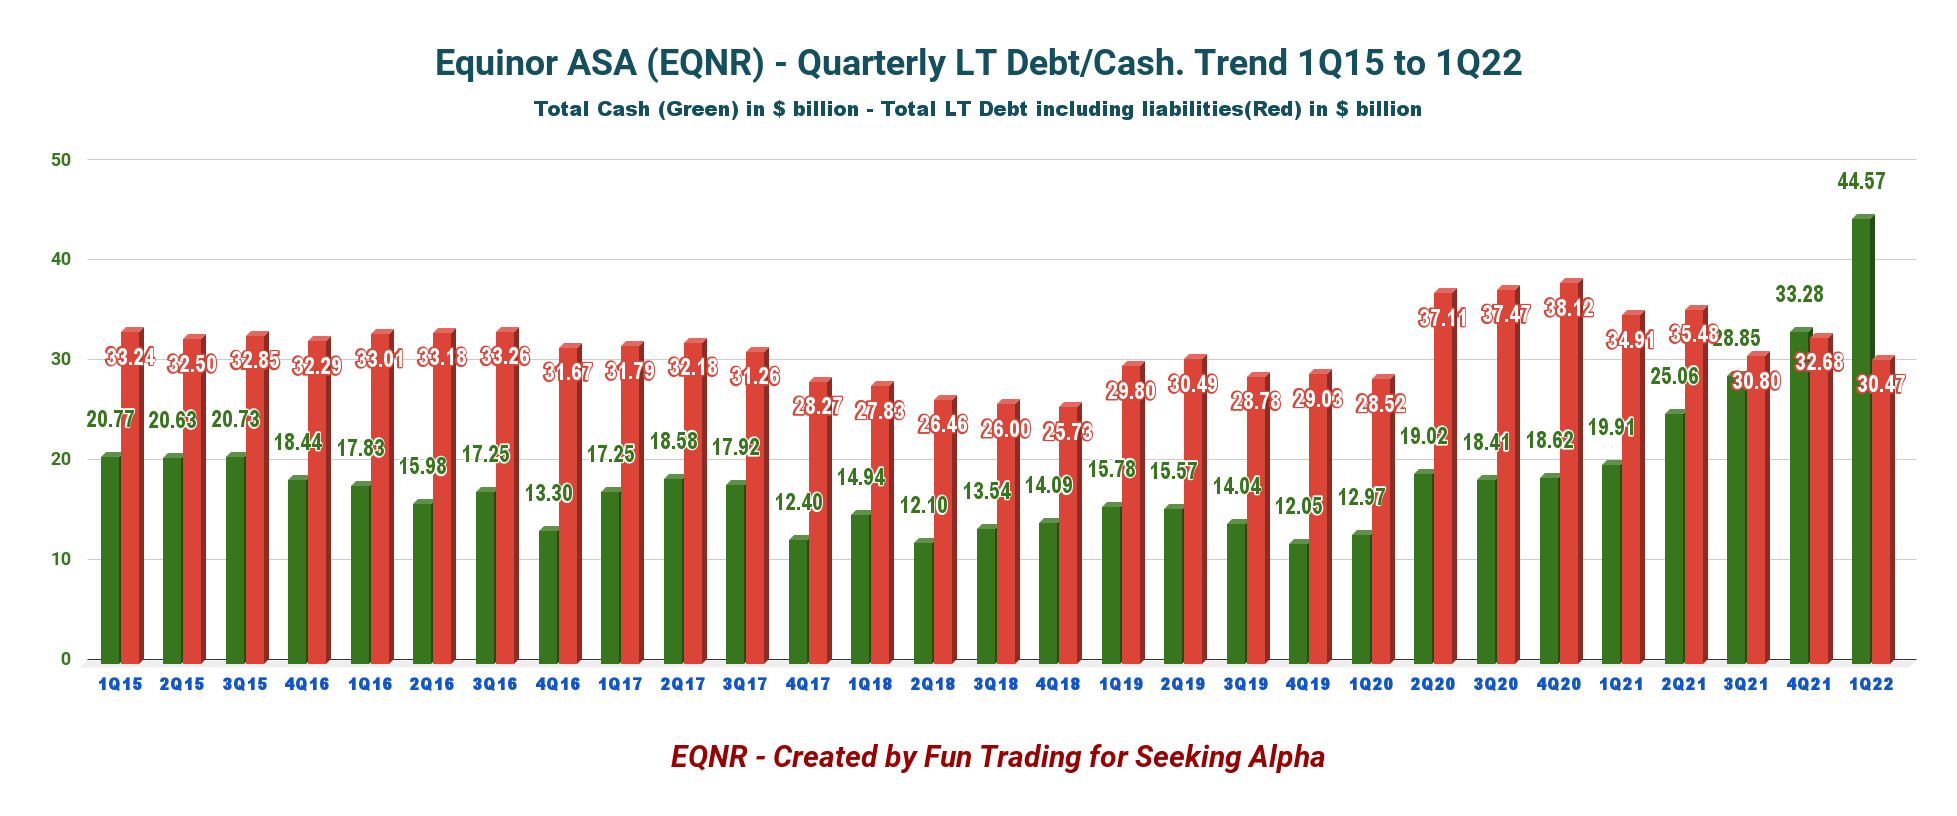
Note: The debt indicated above in the graph is the gross interest-bearing debt plus liabilities.
As of March 31, 2022, Equinor reported $44.57 billion in cash, cash equivalents, and securities. The company’s long-term debt amounted to $30.465 billion at the quarter-end.
The debt-to-equity ratio is down to 0.70 from 0.838 the preceding quarter.
5 – Production Upstream and Investment in Renewables
5.1 – Oil Equivalent Production
EQNR Quarterly Oil equivalent production history (Fun Trading )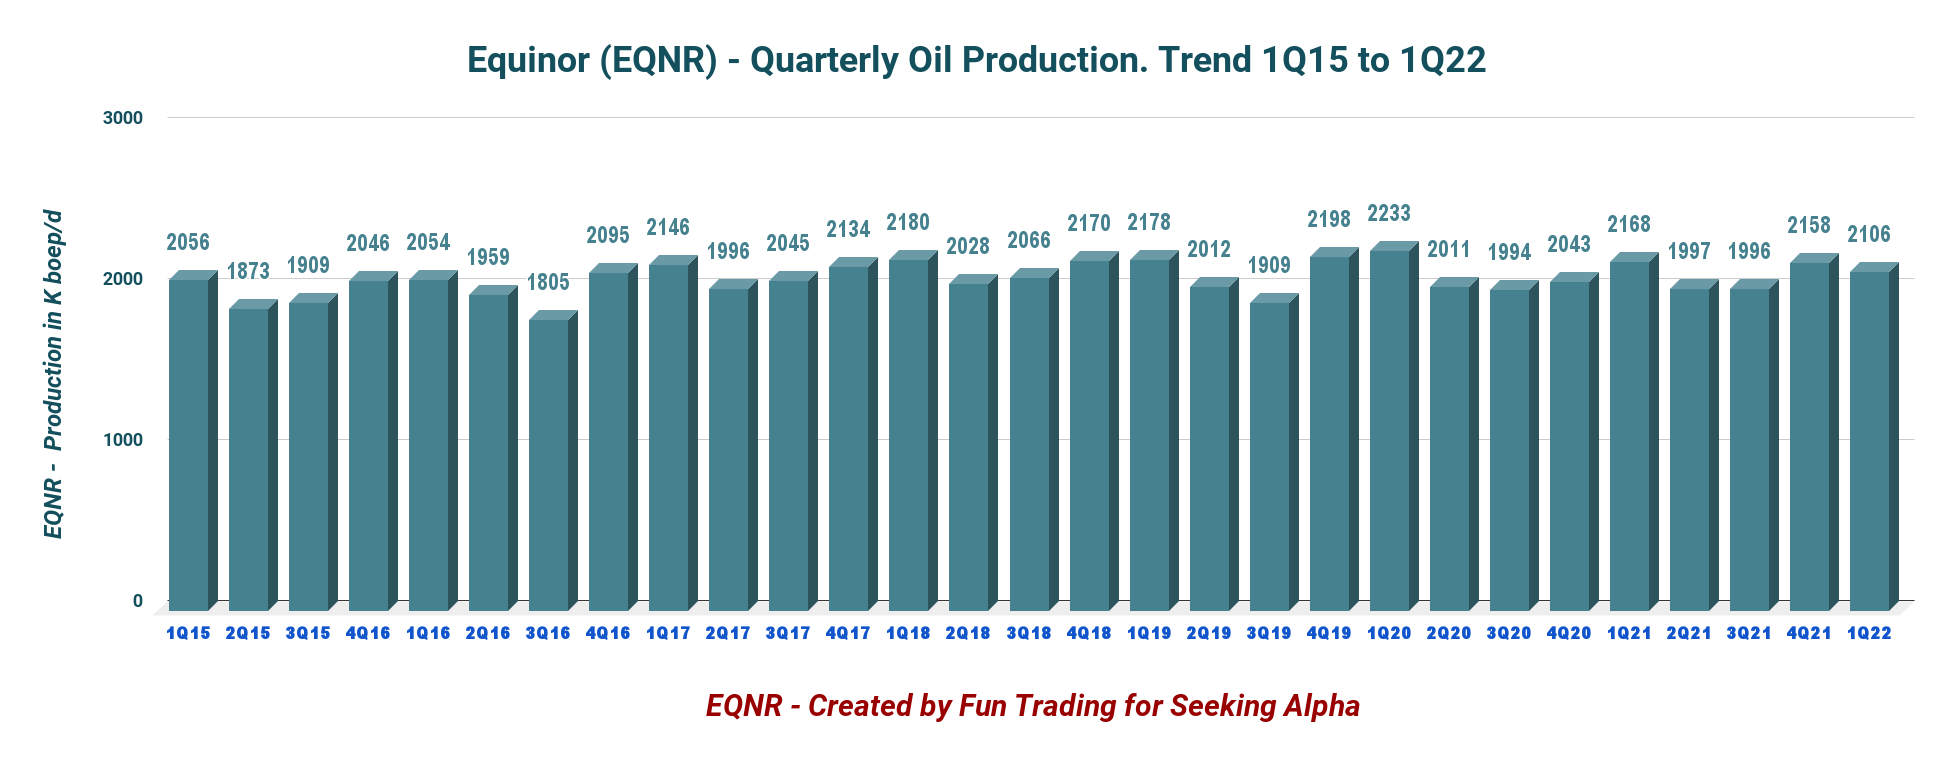
- The first quarter production was 2,106K Boep/d, down from 2,168K Boep/d in the same period in 2021 and down 2.4% sequentially. Gas production was 1,055 Boep/d or about 50% of the total output.
- Equinor share for power generation was 511 GWh this quarter, up from 461 GWh last year.
5.2 – 2021 Reserves down 9.3% from 2020 (unchanged from the preceding quarter).
EQNR Reserve 2021 (Equinor) EQNR TA Chart short-term (Fun Trading)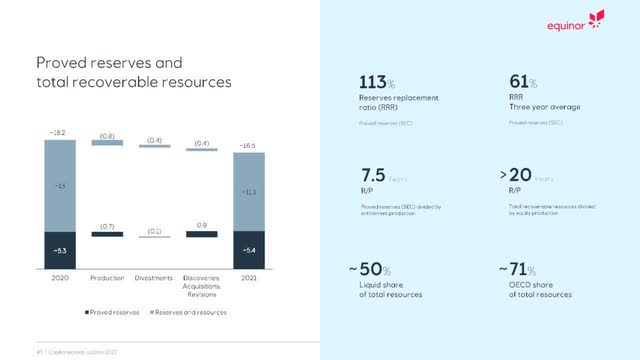
Technical Analysis And Commentary
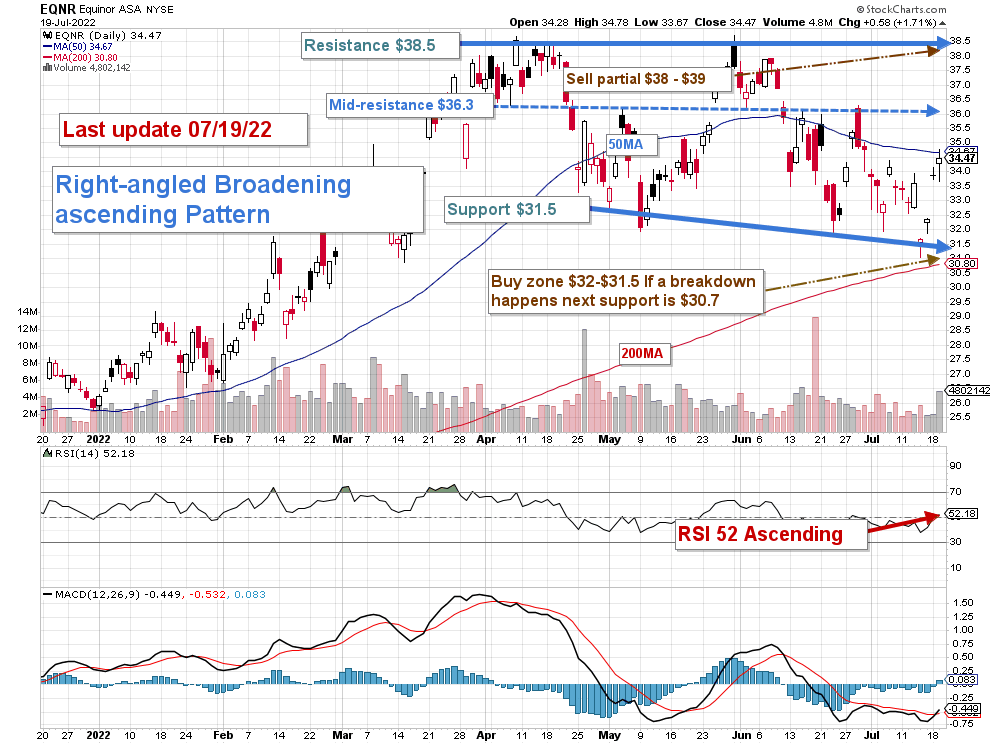
Note: The chart is adjusted for the dividend.
EQNR forms a right-angled broadening ascending pattern with resistance at $38.5 and support at $31.5.
The trading strategy is to sell about 30% or more at or above $38.5 and accumulate between $32 and $30.7. As I said in my preceding article EQNR is highly correlated to oil prices, and selling or buying judgments must factor in this critical component.
I believe long-term investors should continue accumulating this cyclical stock on any weakness, which is an excellent natural gas play.
The overall strategy that I usually promote in my marketplace, “The Gold and Oil Corner,” is to keep a core long-term position and use about 35%-40% to trade LIFO while waiting for a higher final price target to sell your core position.
Note: The LIFO method is prohibited under International Financial Reporting Standards (IFRS), though it is permitted in the United States by Generally Accepted Accounting Principles (GAAP). Therefore, only US traders can apply this method. Those who cannot trade LIFO can use an alternative by setting two different accounts for the same stock, one for the long-term and one for short-term trading.
Warning: The TA chart must be updated frequently to be relevant. It is what I am doing in my stock tracker. The chart above has a possible validity of about a week. Remember, the TA chart is a tool only to help you adopt the right strategy. It is not a way to foresee the future. No one and nothing can.
Author’s note: If you find value in this article and would like to encourage such continued efforts, please click the “Like” button below to vote for support. Thanks.
Be the first to comment