

Pgiam/iStock via Getty Images
Investment Thesis
Market-makers [MM] everyday are called on to balance buyers and sellers’ share volumes in transactions. For typical small, regularly appearing individual investor trades, no problem. Markets are automated to quickly adapt from electronic “offer books” with little to no help.
But when systems are surprised by irregularly-appearing, huge volume transaction orders from “institutions” adjusting billion-$ portfolios, they choke, needing MM help to get in balance. Where sufficient protection from subsequent price change in a subject stock can be found at a reasonable cost, then MMs will borrow shares lent (usually by other institutions for a fee) to be delivered to the buy-side of the big trade order.
This is done hundreds to thousands of times each market day, but only when “insurance” from hedging in derivative securities can be economically had, with cost borne by the trade initiator.
The structure and prices of the derivative-securities’ contracts providing the underlier-stock price-change protection reveal the MM-community and institution expectations of the stock’s higher and lower price limits. Those limits define price risk and rewards seen in the next few months for the subject stock, making comparisons of investment prospects between similar alternatives in the next few months viable.
This article compares the prospects for Enterprise Products Partners L.P. (NYSE:EPD) with those for other energy midstream competitors, particularly with BP Midstream Partners LP (BPMP).
Description of Subject Company
As stated on the Yahoo Finance website:
Enterprise Products Partners L.P. provides midstream energy services to producers and consumers of natural gas, natural gas liquids (NGLs), crude oil, petrochemicals, and refined products. The company operates through four segments: NGL Pipelines & Services, Crude Oil Pipelines & Services, Natural Gas Pipelines & Services, and Petrochemical & Refined Products Services. It also operates refined products pipelines and terminals; and ethylene export terminals, as well as provides refined products marketing and marine transportation services. The company was founded in 1968 and is headquartered in Houston, Texas.
Yahoo Finance
Description of Principal Competitor
As stated on the Yahoo Finance website:
BP Midstream Partners LP owns, acquires, develops, and operates pipelines and other midstream assets in the United States. Its assets consist of interests in entities that own crude oil, natural gas, refined products, and diluent pipelines, as well as refined product terminals to transport onshore crude oil production to refinery in Whiting, Indiana as well as offshore crude oil and natural gas production to refining markets, and trading and distribution hubs. BP Midstream Partners GP LLC serves as a general partner of BP Midstream Partners LP. The company was incorporated in 2017 and is based in Houston, Texas.
Reward~Risk Comparison with Alternatives
Figure 1
blockdesk.com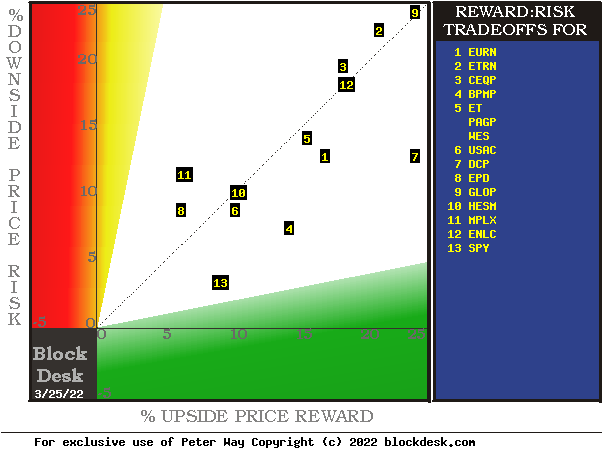
(used with permission)
The tradeoffs here are between near-term upside price gains (green horizontal scale) seen worth protecting against by Market-makers with short positions in each of the stocks, and the prior actual price drawdowns experienced during holdings of those stocks (red vertical scale). Both scales are of percent change from zero to 25%.
The intersection of those coordinates by the numbered positions is identified by the stock symbols in the blue field to the right.
The dotted diagonal line marks the points of equal upside price change forecasts derived from Market-Maker [MM] hedging actions and the actual worst-case price drawdowns from positions that could have been taken following prior MM forecasts like today’s.
Our principal interest is in EPD at location [8] plus BPMP at [4]. A “market index” norm of reward~risk tradeoffs is offered by SPDR S&P500 index ETF at [13].
Those forecasts are implied by the self-protective behaviors of MMs who must usually put firm capital at temporary risk to balance buyer and seller interests in helping big-money portfolio managers make volume adjustments to multi-billion-dollar portfolios. The protective actions taken with real-money bets define daily the extent of likely expected price changes for thousands of stocks and ETFs.
This map is a good starting point, but it can only cover some of the investment characteristics that often should influence an investor’s choice of where to put his/her capital to work. The table in Figure 2 covers the above considerations and several others.
Comparing Alternative Investment Details
Figure 2
blockdesk.com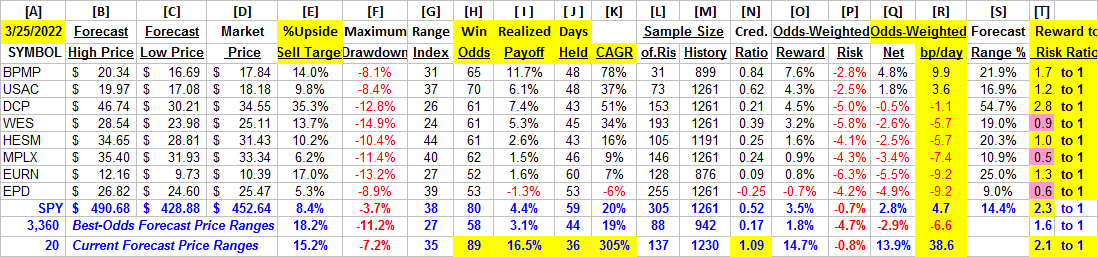
(used with permission)
Column headers for Figure 2 define elements for each row stock whose symbol appears at the left in column [A]. The elements are derived or calculated separately for each stock, based on the specifics of its situation and current-day MM price-range forecasts. Data in red numerics are negative, usually undesirable to “long” holding positions. Table cells with pink background “fills” signify conditions typically unacceptable to “buy” recommendations. Yellow fills are of data for the stocks of principal interest and of all issues at the ranking column, [R].
Readers familiar with our analysis methods may wish to skip to the next section viewing price range forecast trends for EPD.
Figure 2’s purpose is to attempt universally comparable answers, stock by stock, of a) How BIG the price gain payoff may be, b) how LIKELY the payoff will be a profitable experience, c) how soon it may happen, and d) what price drawdown RISK may be encountered during its holding period.
The price-range forecast limits of columns [B] and [C] get defined by MM hedging actions to protect firm capital required to be put at risk of price changes from volume trade orders placed by big-$ “institutional” clients.
[E] measures potential upside risks for MM short positions created to fill such orders, and reward potentials for the buy-side positions so created. Prior forecasts like the present provide a history of relevant price draw-down risks for buyers. The most severe ones actually encountered are in [F], during holding periods in effort to reach [E] gains. Those are where buyers are most likely to accept losses.
[H] tells what proportion of the [L] sample of prior like forecasts have earned gains by either having price reach its [B] target or be above its [D] entry cost at the end of a 3-month max-patience holding period limit. [ I ] gives the net gains-losses of those [L] experiences and [N] suggests how credible [E] may be compared to [ I ].
Further Reward~Risk tradeoffs involve using the [H] odds for gains with the 100 – H loss odds as weights for N-conditioned [E] and for [F], for a combined-return score [Q]. The typical position holding period [J] on [Q] provides a figure of merit [fom] ranking measure [R] useful in portfolio position preferencing. Figure 2 is row-ranked on [R] among candidate securities, with BPMP in top rank.
Our basic problem with EPD is that it fails collectively, starting at the smallest upside price change foreseen at +5.3%, with experienced losses of -8.9% from positions encouraged by its current RI forecasts, losses actually larger than its upside goal. Since actual history of market prices following prior RI forecasts like today’s produced position profitability of only 160 of the 300+ eligible, EPD’s low ranking is no surprise.
Along with the candidate-specific stocks these selection considerations are provided for the averages of over 3300 stocks for which MM price-range forecasts are available today, and 20 of the best-ranked (by fom) of those forecasts, as well as the forecast for S&P500 Index ETF (SPY) as an equity market proxy.
The present uncertainties in the equities market at large are seen in the [T] column. The forecast population of the 3,360 row is a broader measure of equities in general than the 500 relatively bigger-cap stocks of SPY. Its R~R ratio of 1.6 to 1 has less [E] payoff prospect beyond the column [F] size of price drawdown than SPY’s 2.3 to 1. The real difference is in the [F] risk column where SPY is only 1/3rd as much exposed to price drawdowns as the rest of the population exposure for the broad market index. SPY’s Sample Size of 305 (out of 1,261 market days of the past 5 years) provides how broad is today’s Range Index of 38, a usual level with a reward~risk ratio of 2.3. The high level of world uncertainty from Russia’s invasion of Ukraine appears to have little abnormal effect on big-capital equities.
Recent Trends in MM Price-Range Forecasts for EDP
Figure 3
blockdesk.com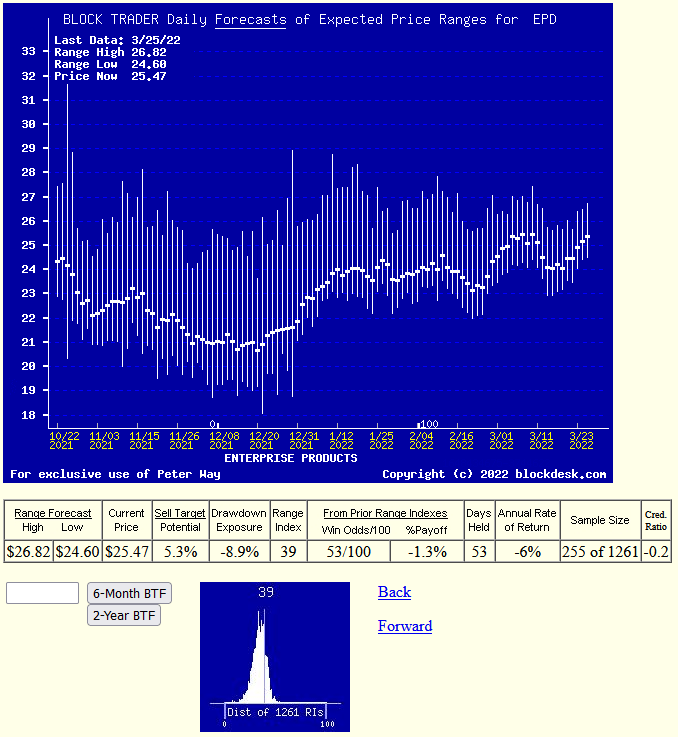
Used with permission)
This picture is not a “technical chart” of past prices for EPD. Instead, it is the past 6 months of daily price range forecasts of market actions yet to come in the next few months. The only past information there is the closing stock price on the day of each forecast.
That data splits the price range’s opposite forecasts into upside and downside prospects. Their trends over time provide additional insights into coming potentials, and helps keep perspective on what may be coming.
The small picture at the bottom of Figure 3 is a frequency distribution of the Range Index’s appearance daily during the past 5 years of daily forecasts. The Range Index [RI] tells how much the downside of the forecast range occupies of that percentage of the entire range each day, and its frequency suggests what may seem “normal” for that stock, in the expectations of its evaluators’ eyes.
Here the present level is just above its most frequent presence, encouraging the acceptance that we are looking at a realistic evaluation for EPD. With few past RIs above the present RI than below there is little room for an even more positive outlook.
Recent Trends in MM Price-Range Forecasts for BPMP
Figure 4
blockdesk,com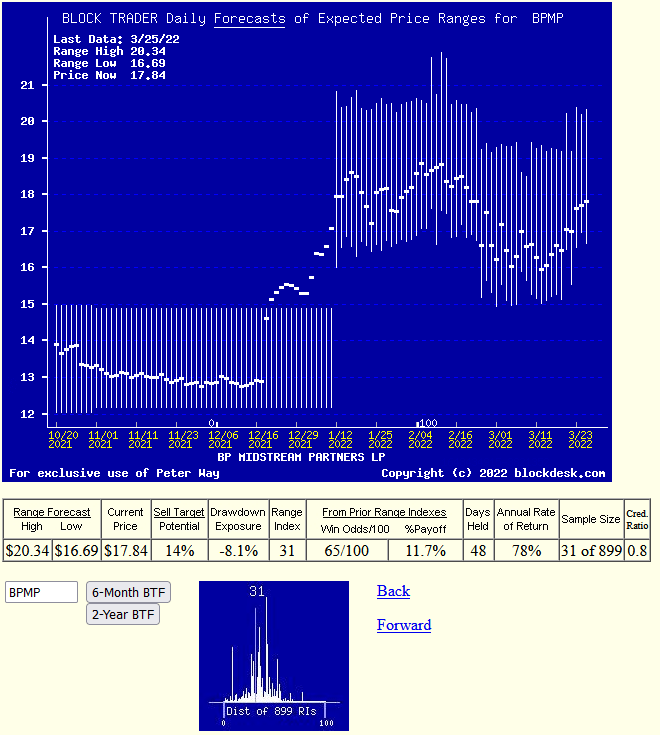
used with permission
The clear-ahead competitor among these energy midstream stocks is BPMP, with 11.7% realized net gains from positions indicated by prior Range Index reward-to-risk advantage, achieved in 48 market-day holding periods, only a bit over two months. That gain compounded 5+ times a year produces a CAGR of 78% when other equivalent stock winners can be employed.
Conclusion
Among alternative investments for other energy midstream competitors, BP Midstream Partners appears to be a logical buy preference now for investors seeking near-term capital gain, particularly in comparison with Enterprise Products Partners.
Unlike other recent swap prospects recently identified, this is one where the initial capital source sale target should not be the target to receive the expanded proceeds for reinvestment. There are many other equity capital gain opportunities with CAGR prospects equivalent to BPMP’s present one. The near-term forecast horizon is what keeps active investing strategy productive, so be open to the next attractive one.
Additional disclosure: Peter Way and generations of the Way Family are long-term providers of perspective information, earlier helping professional investors and now individual investors, discriminate between wealth-building opportunities in individual stocks and ETFs. We do not manage money for others outside of the family but do provide pro bono consulting for a limited number of not-for-profit organizations.
We firmly believe investors need to maintain skin in their game by actively initiating commitment choices of capital and time investments in their personal portfolios. So our information presents for D-I-Y investor guidance what the arguably best-informed professional investors are thinking. Their insights, revealed through their own self-protective hedging actions, tell what they believe is most likely to happen to the prices of specific issues in coming weeks and months. Evidences of how such prior forecasts have worked out are routinely provided at our SA blog under my name.
Be the first to comment