

zorazhuang
Strictly from a valuation perspective, there are a number of really attractive companies in the energy midstream space. To me, one of the most appealing over the past several months has been Enterprise Products Partners (NYSE:EPD). With over 50,000 miles of pipelines dedicated to things like NGLs, crude oil, natural gas, petrochemicals, and refined products, not to mention other significant energy assets like gas production facilities, fractionators, condensate distillation facilities, deepwater docks, and more, the enterprise is also one of the largest in its space. In fact, with a market capitalization of $55.59 billion, the company is one of the largest energy companies out there, period. Add on top of this the fact that the company continues to see improved bottom line results and I cannot help but to keep it rated a ‘strong buy’ at this time.
The picture just keeps getting better
Back in early August of 2022, I wrote an article discussing the bullish case for Enterprise Products Partners. In that article, I talked about how incredibly well the company had done leading up to that point. Major investments that were made by the company we’re proving successful in pushing top line and bottom line results higher. I was also impressed by how high-quality the company looked to be as a whole, and by how cheap shares were. This ultimately led me to rate it a ‘strong buy’, a rating that reflected my belief that shares should drastically outperform the broader market for the foreseeable future. The company has managed to outperform the market since the publication of that article. But I wouldn’t exactly call the return disparity enough to be classified as significant relative to the rating I assigned the company. While the S&P 500 is down 5.2%, shares of Enterprise Products Partners reported downside of only 0.3%.
Author – SEC EDGAR Data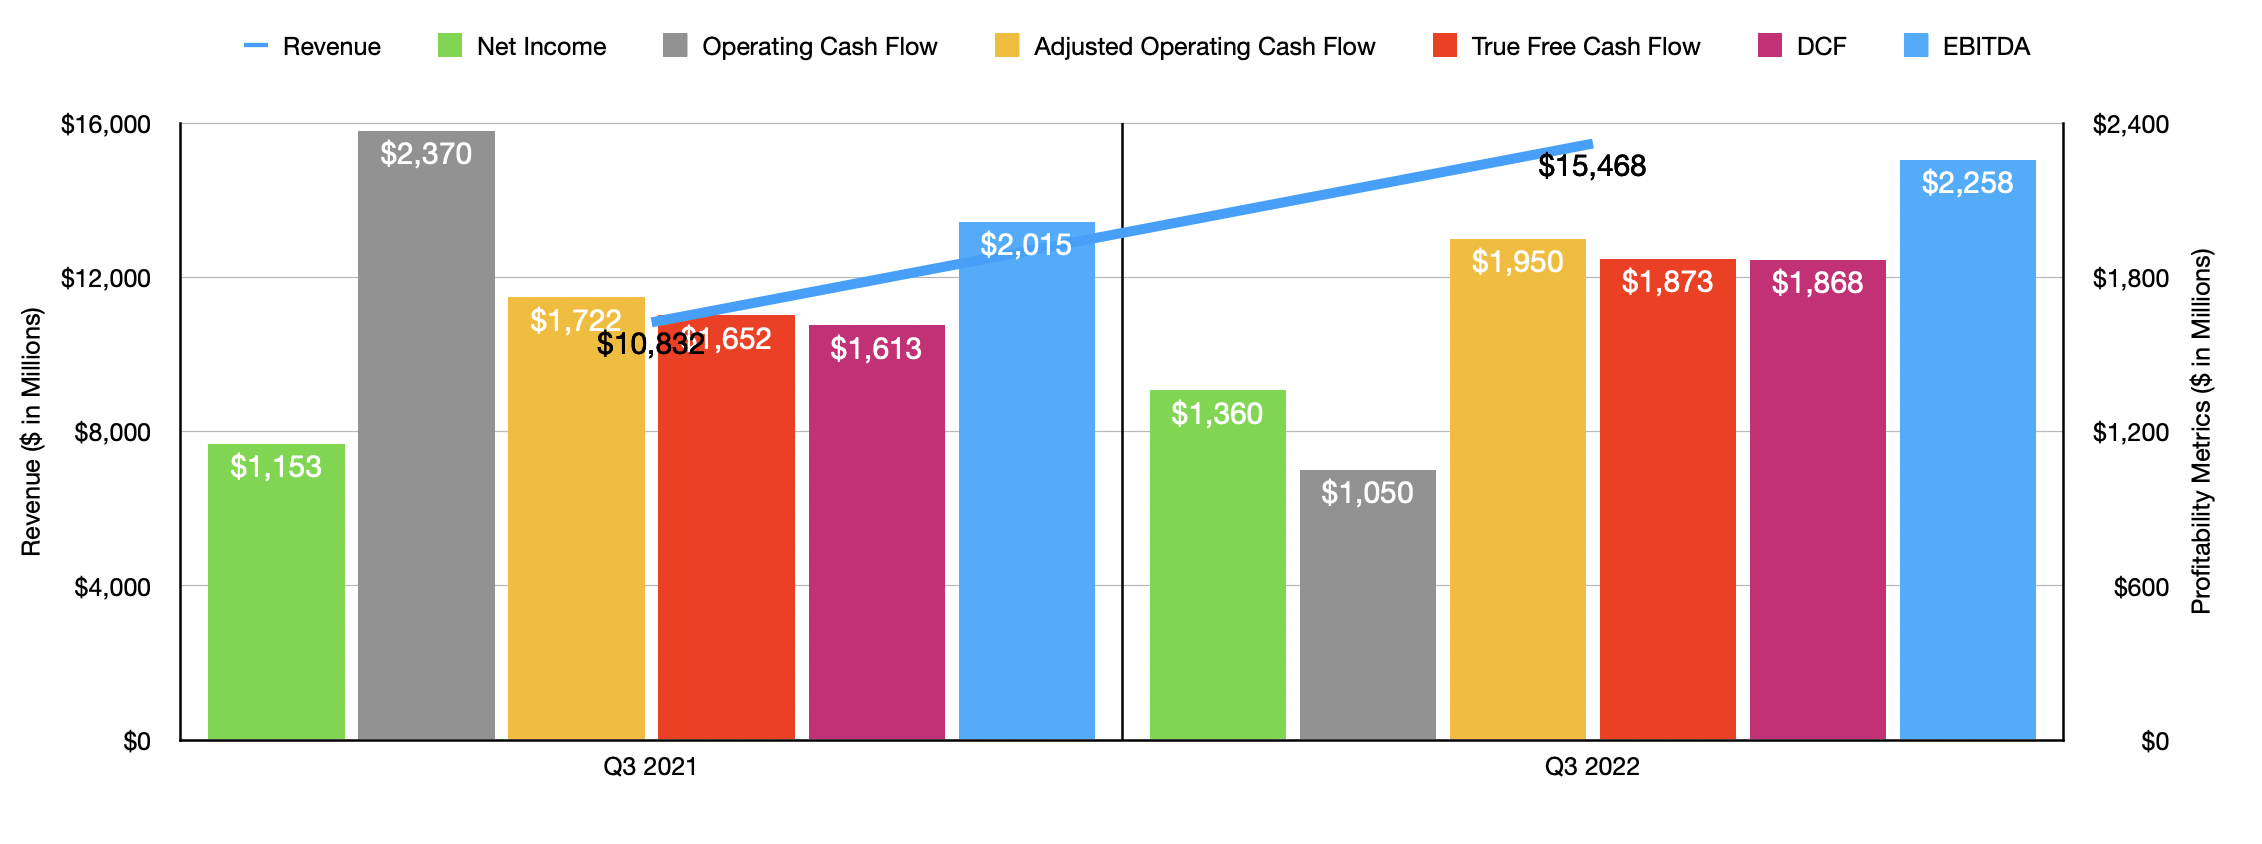
This outperformance, though not as impressive as I would have anticipated, was no fluke. The fact of the matter is that the company has been performing incredibly well. To see what I mean, we need only point to financial performance covering the third quarter of its 2022 fiscal year. This is the only quarter for which new data is available that was not available when I last wrote about the firm. During that quarter, revenue came in at $15.47 billion. That’s 42.8% higher than the $10.83 billion generated the same time one year earlier. According to management, the firm saw sales increase across three of its four operating segments. In dollar terms, the largest increase came from its NGL Pipelines & Services segment. Revenue there spiked 63.4% from $3.82 billion to $6.24 billion. Midstream services under this category grew by roughly 11% from $647 million to $718 million. But the real heavy lifter from a sales perspective was the portion of the company dedicated to selling NGLs and related products. A combination of higher average sales prices and higher sales volumes helped the segment immensely. But in fact, those two factors were also instrumental in pushing Crude Oil Pipelines & Services revenue and Natural Gas Pipelines & Services Revenue up year over year. Collectively, higher pricing added $3.6 billion to the company’s top line, while increased volumes added $1.1 billion.
Because of the nature of the company, I don’t believe that revenue is all that important a metric on its own. Instead, we should be looking at other metrics. Net income, while definitely the least important of the profitability metrics, should at least be mentioned. During that quarter, this metric totaled $1.36 billion. That’s up from the $1.15 billion reported one year earlier. Other profitability metrics followed a similar trajectory. DCF, also known as distributable cash flow, rose from $1.61 billion to $1.87 billion. Meanwhile, EBITDA increased from $2.02 billion to $2.26 billion. The only profitability metric to really suffer was operating cash flow. It plunged from $2.37 billion to $1.05 billion. But if we adjust for changes in working capital, it would have increased from $1.72 billion to $1.95 billion. Another metric that I like to pay attention to is what I refer to as ‘true free cash flow’. This is operating cash flow minus the capital expenditures needed to keep operations running as they have been while ignoring the capital expenditures allocated toward growth. The goal was to not punish the company for investing in its growth initiatives. This metric also rose year over year using the adjusted operating cash flow as our base, with the metric climbing from $1.65 billion to $1.87 billion.
Author – SEC EDGAR Data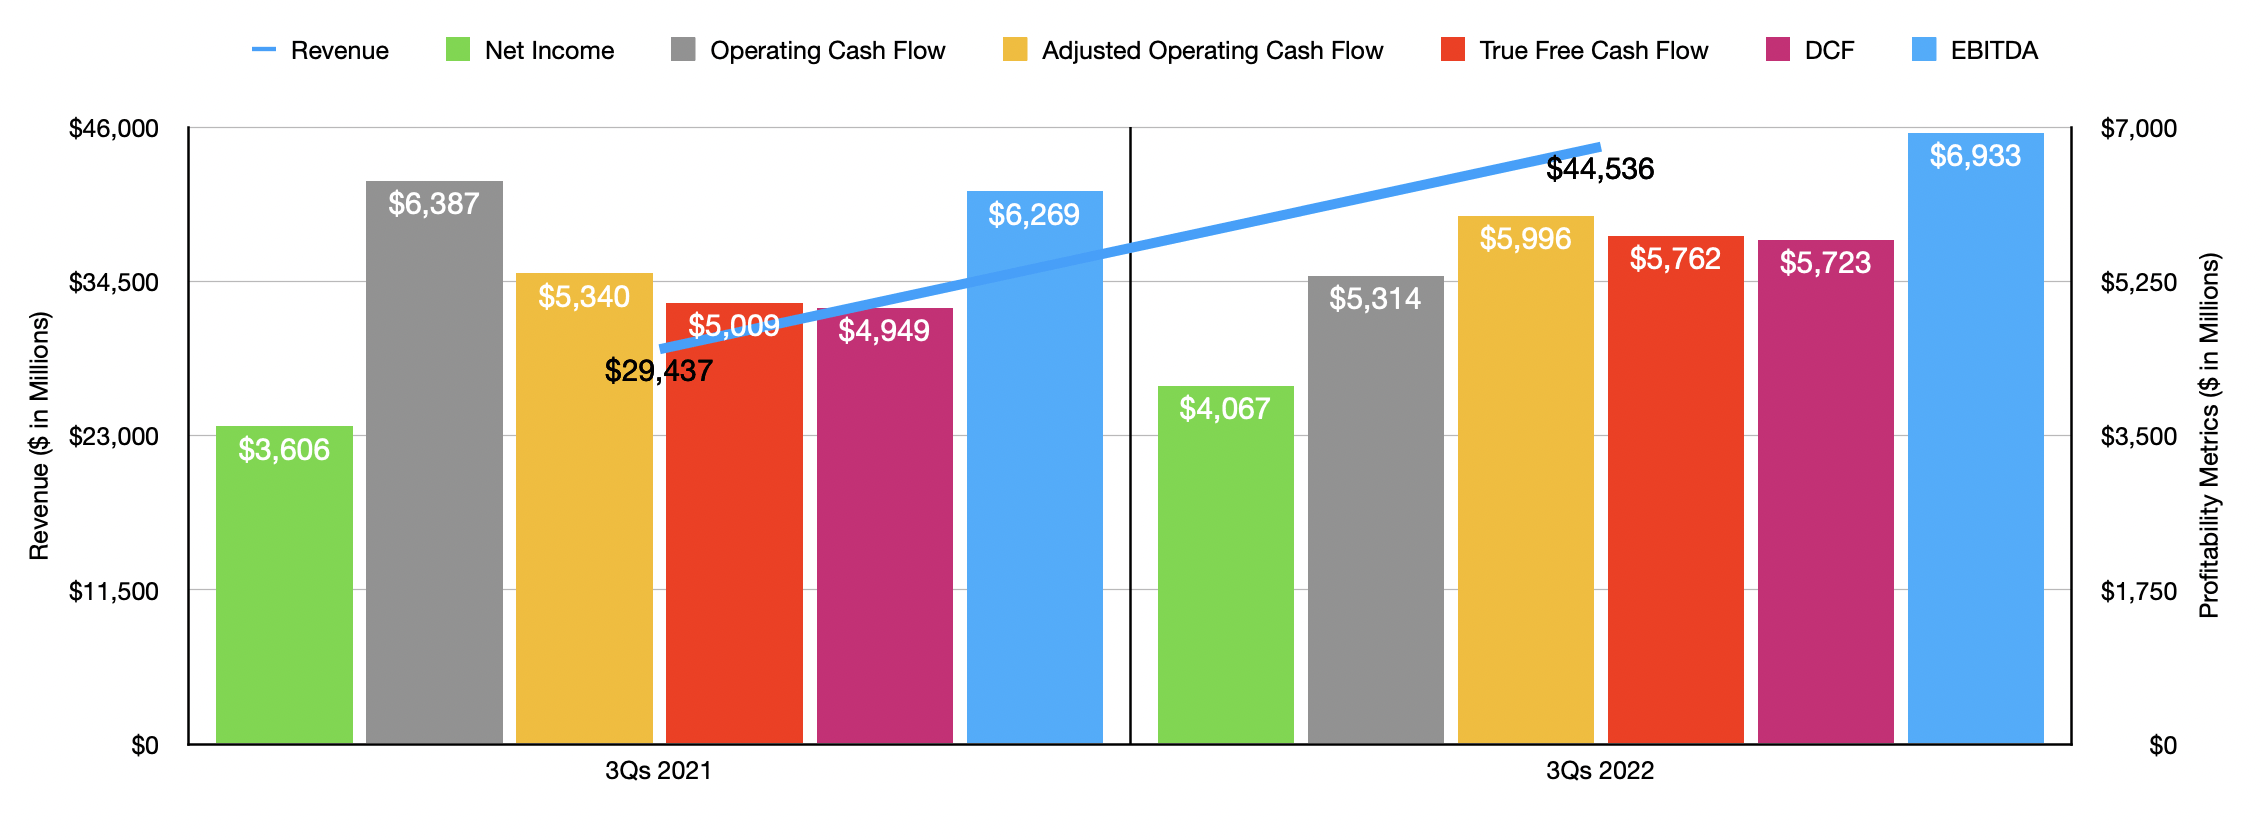
The results experienced during the third quarter of the year were very similar to what the company achieved for the first nine months of the year as a whole. Year over year, for starters, revenue for the firm jumped 51.3% from $29.44 billion to $44.54 billion. This allowed net income to climb from $3.61 billion to $4.07 billion. Once again, operating cash flow did decrease year over year, dropping from $6.39 billion to $5.31 billion. But if we adjust for changes in working capital, it would have risen from $5.34 billion to nearly $6 billion. DCF popped higher from $4.95 billion to $5.72 billion, while ‘true free cash flow’ expanded from $5.01 billion to $5.76 billion. And finally, EBITDA for the company also expanded, climbing from $6.27 billion to $6.93 billion.
Author – SEC EDGAR Data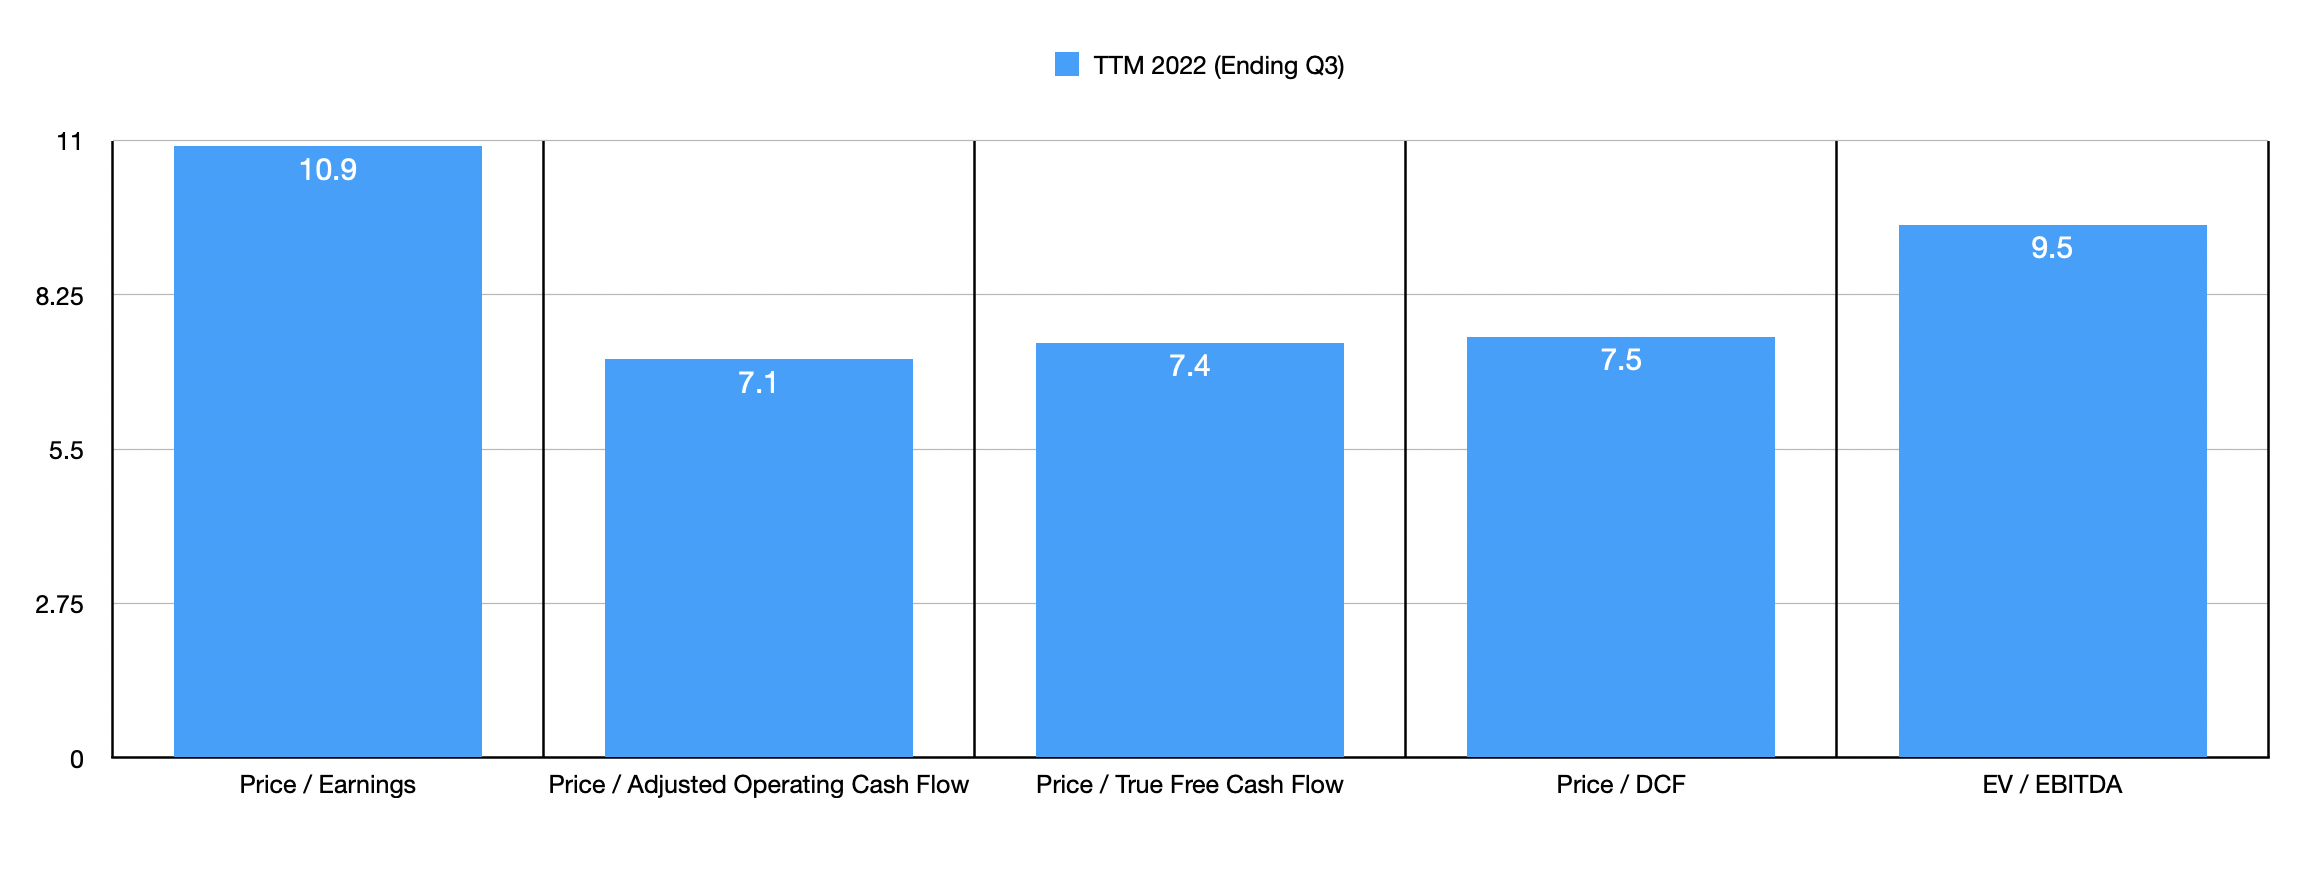
When it comes to valuing the company, I decided to use trailing 12-month figures for the time period ending in the third quarter. Utilizing this approach, I calculated that the company is trading at a price-to-earnings multiple of 10.9. The price to adjusted operating cash flow multiples should be 7.1, while the price to ‘true free cash flow’ multiple should be 7.4. Based on my calculations, the price to DCF multiple is around that at 7.5. And finally, the EV to EBITDA multiple should be 9.5. As part of my analysis, I took two of these metrics, the price to adjusted operating cash flow multiple and the EV to EBITDA multiple, and compared the company using these to five similar firms. On the price to operating cash flow basis, the five companies ranged from a low of 4 to a high of 8.8. Two of the five were cheaper than our prospect. And when it comes to the EV to EBITDA approach, the range was from 7.8 to 391.2. In this scenario, only one of the five was cheaper.
| Company | Price / Operating Cash Flow | EV / EBITDA |
| Enterprise Products Partners | 7.1 | 9.5 |
| TC Energy (TRP) | 8.8 | 12.2 |
| Kinder Morgan (KMI) | 8.6 | 12.3 |
| The Williams Companies (WMB) | 8.1 | 11.8 |
| Cheniere Energy (LNG) | 4.8 | 391.2 |
| Energy Transfer (ET) | 4.0 | 7.8 |
Takeaway
Fundamentally speaking, Enterprise Products Partners seems to be doing quite well for itself. By most measures, cash flow data for the company look stronger than it was a year ago. And because of the space in which it operates, cash flow tends to be stable over time. Even if we ignore the prospect of continued growth, the firm looks to be trading on the cheap on an absolute basis. It’s also near the low end of the scale when it comes to pricing compared to similar firms. In truth, it’s not my favorite prospect on the market. That is reserved for Energy Transfer, which I actually own shares in. But when it comes to the next best prospects available, Enterprise Products Partners most certainly deserves to be considered a contender. As such, I have decided to reiterate my ‘strong buy’ rating at this time.
Be the first to comment