

Investment Thesis:
A review of ETFs each focusing on stocks to hold from a specific narrow industry now points to semiconductors as a best-choice near capital gain buy, with SPDR S&P Semiconductor ETF (XSD) the favored candidate.
XSD not the only opportunity
But it’s one of the better ones, particularly among typically more placid ETFs. To find others, we looked at dozens of ETFs with holdings specialized by industry. Their Reward to Risk tradeoffs were the first test, shown in Figure 1.
Figure 1
Source: Author
This map locates securities at the intersection of prospective price gains (green horizontal scale) and potential price drawdowns (red vertical scale) based on market-maker hedging behavior to protect their necessary endangerment of firm capital as they enable volume trades. Desirable conditions are down and to the right.
The “frontier” of best advantage runs from PNQI at location [10] to SPY at [14] to ITB at [22]. SPDR S&P 500 Index Trust (SPY) at [14] involves a statistically unreliable sample of prior forecasts, as does IYR at [30] and ITB. XSD is of interest to us at [23].
Comparing Investment Details
Additional characteristics of investment attraction to the more interesting ETFs are highlighted in Figure 2.
Figure 2
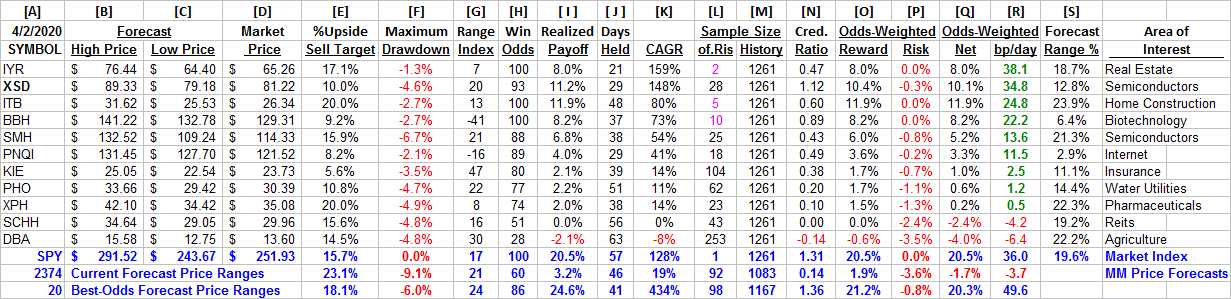
Source: Author
The hedging-implied price-range forecasts are in columns [A] to [D], with upside prospect [E] calculated from [B] and [D].
The remaining columns are based on prior 5-year histories of each stock’s price changes following only those points in time when forecasts were similar in proportions of upside-to-downside price change like what is being seen today. The measure of that balance we call the Range Index [RI], and its numeric is the percentage of the [B] to [C] range between [D] and [C]. So, a stock with a RI “cost” of 25 appears to have 3 times as much upside price gain prospect as price drawdown exposure.
The “unfortunate comparisons” referred to above in discussing Figure 1 can be seen in [L] and [M], where some stocks (in pink) have single-digit [L] counts of [G] RI forecasts, while others may have triple-digit ones. Averages based on samples less than one or two dozens are statistically suspect of being colored by a few a-typical experiences.
Several columns of historical experience where that could be a problem include: [F] the average of worst-case price drawdown during the period when a position was open following the RI forecast, on its way to the [B] target of the [E] upside. Another problem potential is in [H], the proportion of [L] forecasts which produced profitable outcomes.
Those stocks with small [L] counts may not have [I] % net reward payoffs which may be reliable in the future. The Credibility Ratio in [N], where [I] is compared to [E] helps to condition acceptance of [E].
All red items in this table would be loss results for long positions in these stocks, if TERMD portfolio management was followed, with the exception of items in [F]. Those are the worst outcomes previously possible to encounter while holding a position encouraged by a RI forecast in Sample [L]. They represent the most stressful point likely to cause abandonment of an effort to retain the position in expectation of price recovery.
Our principal interest in Figure 2 is comparing column items in the XSD row with other likely near-term investment candidates. Because of limited sample sets, all other issues above SMH are not considered acceptable at this time. Because SMH is also a semiconductor-stock holding ETF its comparisons are telling. Its [E] upside of +16 is better than XSD, but its realized payouts [I] from prior forecasts are a major negative, with only under +7% net gains, less than half of its upside forecast, while XSD realizations actually exceeded its upside forecast of +11%. That deficiency for SMH follows through to its odds-weighted reward~risk net [Q] measure at only half of that for XSD.
No other ETFs in this set equal XSD in either its CAGR net returns [K] or its [H] Win Odds, nor coming close to its caliber of speed [R] of odds-weighted net rewards at 34.8 basis points (1/3rd of a %) per day. For reference, a +19 bp/d rate sustained for a year doubles the capital involved.
Only at the top tier of the 2,374 issues for which we have MM forecasts this day are there issues exceeding XSD in CAGRs or bp/day. Even there, XSD’s worst-case price drawdowns are less severe than the forecast population’s top 20 of -6%.
Recent Trends of MM Forecasts
Figure 3 provides the past 6 months of daily MM price range forecasts.
Figure 3
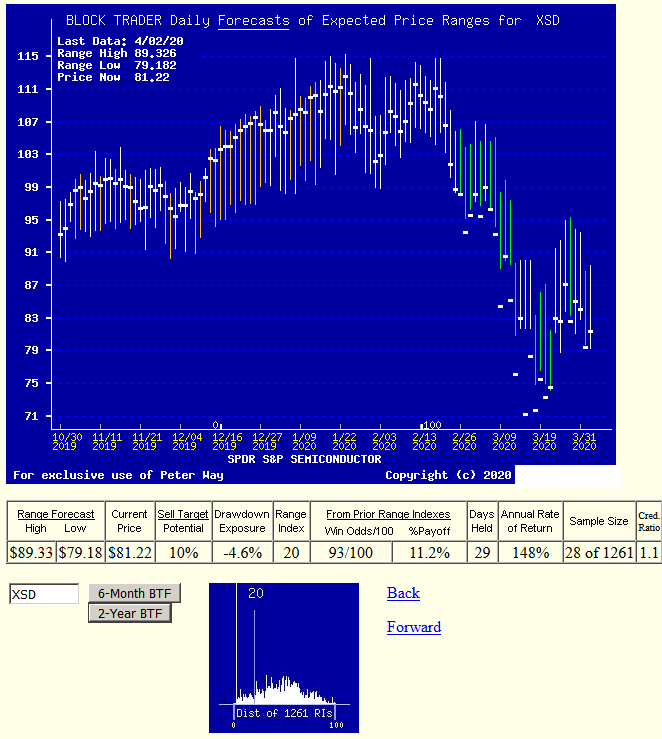
Please note the forecast recovery indicated by the last vertical bar to the right only shows its top at less than half a price recovery of the ETF’s level less than two months ago.
Conclusion
SPDR S&P Semiconductor ETF appears to be at this time an exceptionally good ETF investment for near-term capital gain in comparison to several dozen other industry-focused ETFs examined here.
Disclaimer: Peter Way and generations of the Way Family are long-term providers of perspective information, earlier helping professional investors and now individual investors, discriminate between wealth-building opportunities in individual stocks and ETFs. We do not manage money for others outside of the family but do provide pro bono consulting for a limited number of not-for-profit organizations.
We firmly believe investors need to maintain skin in their game by actively initiating commitment choices of capital and time investments in their personal portfolios. So, our information presents for D-I-Y investor guidance what the arguably best-informed professional investors are thinking. Their insights, revealed through their own self-protective hedging actions, tell what they believe is most likely to happen to the prices of specific issues in coming weeks and months. Evidences of how such prior forecasts have worked out are routinely provided in the SA blog of my name.
Disclosure: I/we have no positions in any stocks mentioned, but may initiate a long position in XSD over the next 72 hours. I wrote this article myself, and it expresses my own opinions. I am not receiving compensation for it (other than from Seeking Alpha). I have no business relationship with any company whose stock is mentioned in this article.
Be the first to comment