

R&A Studio
An edited version of This article was published on Dividend Kings on Tuesday, Dec. 6.
This year an estimated 4 billion people will watch at least some of the World Cup in some fashion. That’s 50% of humanity, the single most-watched event in history.
While I’m not a sports fan, I love the World Cup. That’s because it brings out the best in humanity when we replace war and hate with good-spirited competition.
The World Cup happens every four years and represents a rare opportunity that should be cherished because it’s over before you know it.
The same is true of bear markets, which on average, happen once every four years. Just like the World Cup, bear markets are exhilarating, stressful, and at times, terrifying and full of dread and despair.
But unlike the World Cup, bear markets matter because they can make or break your retirement.
Today I wanted to share a golden opportunity in one of the world’s premier ultra-yield blue-chips, Enterprise Products Partners (NYSE:EPD).
This is the No. 1 quality name in its industry, and in 2023 it will become a dividend aristocrat.
Let me show you the three reasons why now is a potentially wonderful opportunity to buy the safety and quality king of midstream before it becomes a dividend aristocrat, and everyone else does.
Reason One: The Quality King Of Midstream Is An 8% Yield Retirees Can Trust
A deep dive into the tax complexity of MLPs.
- some tax proposals call for taxing LPs as corporations
- analysts think these have a small chance of actually passing
- and if they did high depreciation for MLPs would likely result in very modest tax bills that would not threaten the safety of very well-covered blue-chip distributions
- Foreign withholding tax rate of 37% and whether or not you can recoup it via tax credits depends on your country’s tax treaty with the US
Why am I recommending EPD today?
Ycharts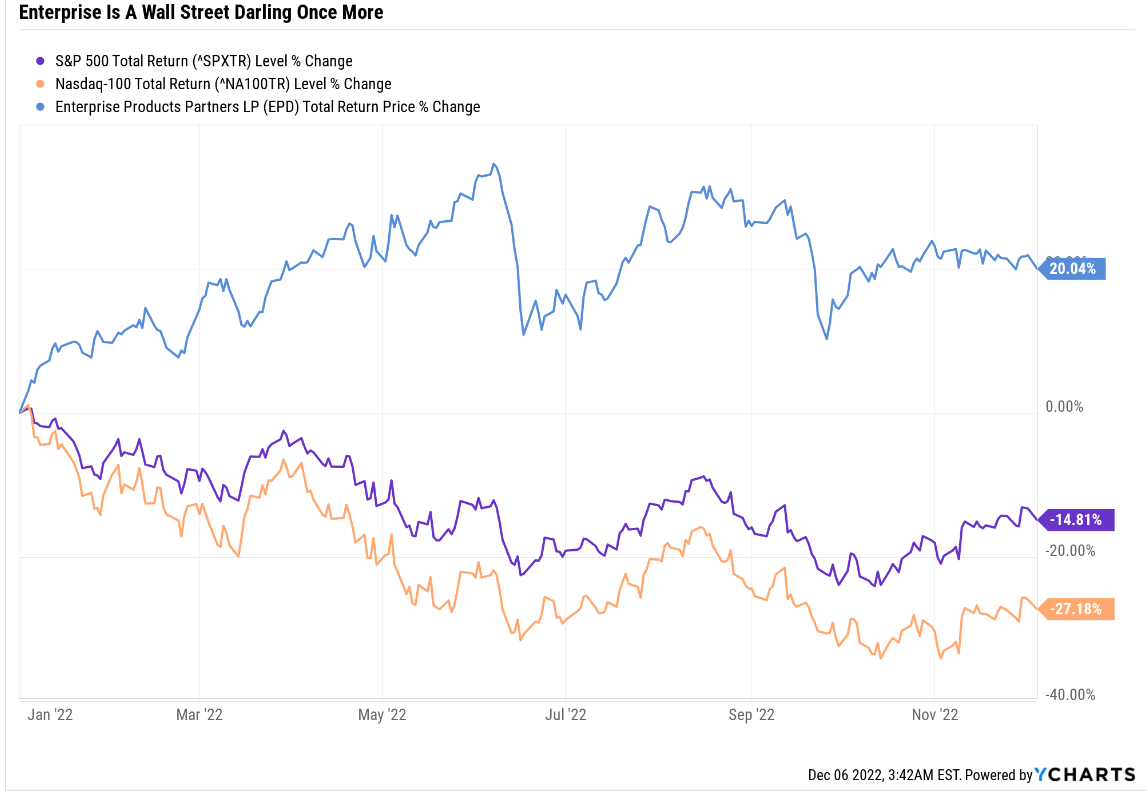
EPD isn’t crashing this year. It’s up 21%, one of the best ultra-yield blue-chips on Wall Street.
But that hardly means that EPD is overvalued or incapable of going much higher.
Ycharts
EPD isn’t even in a bear market, but it recently came out of the worst bear market in its history, a nearly 60% crash that wasn’t justified by fundamentals.
Portfolio Visualizer Premium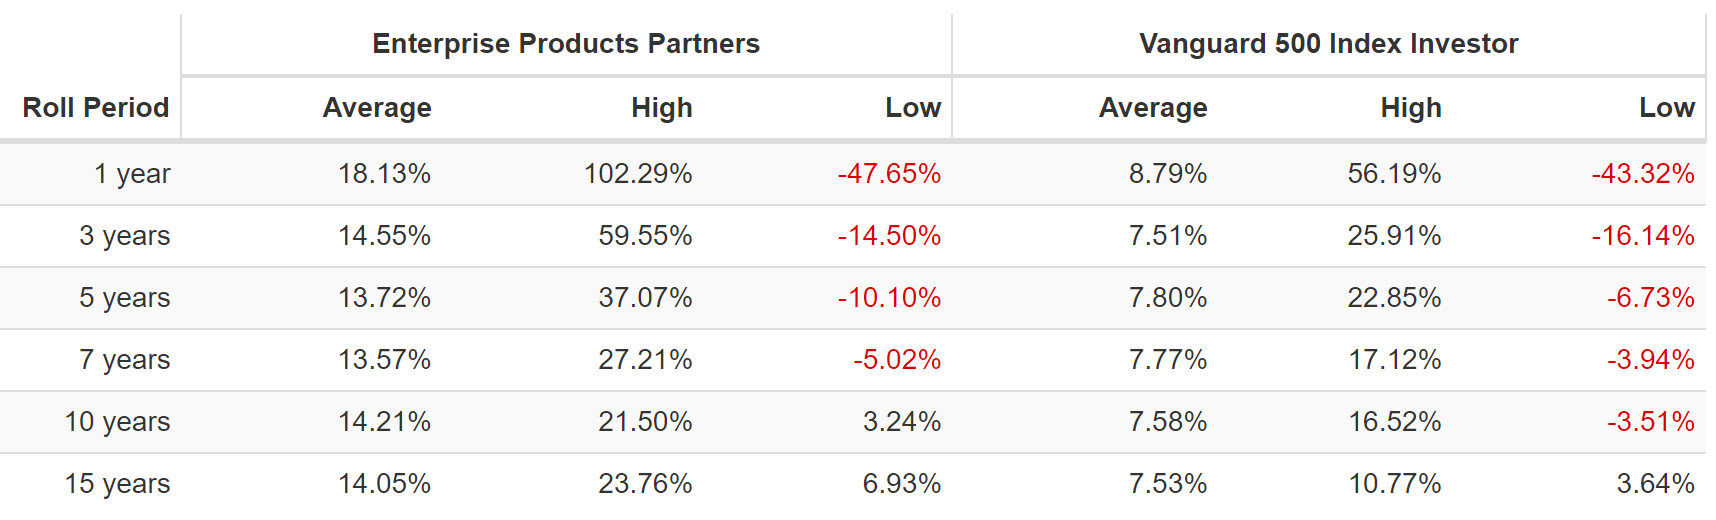
EPD from bear market lows is capable of Buffett-like returns for up to 15 years. In fact, the last time it was as undervalued (back in 2000) and trading at 7X cash flow, it went on to deliver 24% annual returns for the next 15 years.
Now we don’t expect EPD to deliver 25X returns in the next 15 years. EPD’s growth potential has slowed compared to the past.
- 4.4% CAGR consensus growth vs. 6.7% 20-year growth rate
But the growth outlook is still relatively the same as it was in the past, and the yield is mouth-watering.
- 7.8% very safe yield
- 100% safety score = 1% severe recession cut risk, 0.5% average recession cut risk
How can we tell? For one thing, EPD has raised its distribution by 7% this year, its 24th consecutive year of payout hikes.
- it becomes a dividend champion in 2024
- it would become a dividend aristocrat, except that S&P doesn’t permit MLPs into the S&P 500
EPD’s 7.8% Yield Is The Safest In Midstream
| Year | Distributable Cash Flow | Free Cash Flow | Distribution | DCF Payout Ratio | FCF Payout Ratio | Distribution/Unit |
| 2022 | $7,504.0 | $5,246.57 | $4,136.30 | 55.1% | 78.8% | $1.90 |
| 2023 | $7,379.0 | $5,638.43 | $4,310.46 | 58.4% | 76.4% | $1.98 |
| 2024 | $7,559.0 | $6,052.06 | $4,506.39 | 59.6% | 74.5% | $2.07 |
| 2025 | $7,655.0 | $5,681.97 | $4,528.16 | 59.2% | 79.7% | $2.08 |
| 2026 | $8,114.0 | $6,182.68 | $4,702.32 | 58.0% | 76.1% | $2.16 |
| 2027 | $8,529.0 | $6,639.85 | $4,832.94 | 56.7% | 72.8% | $2.22 |
| Annual Growth | 2.59% | 4.82% | 3.16% | 0.55% | -1.58% | 3.16% |
(Source: FAST Graphs, FactSet)
EPD’s masterful management, which many analysts consider the best in the industry, has balanced its growth spending so well that free cash flow is expected to grow at 5% annually through 2027.
Enterprise management are chessmasters in an industry where everyone else is playing checkers.” – Morningstar
That means the DCF payout ratio, the equivalent of the REIT AFFO payout ratio, is expected to remain stable at around 55%.
What’s more, it’s now fully free cash flow self funding, with a 79% FCF payout ratio that’s expected to decline to 73% by 2027, despite 3.2% annual distribution growth.
Free cash flow is what’s left over after running the business and investing in all future growth.
This means EPD is now 100% in charge of its own destiny.
- It neither has to rely on new debt issuances or equity issuances to grow its business
- FCF self-funding is the gold standard of midstream safety
In 2022 analysts expect EPD will retain $1.1 billion in free cash flow after paying $4.1 billion in distributions, and that retained free cash flow is expected to rise to $1.8 billion by 2027.
November 2022 investor presentation
EPD’s payout ratio has never been lower, and its distribution coverage ratio has never been higher.
Alliance Bernstein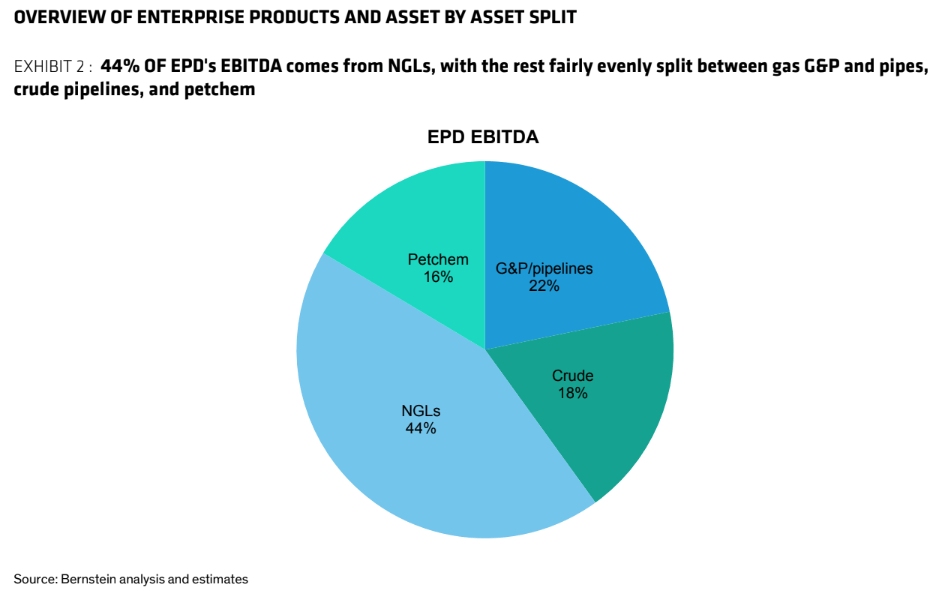
That’s because EPD is one of the most diversified midstreams in the world, with a hand in almost every part of the US oil and gas industry.
November 2022 investor presentation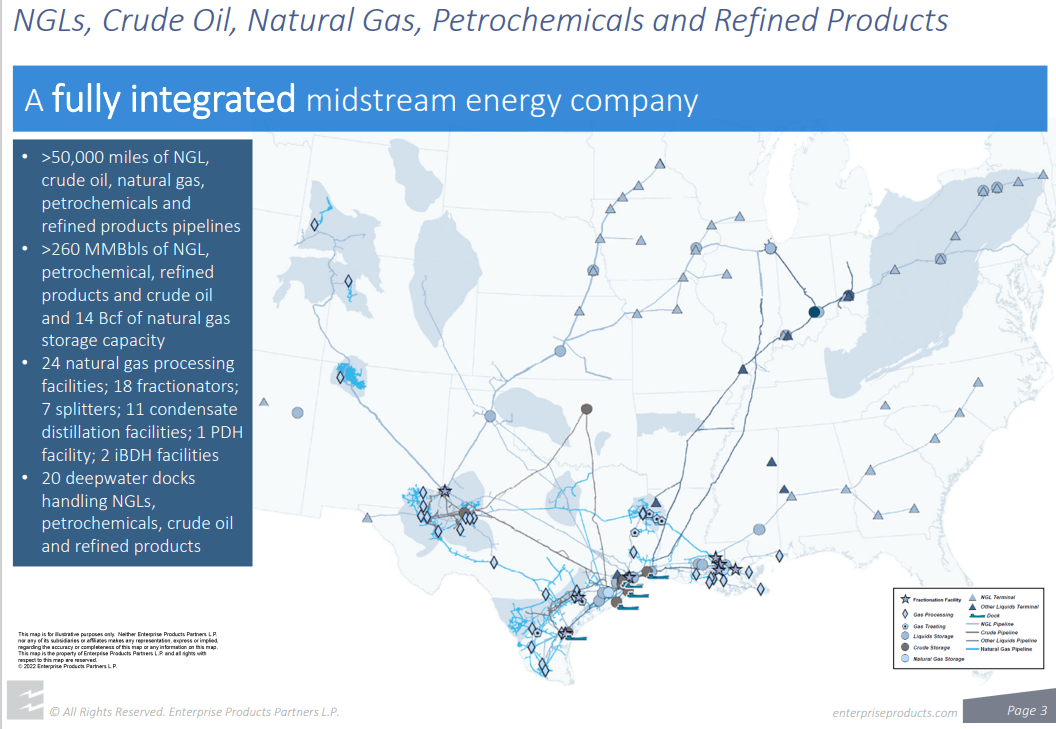
Natural gas liquids, or NGLs, are its largest focus because this is what the petrochemical industry needs to produce the products that go into almost everything the world produces (including renewable energy inputs).
In fact, 96% of all the products the world uses require oil, including solar, wind, and EVs. Without oil, there’s no energy transition.
November 2022 investor presentation
- 85% of EPD’s growth spending is focused on petrochemicals and NGLS
On average, every molecule of gas or oil passes through EPD’s systems six times from the oil well to the end consumer, and EPD collects a fee every step of the way.
Alliance Bernstein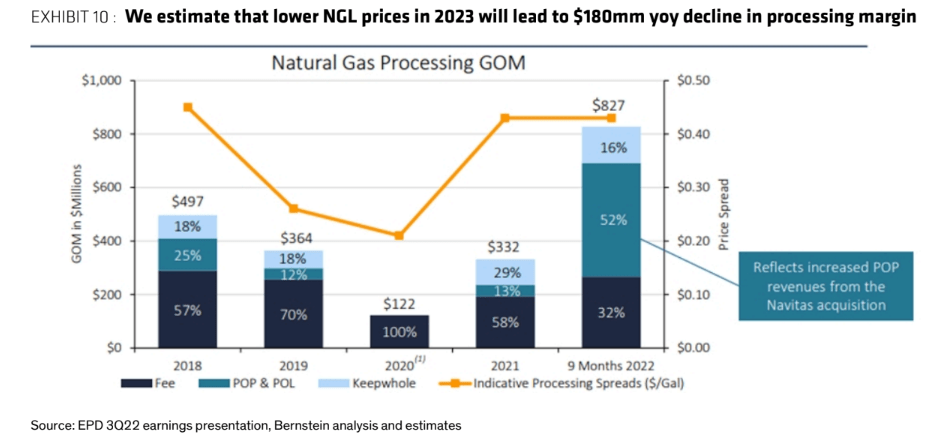
Yes, EPD faces some commodity price headwinds next year, which Alliance Bernstein thinks will cause operating income to fall by $180 million due to lower NGL margins.
- approximately 4% of cash flow headwind
But guess what? Excellent management can adapt to headwinds, and next year, EPD’s total operating cash flows are expected to grow by 8% and its distributable cash flow by 1%.
November 2022 investor presentation
EPD has a $5.5 billion growth backlog, including $2 billion in growth spending for next year.
- $5.1 billion in consensus free cash flow after spending $2 billion on growth
- $1.4 billion in post-dividend retained free cash flow in 2023
- up from $1.1 billion in 2022
Alliance Bernstein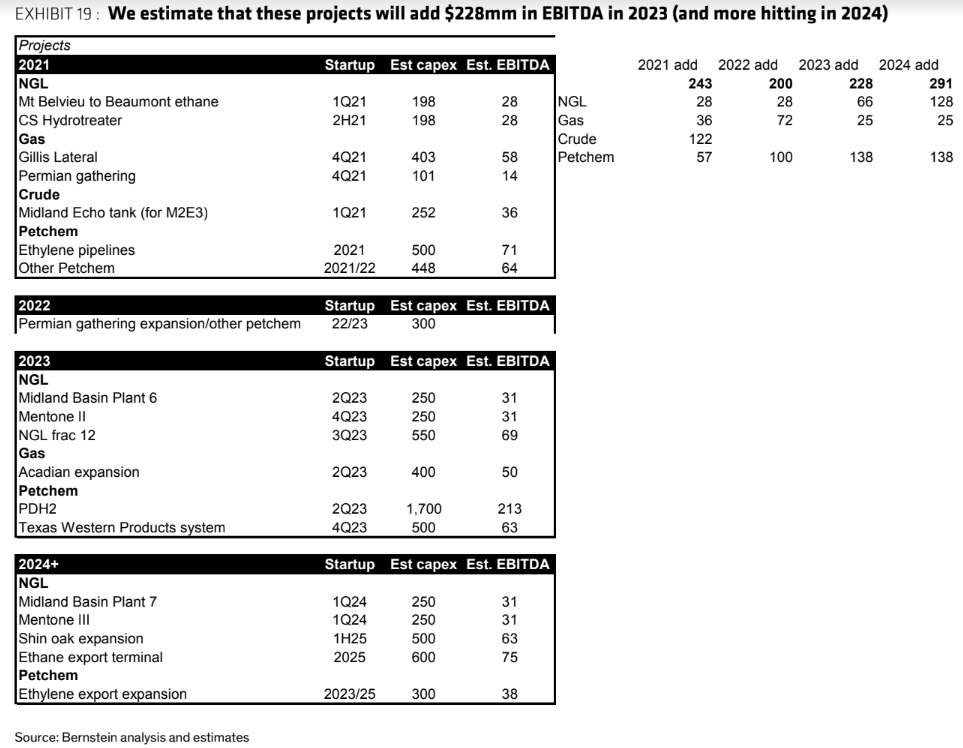
EPD’s $5.5 billion growth backlog is expected to increase EBITDA by $230 million in 2023, with another $291 million coming online in 2024.
- more than offsetting the NGL price headwind
Alliance Bernstein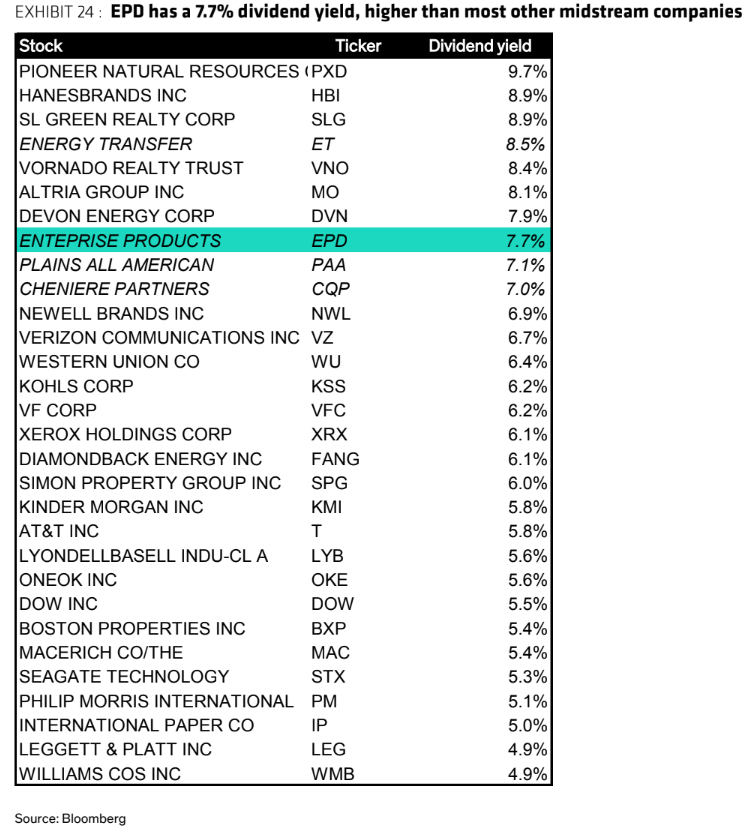
While there are higher yielding choices right now, very few blue-chips have EPD’s combination of Ultra SWAN (sleep well at night) quality, exceptional payout safety, and solid 4+% long-term growth prospects.
- no energy stock has a 100% safety score and yield higher than EPD
We remain bullish midstream as we believe the sector’s solid underlying fundamentals, defensive characteristics, reasonable valuations, and improved FCF should support outperformance on a relative basis.” – Wells Fargo
Midstream is in a great position as an industry thanks to incredible capital efficiency and discipline, and no one has better capital efficiency than EPD.
Wells Fargo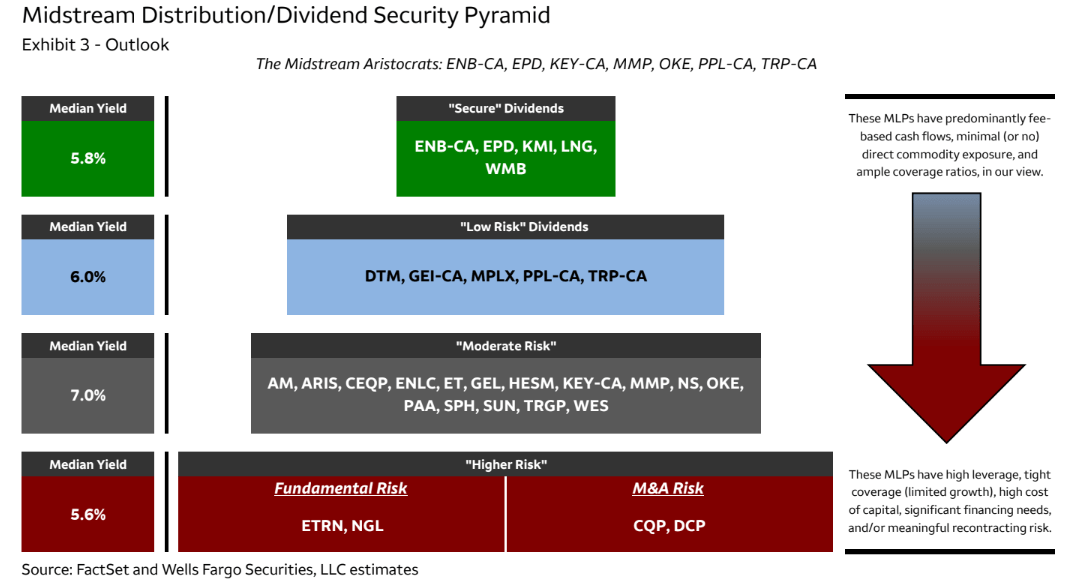
Wells Fargo’s analysts agree that EPD is among the “midstream aristocrats” in terms of payout safety.
Why? For one thing, there’s that FCF self-funding backed up by strong industry fundamentals.
Wells Fargo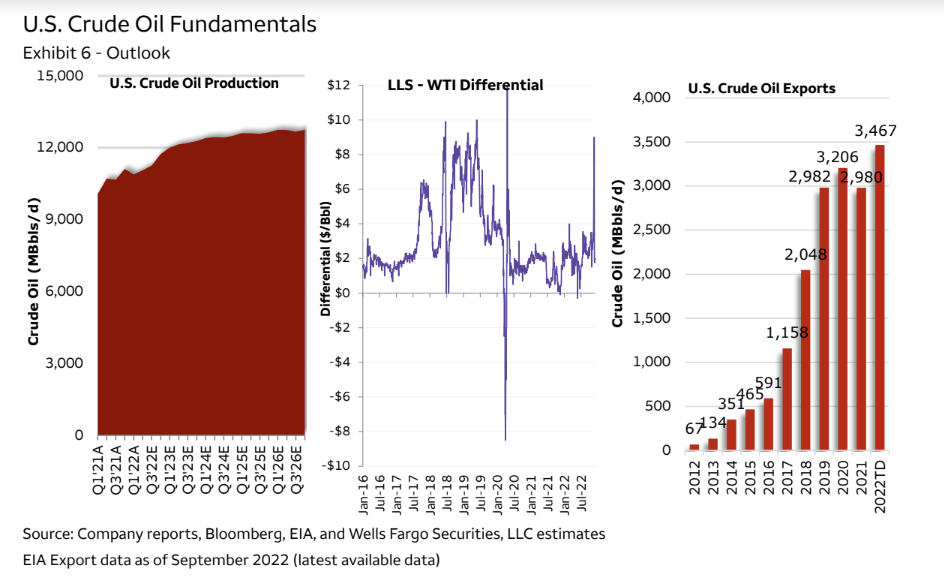
Next, we have a full recovery of the US energy industry, with crude production now at record levels and oil exports also at record levels, almost 3.5 million barrels per day.
Wells Fargo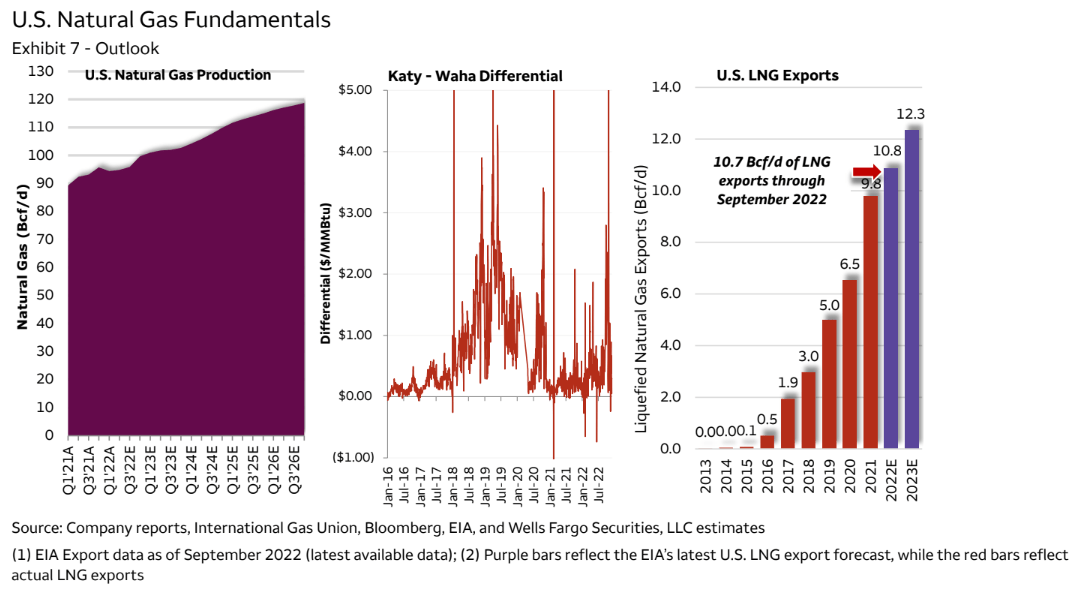
Natural gas is booming, with record production and record liquified natural gas, or LNG, exports. Thanks to the Russian invasion, Europe will be completely replacing Russian gas, which is expected to drive a huge boom in US LNG.
Wells Fargo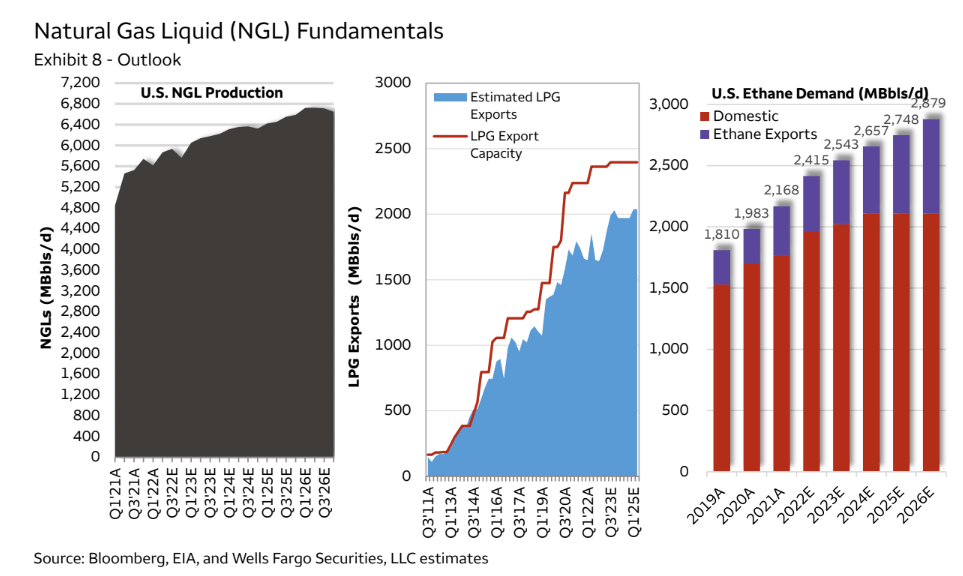
NGLs, EPD’s main focus, also have recovered from their pandemic lows, with production almost doubling. Ethane demand has exploded and ethane exports, which EPD dominates, continue to climb.
And that’s just the short term.
November 2022 investor presentation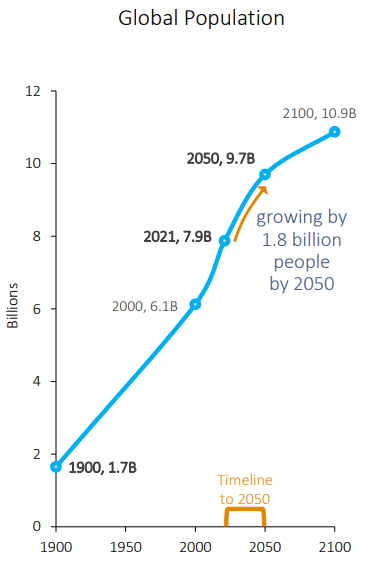
With the global population expected to rise by nearly 2 billion people by 2050, demand for all energy is going to soar. What about oil demand?
November 2022 investor presentation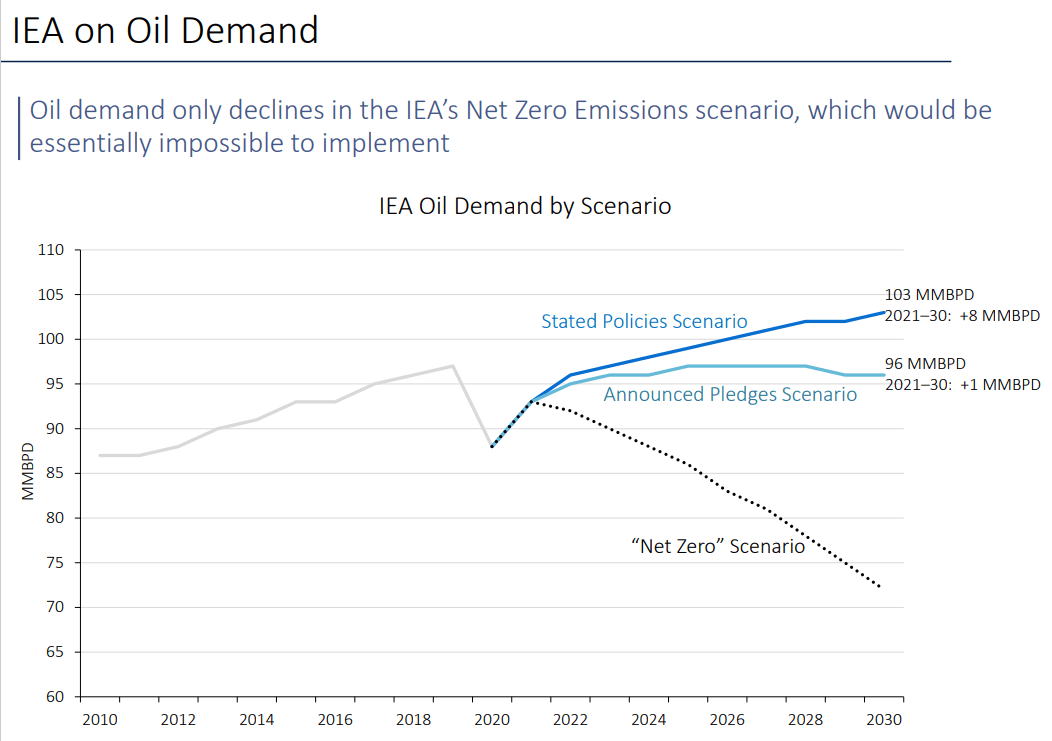
Based on the policies announced by world governments, the IEA expects oil demand to grow by 8 million barrels per day by 2030. Even if governments were to live up to their climate pledges (they aren’t even trying at the moment), oil demand would still grow by 1 million barrels per day.
November 2022 investor presentation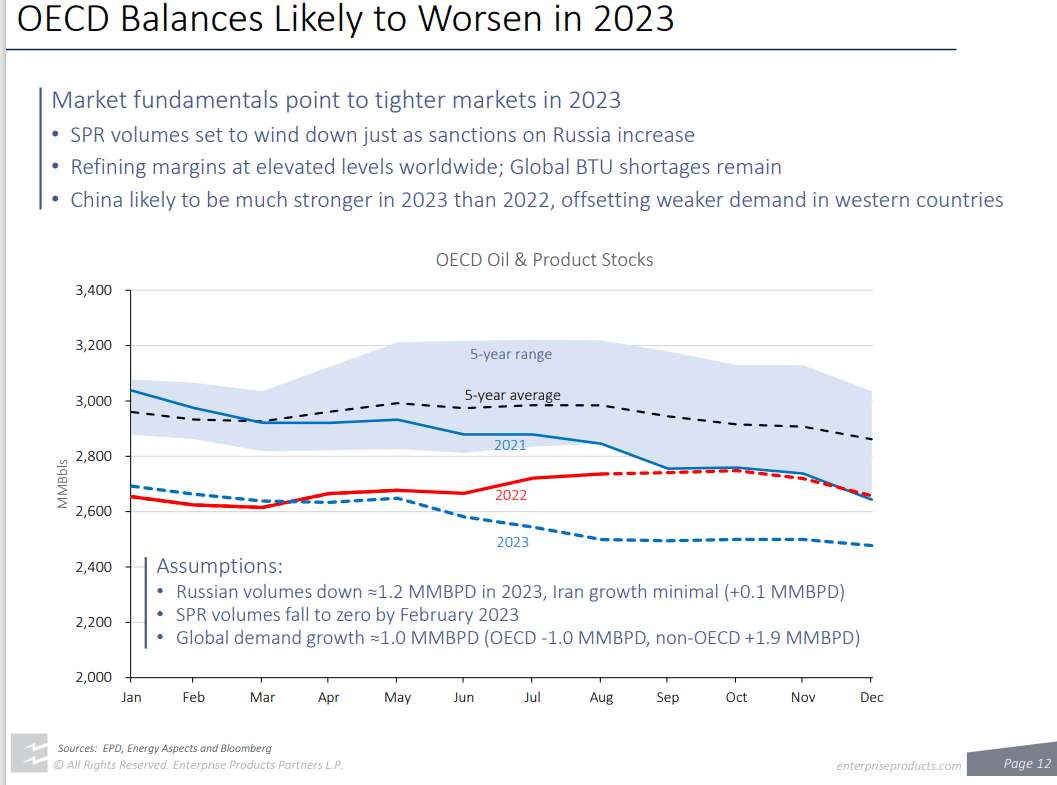
Even in a global recession in 2023, the energy supply crunch and incredible capital discipline from oil producers are expected to keep prices from crashing.
- midstream is usually a defensive industry in recessions
- and that’s likely to prove the case in 2023
November 2022 investor presentation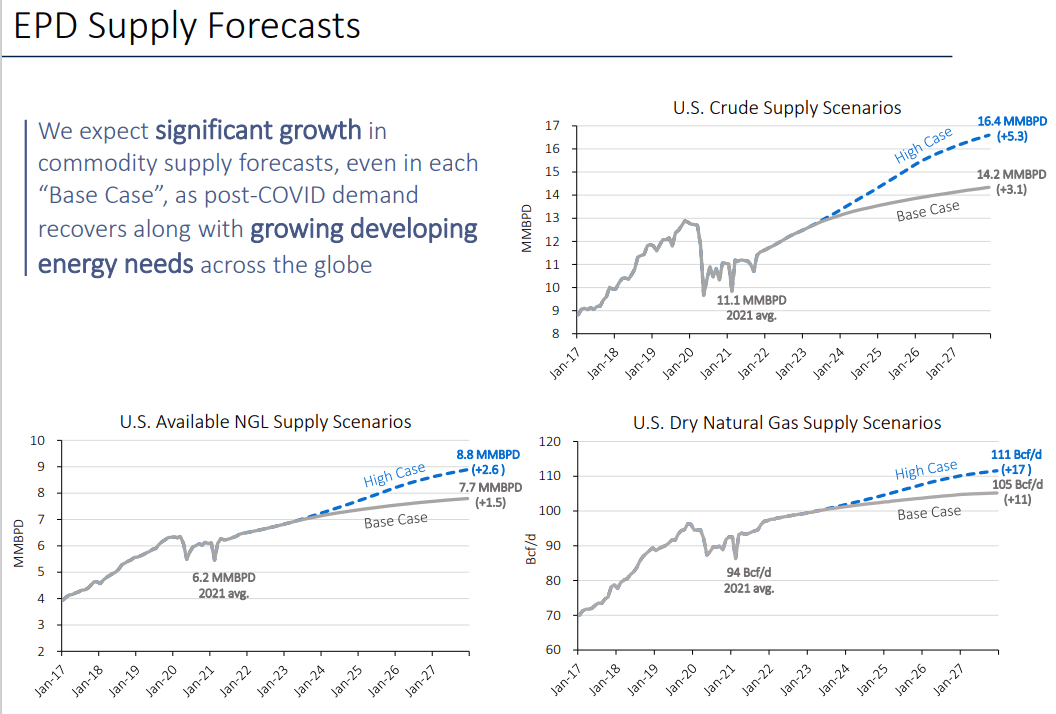
And in the medium term, the outlook for US energy remains solid, with our arsenal of democracy oil and gas reserves helping to win the war for democracy in Ukraine.
November 2022 investor presentation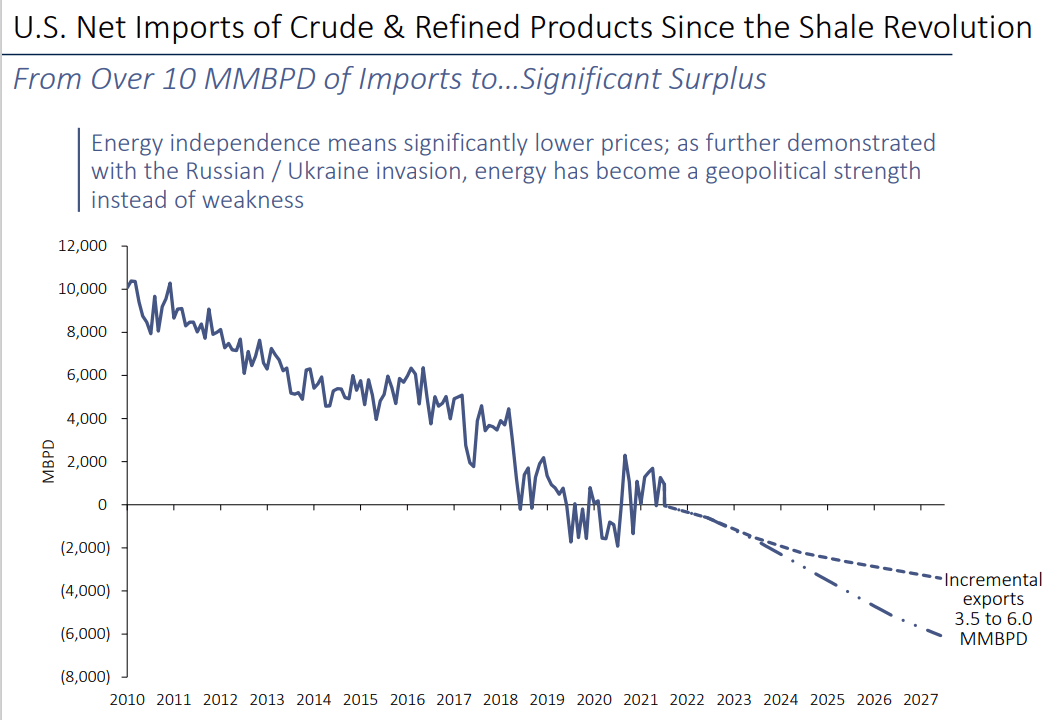
The US has gone from importing 10 million barrels per day in 2010 to exporting 3.6 million barrels per day now. And by 2027, that might rise to 6 million bpd.
- making the US the 3rd largest oil exporter in the world, behind Saudi Arabia and Russia
EPD is the No. 1 US oil exporter, with 2 million bpd of capacity.
- 56% of all US oil exports flow through EPD’s terminals
And EPD has recently announced plans to more than double its capacity to 4.4 million bpd by 2025.
- by 2027 73% of US oil exports could be flowing through EPD’s terminals
How stable is EPD’s business?
November 2022 investor presentation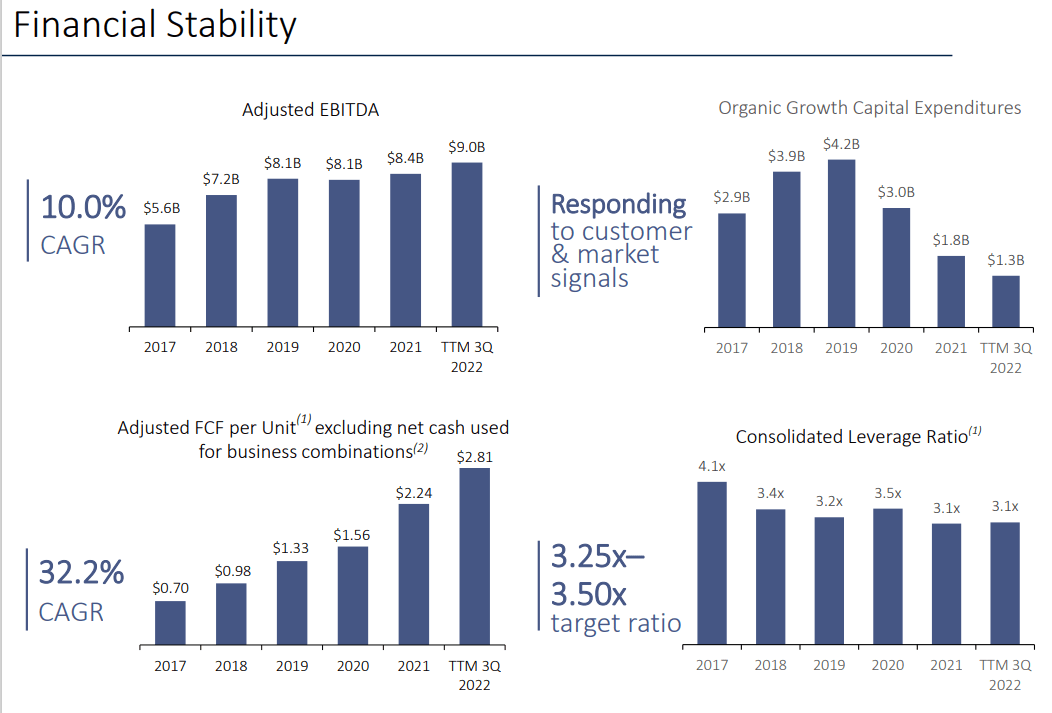
Oil hit -$38 in April 2020. Looking at EPD’s EBITDA and free cash flow per unit, you wouldn’t know that we were facing the worst oil crash in human history.
Today’s EPD’s balance sheet has never been stronger, with a leverage ratio of 3.1X.
- Rating agencies consider 5.0X debt/adjusted EBITDA safe for this industry
- BBB+ stable credit rating, tied for the strongest in the industry
- 5% 30-year bankruptcy risk according to S&P and Moody’s
November 2022 investor presentation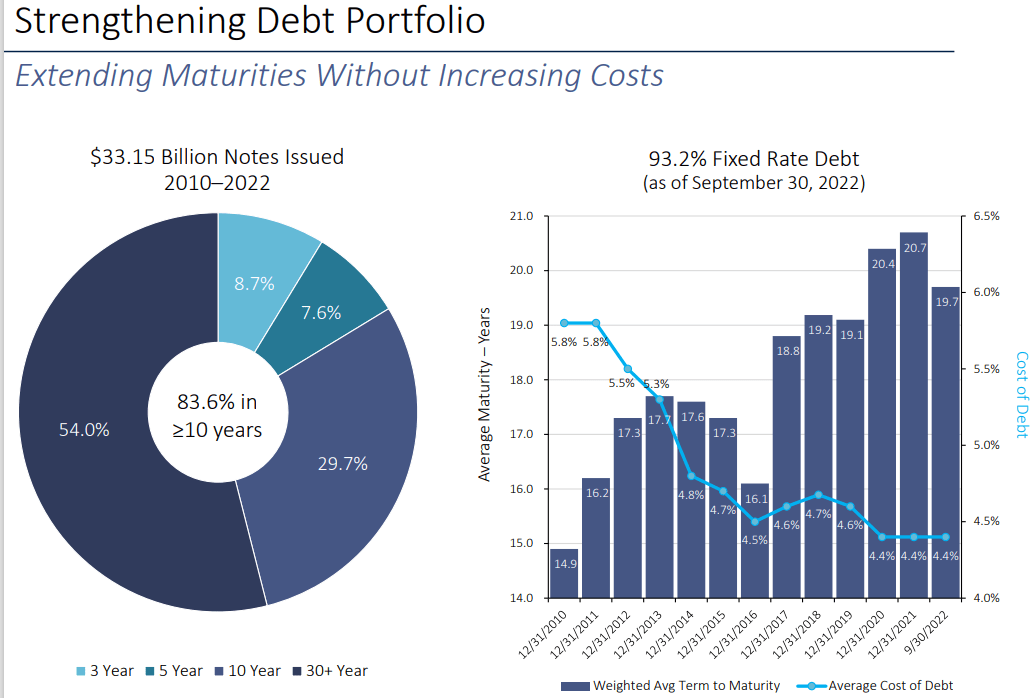
54% of its bonds mature in 30 years or more, and its average maturity is 20 years, with an average borrowing cost of 4.4%.
- 15% free cash flow margins in 2022 and 19% returns on invested capital
FactSet Research Terminal
The bond market is so confident in EPD’s energy transition plan that it will lend to it until 2078.
- Implying that EPD will still be a sound business even 55 years from now
What’s EPD’s energy transition plan?
November 2022 investor presentation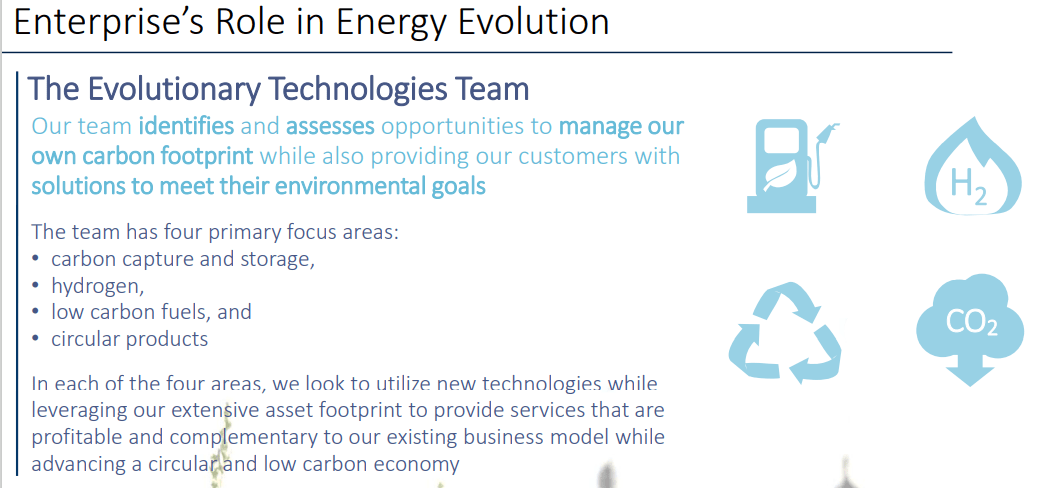
It’s planning to focus on carbon sequestration (partnering with Buffett’s favorite oil company OXY).
It’s planning on becoming a dominant player in hydrogen, a $3.5 trillion global industry in 2030, according to Cummins (CMI).
EPD has an entire team of experts hard at work planning how it will help the world adapt to a green energy future over the next 60 years.
November 2022 investor presentation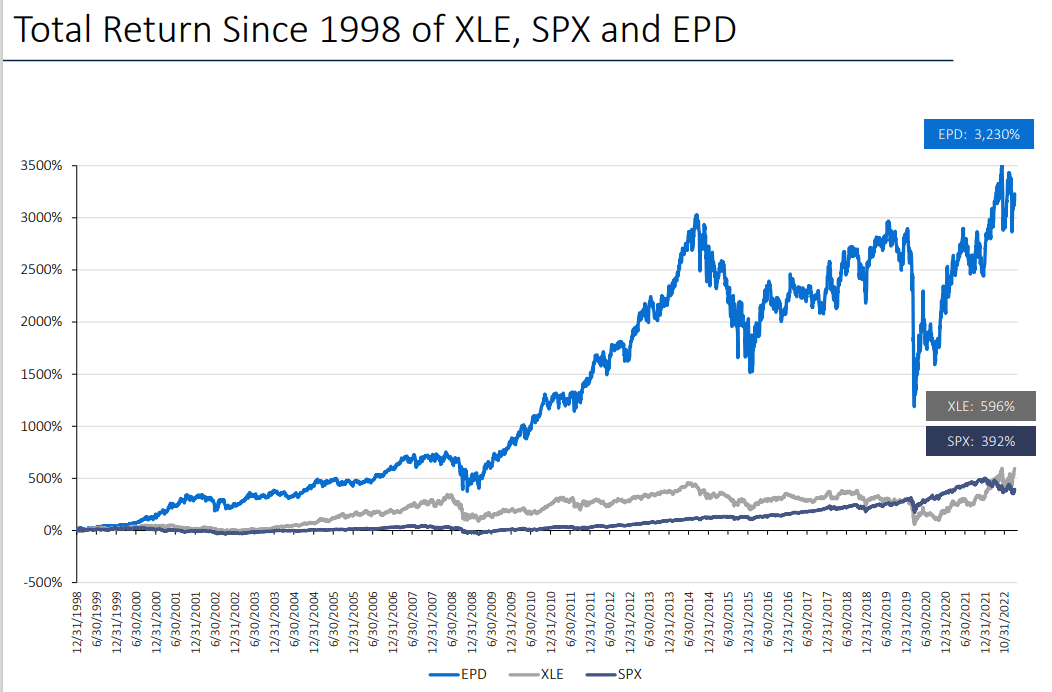
Ultimately the proof is in the pudding, and EPD’s market and sector-crushing long-term returns are the best evidence of all that EPD is an ultra-yield Ultra SWAN you can trust. Not just in the mild 2023 recession but in all economic conditions to come in the next 60 years.
More Reasons To Buy Enterprise Products Partners Today
| Metric | Enterprise Products Partners |
| Quality | 98% 13/13 Ultra SWAN (Sleep Well at Night) Midstream MLP |
| Risk Rating | Low Risk |
| DK Master List Quality Ranking (Out Of 500 Companies) | 34 |
| DK Master List Quality Percentile | 93% |
| Dividend Growth Streak (Years) | 24 |
| Dividend Yield | 7.8% |
| Dividend Safety Score | 100% |
| Average Recession Dividend Cut Risk | 0.5% |
| Severe Recession Dividend Cut Risk | 1.00% |
| S&P Credit Rating |
BBB+ Stable Outlook |
| 30-Year Bankruptcy Risk | 5.00% |
| LT S&P Risk-Management Global Percentile |
70% Good, Low-Risk |
| Fair Value | $30.92 |
| Current Price | $24.47 |
| Discount To Fair Value | 21% |
| DK Rating |
Potential Strong Buy |
| Price/Cash Flow | 6.7 |
| Growth Priced In | -3.6% |
| Historical Cash Flow | 10 to 12 |
| LT Growth Consensus/Management Guidance | 4.4% |
| 5-year consensus total return potential |
14% to 19% CAGR |
| Base Case 5-year consensus return potential |
16% CAGR (3X S&P 500) |
| Consensus 12-month total return forecast | 38% |
| Fundamentally Justified 12-Month Return Potential | 26% |
| LT Consensus Total Return Potential | 12.2% |
| Inflation-Adjusted Consensus LT Return Potential | 9.9% |
| Consensus 10-Year Inflation-Adjusted Total Return Potential (Ignoring Valuation) | 2.56 |
| LT Risk-Adjusted Expected Return | 8.11% |
| LT Risk-And Inflation-Adjusted Return Potential | 5.78% |
| Conservative Years To Double | 12.45 |
(Source: Dividend Kings Zen Research Terminal)
EPD is trading at 6.7X cash flow, an anti-bubble valuation pricing in -3.6% growth.
- as long as EPD grows faster than zero, the payout will always remain safe
- and long-term investors can’t lose money
- as long as they avoid becoming forced sellers for emotional or financial reasons
Enterprise Products 2024 Consensus Total Return Potential
(Source: FAST Graphs, FactSet)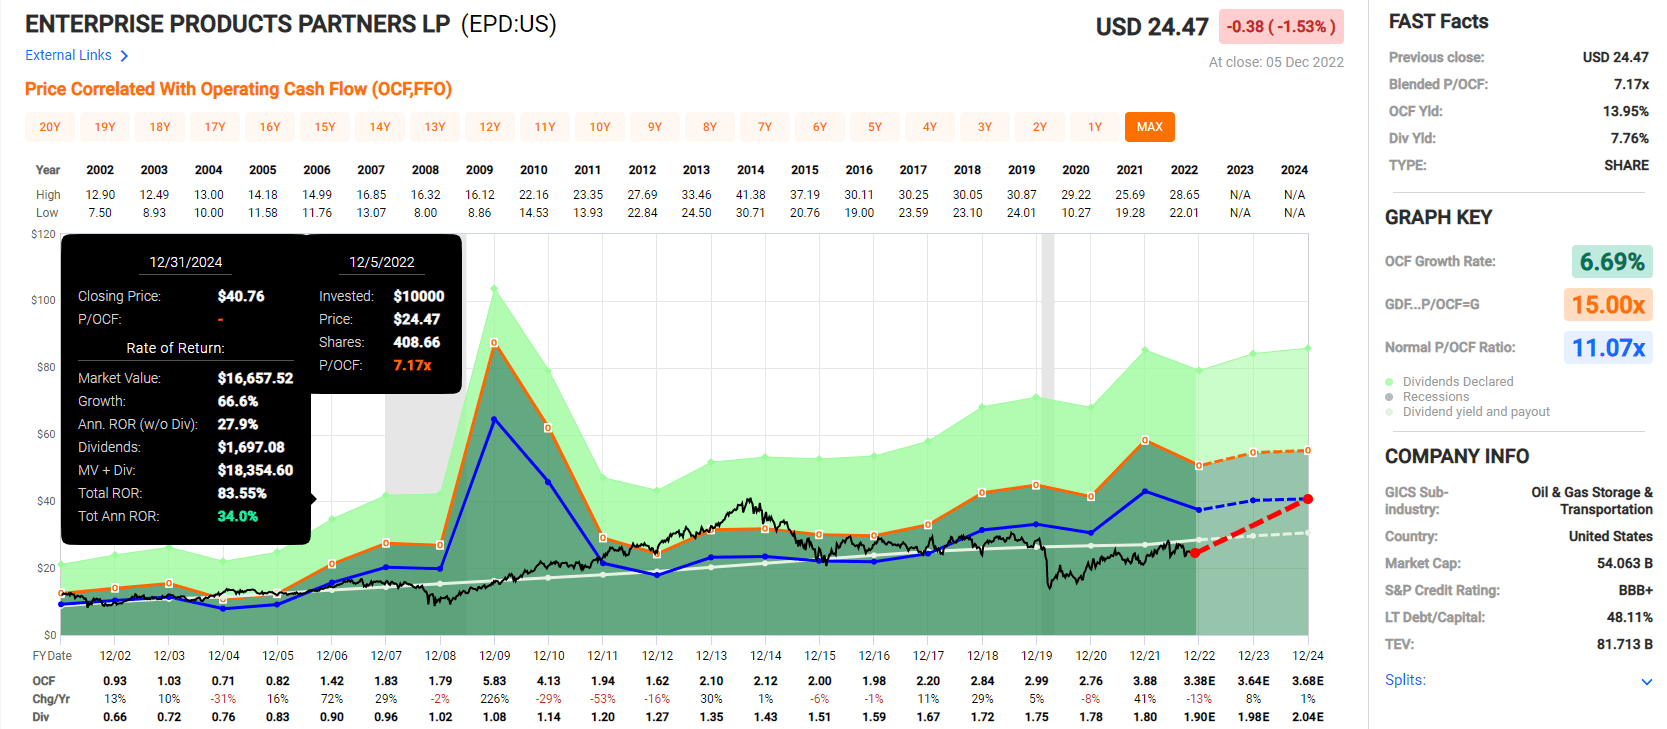
If EPD grows as expected through 2024 and returns to historical mid-range market-determined fair value of 11X cash flow, it could nearly double, delivering 34% annual returns.
- Buffett-like return potential from an anti-bubble blue-chip bargain hiding in plain sight
- 3X the S&P return consensus
Enterprise Products 2028 Consensus Total Return Potential
(Source: FAST Graphs, FactSet)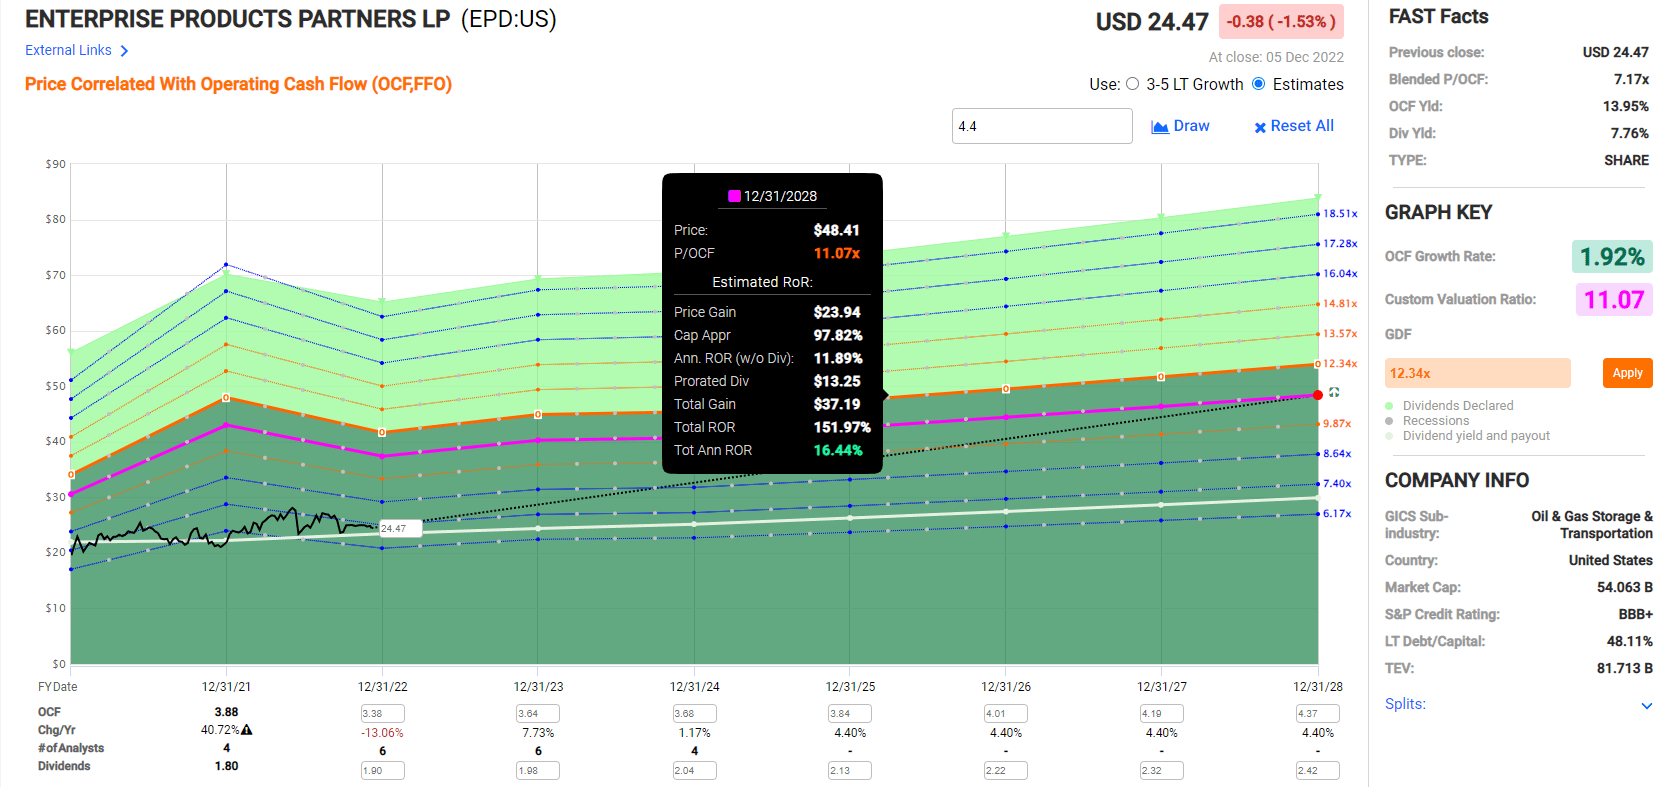
If EPD grows as expected over the next five years, it could deliver 150% total returns or 16% annually.
EPD Automated Investment Decision Score
DK Dividend Kings Automated Investment Decision Tool

EPD is a potentially excellent ultra-yield Ultra SWAN opportunity for anyone comfortable with its risk profile. Look at how it compares to the S&P 500.
- 21% discount to fair value vs. 3% premium S&P = 24% better valuation
- 7.8% safe yield vs. 1.7% (4.5X higher and much safer)
- approximately 12.2% long-term annual return potential vs. 10.2% CAGR S&P
- about 2X higher risk-adjusted expected returns
- 4X higher income potential over five years
Reason Two: Solid Growth Prospects For The Next 55 Years (At Least)
EPD is priced for -3.6% growth, trading at 6.7X cash flow. Here is what analysts actually expect in the medium term.
| Metric | 2021 Growth Consensus | 2022 Growth Consensus | 2023 Growth Consensus | 2024 Growth Consensus | 2025 Growth Consensus | 2026 Growth Consensus |
2027 Growth Consensus |
| Sales | 56% | 38% | 1% | 1% | NA | NA | NA |
| Distribution | 2% | 6% (Official) | 4% | 5% | 1% | 4% | 7% |
| Operating Cash Flow | 41% | -13% | 8% | 1% | NA | NA | NA |
| Distributable Cash Flow | 3% | 15% | 1% | 3% | 1% | 6% | 6% |
| EBITDA | 19% | 10% | 1% | 2% | NA | NA | NA |
| EBIT (operating income) | 31% | 8% | 2% | 2% | NA | NA | NA |
(Source: FAST Graphs, FactSet)
This isn’t what a value trap looks like, which becomes apparent in the long-term outlook.
EPD Long-Term Growth Outlook
FactSet Research Terminal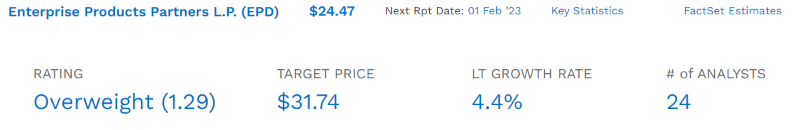
The median long-term growth consensus from EPD is 4.4%. Just 2% lower than its 20-year growth rate.
How accurate are analyst forecasts for EPD?
FAST Graphs, FactSet
Smoothing for outliers, analyst margins-of-error are 15% to the downside and 10% to the upside.
- 4% to 6% CAGR margin-of-error adjusted growth consensus range
FAST Graphs, FactSet FAST Graphs, FactSet FAST Graphs, FactSet FAST Graphs, FactSet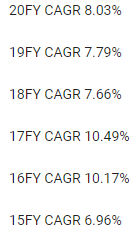
EPD’s consensus growth range is at the low end of its historical growth range, outside of the worst oil crash in human history.
And given its growth plans in hydrogen and carbon sequestration (CO2 pipelines), I consider those estimates reasonable.
Consensus Long-Term Total Return Potential (Ignoring Valuation)
| Investment Strategy | Yield | LT Consensus Growth | LT Consensus Total Return Potential | Long-Term Risk-Adjusted Expected Return | Long-Term Inflation And Risk-Adjusted Expected Returns | Years To Double Your Inflation & Risk-Adjusted Wealth |
10-Year Inflation And Risk-Adjusted Expected Return |
| Enterprise Products Partners | 7.8% | 4.4% | 12.2% | 8.5% | 6.2% | 11.6 | 1.83 |
| Safe Midstream | 5.9% | 6.4% | 12.3% | 8.6% | 6.3% | 11.5 | 1.84 |
| REITs | 3.9% | 6.1% | 10.0% | 7.0% | 4.7% | 15.4 | 1.58 |
| Schwab US Dividend Equity ETF | 3.5% | 8.5% | 12.0% | 8.4% | 6.0% | 11.9 | 1.80 |
| Dividend Aristocrats | 2.6% | 8.5% | 11.1% | 7.8% | 5.4% | 13.2 | 1.70 |
| S&P 500 | 1.7% | 8.5% | 10.2% | 7.1% | 4.8% | 15.0 | 1.60 |
(Sources: DK Research Terminal, FactSet, Morningstar, FactSet)
There are higher-yielding stocks than EPD. There are faster-growing blue-chips than EPD. But there’s no 100% safety score, 8% yielding Ultra-SWANs with superior return potential than the aristocrats, S&P, and even SCHD.
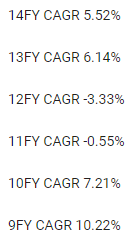
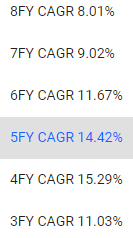
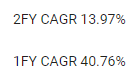
Inflation-Adjusted Consensus Total Return Potential: $1,000 Initial Investment
| Time Frame (Years) | 8.0% CAGR Inflation-Adjusted S&P 500 Consensus | 8.8% Inflation-Adjusted Aristocrat Consensus | 9.9% CAGR Inflation-Adjusted EPD Consensus | Difference Between Inflation-Adjusted EPD Consensus And S&P Consensus |
| 5 | $1,468.65 | $1,526.66 | $1,603.20 | $134.55 |
| 10 | $2,156.93 | $2,330.70 | $2,570.26 | $413.33 |
| 15 | $3,167.77 | $3,558.19 | $4,120.65 | $952.88 |
| 20 | $4,652.33 | $5,432.16 | $6,606.23 | $1,953.90 |
| 25 | $6,832.64 | $8,293.08 | $10,591.13 | $3,758.49 |
| 30 (retirement time frame) | $10,034.74 | $12,660.73 | $16,979.73 | $6,944.99 |
| 35 | $14,737.50 | $19,328.67 | $27,221.95 | $12,484.45 |
| 40 | $21,644.21 | $29,508.37 | $43,642.31 | $21,998.10 |
| 45 | $31,787.72 | $45,049.33 | $69,967.47 | $38,179.75 |
| 50 | $46,684.97 | $68,775.14 | $112,172.04 | $65,487.07 |
| 55 (bond market time frame) | $68,563.78 | $104,996.45 | $179,834.53 | $111,270.75 |
| 60 | $100,696.06 | $160,294.18 | $288,311.22 | $187,615.16 |
| 100 | $2,179,486.17 | $4,730,019.35 | $12,582,566.73 | $10,403,080.56 |
(Source: DK Research Terminal, FactSet)
EPD offers 17X inflation-adjusted return potential over the next 30 years and 180X over the bond market’s time frame of 55 years.
| Time Frame (Years) | Ratio Inflation-Adjusted EPD Consensus/Aristocrat Consensus | Ratio Inflation-Adjusted EPD Consensus vs. S&P consensus |
| 5 | 1.05 | 1.09 |
| 10 | 1.10 | 1.19 |
| 15 | 1.16 | 1.30 |
| 20 | 1.22 | 1.42 |
| 25 | 1.28 | 1.55 |
| 30 | 1.34 | 1.69 |
| 35 | 1.41 | 1.85 |
| 40 | 1.48 | 2.02 |
| 45 | 1.55 | 2.20 |
| 50 | 1.63 | 2.40 |
| 55 | 1.71 | 2.62 |
| 60 | 1.80 | 2.86 |
| 100 | 2.66 | 5.77 |
(Source: DK Research Terminal, FactSet)
Significantly more wealth than the S&P or aristocrats and almost 5X the much safer yield on day one.
Reason Three: A Wonderful Company At A Wonderful Price
(Source: FAST Graphs, FactSet) (Source: FAST Graphs, FactSet) (Source: FAST Graphs, FactSet)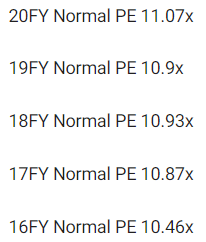
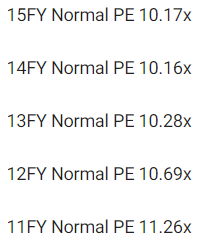
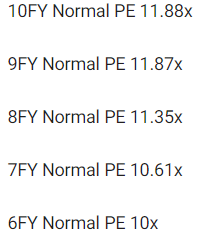
For 20 years, outside of bear markets and bubbles, millions of income investors have consistently paid between 10 and 12X cash flow for EPD.
- 91% statistical probability that this approximates intrinsic value
To be extra conservative, we’re also using historical yield fair values.
| Metric | Historical Fair Value Multiples (all years) | 2021 | 2022 | 2023 | 2024 |
12-Month Forward Fair Value |
| 5-Year Average Yield | 7.19% | $25.31 | $26.43 | $26.43 | $28.79 | |
| 13-Year Median Yield | 5.97% | $30.49 | $31.83 | $31.83 | $34.67 | |
| 24-Year Average Yield | 6.69% | $27.20 | $28.40 | $28.40 | $30.94 | |
| Operating Cash Flow | 11.07 | $42.95 | $37.42 | $40.29 | $40.96 | |
| Average | $30.22 | $30.49 | $30.94 | $33.25 | $30.92 | |
| Current Price | $24.47 | |||||
|
Discount To Fair Value |
19.04% | 19.74% | 20.91% | 26.40% | 20.86% | |
|
Upside To Fair Value (NOT Including Dividends) |
23.51% | 24.59% | 26.43% | 35.87% | 26.36% | |
| 2022 OCF | 20223 OCF | 2022 Weighted OCF | 2023 Weighted OCF | 12-Month Forward OCF | 12-Month Average Fair Value Forward P/OCF |
Current Forward P/OCF |
| $3.38 | $3.64 | $0.13 | $3.50 | $3.63 | 8.52 | 6.74 |
Even being extra conservative, I estimate EPD is worth at least 8.5X cash flow, and today it trades at 6.7X.
| Rating | Margin Of Safety For Low Risk 13/13 Ultra SWAN Quality Companies | 2022 Fair Value Price | 2023 Fair Value Price |
12-Month Forward Fair Value |
| Potentially Reasonable Buy | 0% | $30.49 | $30.94 | $30.92 |
| Potentially Good Buy | 5% | $28.96 | $29.39 | $29.37 |
| Potentially Strong Buy | 15% | $25.91 | $26.30 | $26.28 |
| Potentially Very Strong Buy | 25% | $21.72 | $23.20 | $23.19 |
| Potentially Ultra-Value Buy | 35% | $19.82 | $20.11 | $20.10 |
| Currently | $24.47 | 19.74% | 20.91% | 20.86% |
| Upside To Fair Value (Including Dividends) | 32.36% | 34.20% | 34.13% |
EPD is a potentially strong buy for anyone comfortable with its risk profile.
- During the Pandemic, it bottomed at a very safe 17% yield and 65% discount to fair value, 4.9X cash flow
Risk Profile: Why Enterprise Products Isn’t Right For Everyone
There are no risk-free companies, and no company is right for everyone. You have to be comfortable with the fundamental risk profile.
EPD’s Risk Profile Includes
- heavy bet on NGLs (nearly 85% of the growth budget)
- regulatory/political risk ( interstate projects)
- litigation risk (interstate projects and industrial accidents)
- industrial accident risk (can cost over $1 billion each to clean up)
- green energy transition execution risk
- M&A execution risk
- talent retention risk
- supply chain disruption risk (causing havoc globally right now)
- cyber security risk: hackers and ransomware (pipelines are now targets)
- virtually no say in how the LP is run
How do we quantify, monitor, and track such a complex risk profile? By doing what big institutions do.
Long-Term Risk Management Analysis: How Large Institutions Measure Total Risk Management
DK uses S&P Global’s global long-term risk-management ratings for our risk rating.
- S&P has spent over 20 years perfecting their risk model
- which is based on over 30 major risk categories, over 130 subcategories, and 1,000 individual metrics
- 50% of metrics are industry specific
- this risk rating has been included in every credit rating for decades
The DK risk rating is based on the global percentile of how a company’s risk management compares to 8,000 S&P-rated companies covering 90% of the world’s market cap.
EPD scores 70th Percentile On Global Long-Term Risk Management
S&P’s risk management scores factor in things like:
- supply chain management
- crisis management
- cyber-security
- privacy protection
- efficiency
- R&D efficiency
- innovation management
- labor relations
- talent retention
- worker training/skills improvement
- occupational health & safety
- customer relationship management
- business ethics
- climate strategy adaptation
- sustainable agricultural practices
- corporate governance
- brand management
EPD’s Long-Term Risk Management Is The 207th Best In The Master List 59th Percentile In The Master List)
| Classification | S&P LT Risk-Management Global Percentile |
Risk-Management Interpretation |
Risk-Management Rating |
| BTI, ILMN, SIEGY, SPGI, WM, CI, CSCO, WMB, SAP, CL | 100 | Exceptional (Top 80 companies in the world) | Very Low Risk |
| Strong ESG Stocks | 86 |
Very Good |
Very Low Risk |
| Foreign Dividend Stocks | 77 |
Good, Bordering On Very Good |
Low Risk |
| Ultra SWANs | 74 | Good | Low Risk |
| Enterprise Products Partners | 70 | Good | Low Risk |
| Dividend Aristocrats | 67 | Above-Average (Bordering On Good) | Low Risk |
| Low Volatility Stocks | 65 | Above-Average | Low Risk |
| Master List average | 61 | Above-Average | Low Risk |
| Dividend Kings | 60 | Above-Average | Low Risk |
| Hyper-Growth stocks | 59 | Average, Bordering On Above-Average | Medium Risk |
| Dividend Champions | 55 | Average | Medium Risk |
| Monthly Dividend Stocks | 41 | Average | Medium Risk |
(Source: DK Research Terminal)
EPD’s risk-management consensus is in the top 41% of the world’s best blue-chips, and is similar to:
- Hormel Foods (HRL): Ultra SWAN dividend king
- Procter & Gamble (PG): Ultra SWAN dividend king
- Realty Income (O): Ultra SWAN dividend aristocrat
- Nike (NKE): Ultra SWAN
- Amazon (AMZN): Ultra SWAN
The bottom line is that all companies have risks, and EPD is good at managing theirs, according to S&P.
How We Monitor EPD’s Risk Profile
- 24 analysts
- three credit rating agencies
- 27 experts who collectively know this business better than anyone other than management
- the bond market for real-time fundamental risk-assessment
When the facts change, I change my mind. What do you do, sir?” – John Maynard Keynes
There are no sacred cows at iREIT or Dividend Kings. Wherever the fundamentals lead, we always follow. That’s the essence of disciplined financial science, the math behind retiring rich and staying rich in retirement.
Bottom Line: Buy This 8% Yielding 2023 Dividend Aristocrat Before Everyone Else Does
Let me be clear: I’m NOT calling the bottom in EPD (I’m not a market-timer).
Ultra SWAN quality does NOT mean “can’t fall hard and fast in a bear market.”
Fundamentals are all that determine safety and quality, and my recommendations.
- over 30+ years, 97% of stock returns are a function of pure fundamentals, not luck
- in the short term; luck is 25X as powerful as fundamentals
- in the long term, fundamentals are 33X as powerful as luck
While I can’t predict the market in the short term, here’s what I can tell you about EPD.
- The highest quality midstream on Wall Street and one of the best blue-chips on earth
- quality in the top 7% of the world’s best blue-chips
- very safe 7.8% yield (almost 5X the S&P yield growing 3.2% per year)
- 12.2% annual long-term total consensus better than the S&P, aristocrats, and SCHD
- 21% historically undervalued, a potentially strong buy
- 6.7X cash flow vs 10X to 12X historical
- anti-bubble blue-chip priced for -3.6% growth but growing at 4.4%.
- 152% consensus return potential over the next five years, 16% CAGR, 3X better than the S&P 500
- 2X the risk-adjusted expected returns of the S&P 500 over the next five years
- 4X the income potential of the S&P over the next five years
If you want the pinnacle of safe 8% yield, consider EPD.
If you want to sleep well at night in even the most extreme economic and market crashes, EPD has more than proven itself over 24 years.
If you want to make your own luck on Wall Street, then EPD is a great choice today.
Most importantly, if you want to feel like a stock market genius in 5+ years and set yourself up to potentially retire in safety and splendor, EPD is one of the smartest and safest choices you can make today.
Be the first to comment