

Pgiam/iStock via Getty Images
Investing Thesis
Rule #1: Never commit capital beyond an able-to-forecast horizon. Often this means Active strategies with specific exit conditions and times, with revalue and reinvest actions allowable, as stated here.
21st-century equity investing requires shorter than annual forecast horizons because progress’s pace of technology, communication, competition, and their accompanied peril disallow the patience required by most lengthy judgments.
When short-term net profits taken pay multiples of any taxes involved their present values permit many advantages otherwise denied to the individual investor’s specific circumstances.
Our standard: to provide comparable Reward~Risk balance measures between investment candidates involving uncertainty of outcome but are free of deception other than factual ignorance, offering assessable and renewable goals. Minimize regrets paid in non-retrievable losses of “forgotten” time.
This analysis points to Entegris, Inc. (NASDAQ:ENTG) as one of the best current solar-involved stock investments.
Description of the Subject Company
Entegris, Inc. develops, manufactures, and supplies microcontamination control products, specialty chemicals, and advanced materials handling solutions in North America, Taiwan, China, South Korea, Japan, Europe, and Southeast Asia. The company’s customers include manufacturers and suppliers in the solar industries, electrical discharge machining customers, glass and glass container manufacturers, aerospace manufacturers, and manufacturers of biomedical implantation devices. Entegris, Inc. was founded in 1966 and is headquartered in Billerica, Massachusetts.
Source: Yahoo Finance
Yahoo Finance
Solar Energy Competitor Investment Alternatives
As a new-technology industry of photovoltaics this draws importantly on the semiconductor business and its dependent supporting activities. Some of the involved industries turn out to have leveraged importances.
Figure 1
blockdesk.com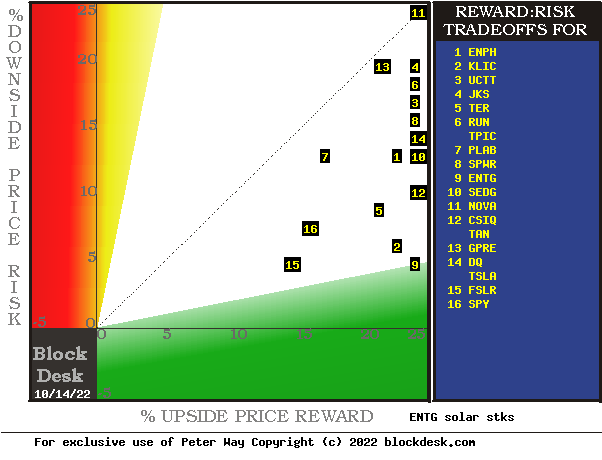
(used with prior permission)
The tradeoffs here are between near-term upside price gains (green horizontal scale) seen worth protecting against by Market-makers with short positions in each of the stocks, and the prior actual price drawdowns experienced during holdings of those stocks (red vertical scale). Both scales are of percent change from zero to 25%.
The intersection of those coordinates by the numbered positions is identified by the stock symbols in the blue field to the right.
The dotted diagonal line marks the points of equal upside price change forecasts derived from Market-Maker [MM] hedging actions and the actual worst-case price drawdowns from positions that could have been taken following prior MM forecasts like today’s.
Our principal interest is in ENTG at location [9]. A “market index” norm of reward~risk tradeoffs is offered by SPDR S&P 500 Index ETF (SPY) at [16].
Those forecasts are implied by the self-protective behaviors of MMs who must usually put firm capital at temporary risk to balance buyer and seller interests in helping big-money portfolio managers make volume adjustments to multi-billion-dollar portfolios. The protective hedging actions taken with real-money bets define daily the extent of likely expected specific price changes for thousands of stocks and ETFs.
This map is a good starting point, but it can only cover some of the investment characteristics that often should influence an investor’s choice of where to put his/her capital to work. The table in Figure 2 covers the above considerations and several others.
Comparing Alternative Investments
Figure 2
blockdesk.com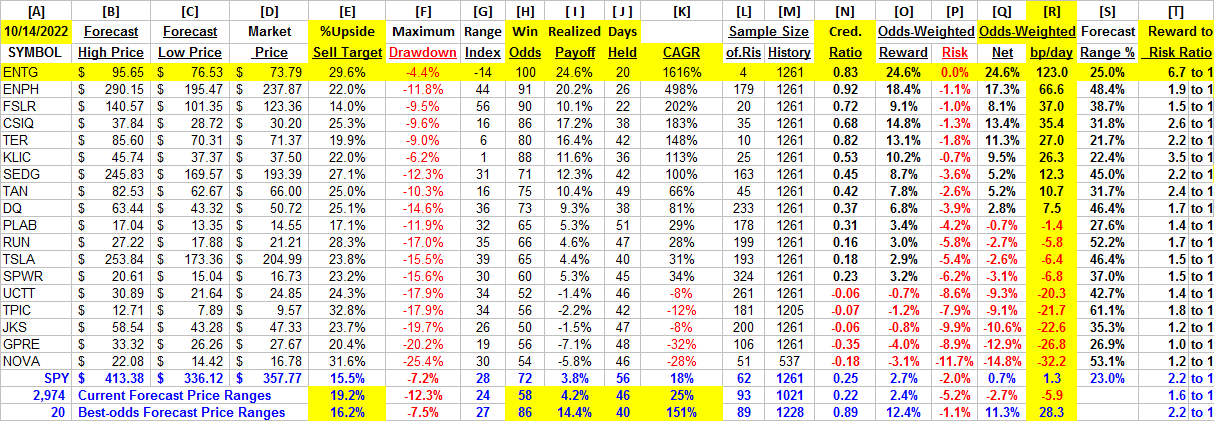
(used with permission)
Column headers for Figure 2 define elements for each row stock whose symbol appears at the left in column [A]. The elements are derived or calculated separately for each stock, based on the specifics of its situation and current-day MM price-range forecasts. Data in red numerals are negative, usually undesirable to “long” holding positions. Table cells with yellow fills are of data for the stock of principal interest and of all issues at the ranking column, [R].
Readers familiar with our analysis methods may wish to skip to the next section viewing price range forecast trends for ENTG.
Figure 2’s purpose is to attempt universally comparable measures, stock by stock, of a) How BIG the price gain payoff may be, b) how LIKELY the payoff will be a profitable experience, c) how soon it may happen, and d) what price drawdown RISK may be encountered during its holding period.
The price-range forecast limits of columns [B] and [C] get defined by MM hedging actions to protect firm capital required to be put at risk of price changes from volume trade orders placed by big-$ “institutional” clients.
[E] measures potential upside risks for MM short positions created to fill such orders, and reward potentials for the buy-side positions so created. Prior forecasts like the present provide a history of relevant price draw-down risks for buyers. An average of the most severe ones actually encountered are in [F], during holding periods in effort to reach [E] gains. Those are where buyers are most likely to accept losses.
[H] tells what proportion of the [L] sample of prior like forecasts have earned gains by either having price reach its [B] target or be above its [D] entry cost at the end of a 3-month max-patience holding period limit. [ I ] gives the net gains-losses of those [L] experiences and [N] suggests how credible [E] may be compared to [ I ].
Further Reward~Risk tradeoffs involve using the [H] odds for gains and the 100 – H loss odds as weights for N-conditioned [E] and for [F], for a combined-return score [Q]. The typical position holding period [J] on [Q] provides a figure of merit [fom] ranking measure [R] useful in portfolio position preferences. Figure 2 is row-ranked on [R] among candidate securities, with ENTG yellow-row identified.
Along with the candidate-specific stocks these selection considerations are provided for the averages of over 3,000 stocks for which MM price-range forecasts are available today, and 20 of the best-ranked (by fom) of those forecasts, as well as the forecast for S&P 500 Index ETF.
Recent Trends in ENTG MM Price-Range Forecasts
Figure 3
blockdesk.com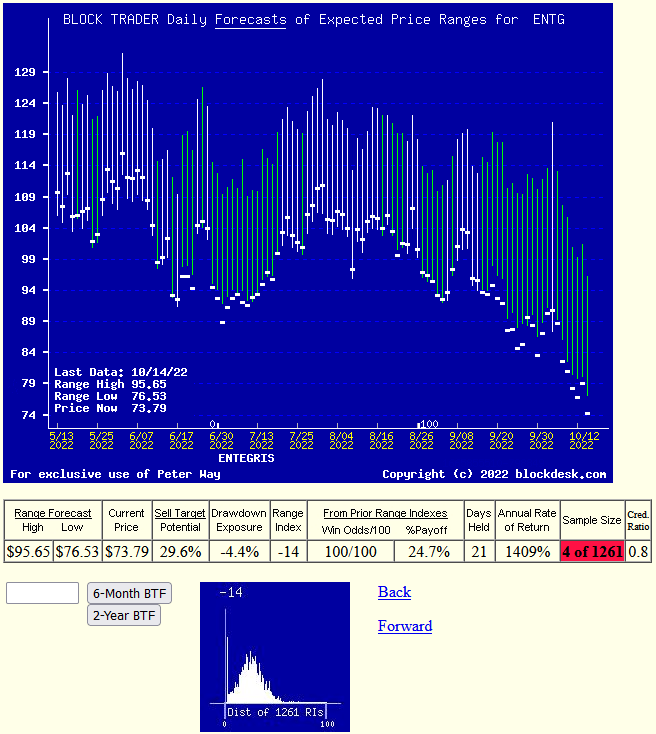
Used with prior permission
This picture is not a “technical chart” of past prices for ENTG. Instead, its vertical lines show the past 6 months of daily price range forecasts of market actions yet to come in the next few months. The only past information there is the heavy dot of the closing stock price on the day of each forecast.
That data splits the price range opposite forecasts into upside and downside prospects. Their trends over time provide additional insights into coming potentials, and helps keep perspective on what may be coming. The present situation is one where the current market price is actually below the lowest price expected by hedgers dedicated to profit from MMs concern over higher prices becoming an additional cost to their position.
The small picture at the bottom of Figure 3 is a frequency distribution of the Range Index’s appearance daily during the past 5 years of daily forecasts. The Range Index [RI] tells how much the downside of the forecast range occupies of that percentage of the entire range each day, and its frequency suggests what may seem “normal” for that stock, in the expectations of its evaluators’ eyes. A RI of only -14 (out of 100), says that an additional 14% to the downside could be regarded as reasonable adding to what might get to a further payoff for the speculators, depending on how the hedge deal is constructed.
Here the present level is near its least frequent, lowest-cost presence, encouraging the acceptance that we are looking at a realistic evaluation for ENTG buyers. Nearly all past RIs have been above the present RI, indicating there is additional room for an even more positive outlook.
Conclusion
Among these alternative investments explicitly compared Entegris, Inc. appears to be a logical buy preference now for investors seeking near-term capital gain.
Be the first to comment