

CHUNYIP WONG
If investors haven’t seen the latest SEC Form 4 filings, Kelcy Warren made 2 purchases last week, acquiring an additional 3 million units of ET. Mr. Warren has increased his total ownership of Energy Transfer (NYSE:ET) to 284,799,984 units valued at $3.36 billion based on the closing unit price of $11.81. Within the midstream sector, it’s hard to tell which executive is disliked more, Richard Kinder from Kinder Morgan (KMI) or Kelcy Warren. Some of ET’s unitholders blame Mr. Warren for ET’s sizeable debt position and declining unit price, as they believe debt reduction should have taken priority over expansion. The entire midstream industry fell on hard times during the oil crash in 2015, and the entire sector witnessed large declines in its unit prices, not just ET. Many unitholders probably wish Mr. Warren would exit his position as they feel his influence over ET is one of the root causes of ET’s decline.
I am on the other side of the spectrum and see his recent purchases as bullish. Mr. Warren was purchasing units in 2017 when ET traded at $20 per unit, recently he was purchasing in 2021 and 2022 for under $10 per unit, and just last week, he continued to purchase more units 61.61% higher than where he purchased them back on 12/13/21. I believe Mr. Warren’s purchasing activity is just another bullish factor in the case for ET. ET continues to sign LNG agreements with overseas companies, recently entered into a 20-year LNG supply deal with Shell, and looks extremely undervalued compared to its midstream peers. I have been bullish on ET for years and have reinvested every distribution I have received. I still see ET as the best opportunity in the midstream space as the distribution continues to increase and units slowly grind higher back to pre-pandemic levels.
Openinsider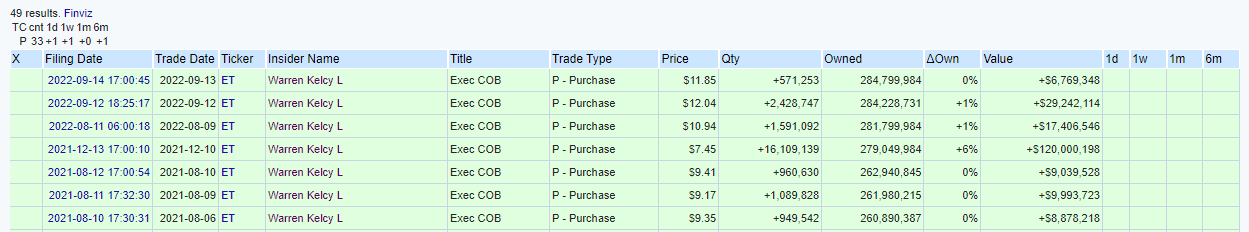
Energy Transfer is delivering on its promise of returning capital to unitholders while maintaining its target leverage ratio of 4.0x-4.5x debt to EBITDA
Similar to many companies, ET was forced to reduce its distribution during the height of the pandemic. ET’s quarterly distribution was reduced from $0.3050 to $0.1525. To some, this wasn’t well received as the main investment decision of entering into ET was for the large distributions. Not only did investors experience a significant decline in unit price over the years, but now the decision to reduce the distribution to concentrate on its debt to EBITDA level just chopped its distributed income in half.
Since the distribution was reduced, ET has delivered its 3rd consecutive quarterly distribution increase per unit. Investors endured $0.1525 for 5 straight quarters, and over the previous 3 quarters, ET has increased its quarterly distribution by 50.82%. ET has kept its promise to unitholders as the quarterly distribution has increased from $0.1525 to $0.175 in Q1 of 2022, $0.20 in Q2, and $0.23 in Q3.
Management has been transparent since the decision to reduce the distribution, and the latest earnings call provided additional insight into the future state of ET’s distribution. Tom Long, ET’s Co-CEO, indicated that future increases to ET’s distribution would be evaluated quarterly. Management’s goal is to return the distribution to $0.305 per quarter or $1.22 annually while balancing ET’s leverage ratio. Management will also look for growth opportunities and other ways to return capital to shareholders, such as conducting unit buybacks.
As an income investor, the last thing I want to find out is that one of my investments is slashing the distribution. In the case of ET, I wasn’t as upset, because I agreed with the reasoning. Reallocating the capital allowed them to acquire Enable Midstream, strengthen their operations, and reduce their leverage ratio. Last quarter, ET had $730 million in excess distributable income after $710 million went toward its distributions, and $440 million was deployed to grow projects. ET generates distributable cash flow (DCF) hand over fist, and there is more than enough room to continue its distribution increases and get back to a $0.3050 quarterly distribution rate in 2023.
Seeking Alpha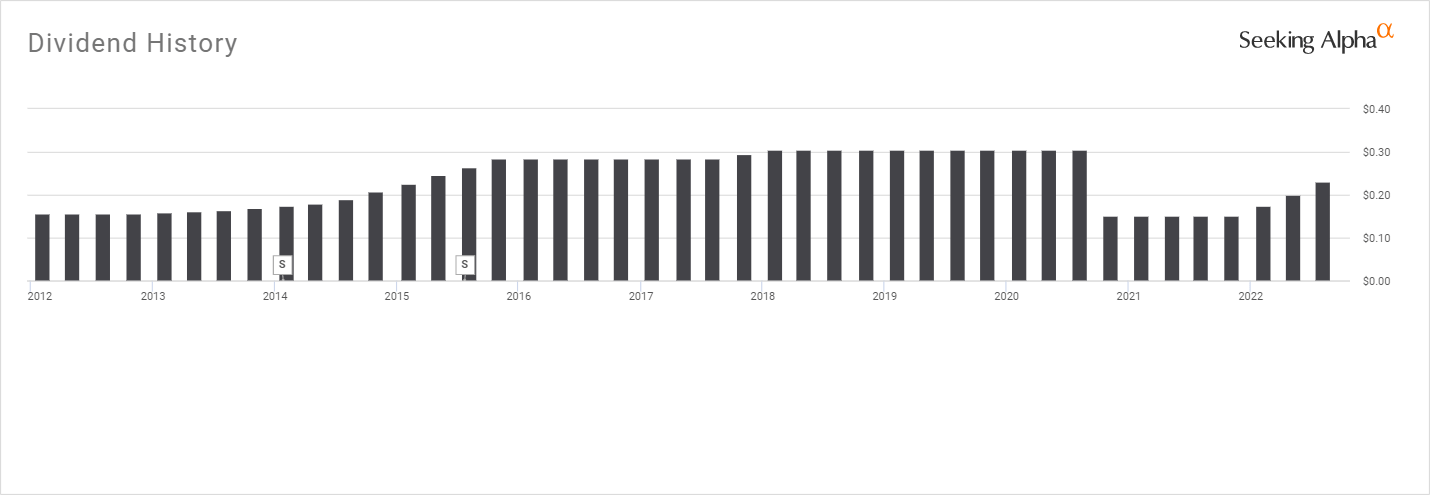
Energy Transfer is still drastically undervalued compared to its peer group and I believe fair value is somewhere around $20
Since my last article on ET, units have appreciated by 9.05%, while the S&P 500 has declined by -6.81%. With all of the midstream operators that I consider ET’s peer group, regardless of MLP status, I updated all the numbers to see how ET is valued compared to its peers. I also expanded the peer group from the last article and will compare ET to the following companies:
- Enterprise Products Partners (EPD)
- MPLX LP (MPLX)
- Kinder Morgan (KMI)
- Plains All American Pipeline (PAA)
- Williams Companies (WMB)
- Targa Resources (TRGP)
- Magellan Midstream Partners (MMP)
- ONEOK (OKE)
I have also added Enterprise Value to Adjusted EBITDA since several readers asked that this be a comparable metric in future articles. I will use the following metrics in the comparison:
- Adjusted EBITDA to Market Cap
- Enterprise Value to Adjusted EBITDA
- Distributable Cash Flow (DCF) to market cap
- Total Debt to Adjusted EBITDA
- Price to Sales
- Dividend Yield
Seeking Alpha Steven Fiorillo, Seeking Alpha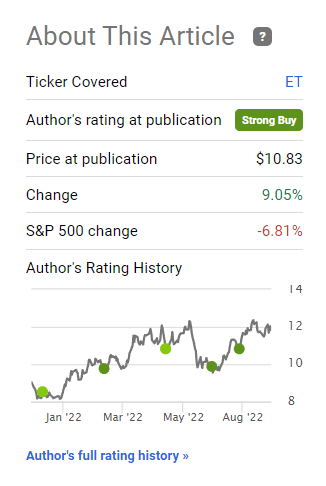

I will start with Enterprise Value to Adjusted EBITDA since this was requested by several readers. The EV/EBITDA metric is a popular valuation tool that helps investors compare companies as EV calculates a company’s total value or assessed worth, while EBITDA measures a company’s overall financial performance and profitability. As a point of reference, Investopedia indicates that “when evaluating a company, an EV/EBITDA value below 10 is seen as healthy.” From the 9 midstream operators, ET has the lowest EV/EBITDA ratio at 8.43x. The peer group average is 10.40x, indicating that the market is still discounting the value of ET’s units.
Steven Fiorillo, Seeking Alpha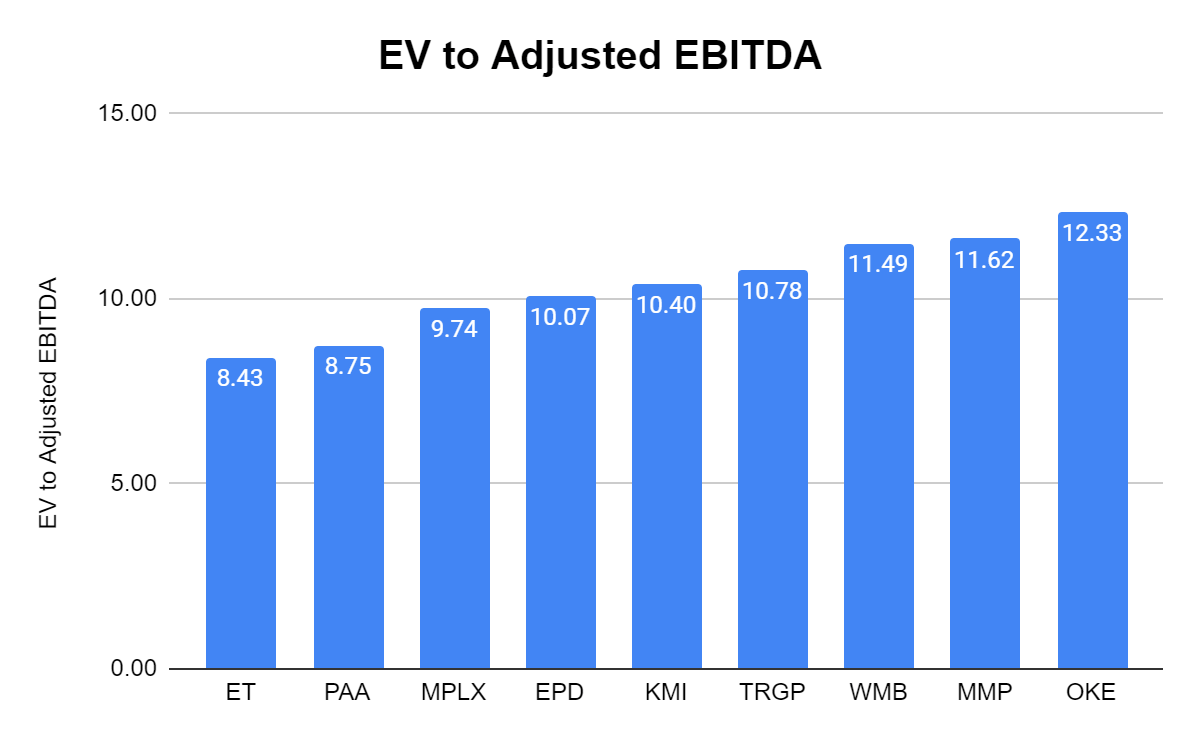
I review the Adjusted EBITDA to market cap ratio because Adjusted EBITDA (Earnings Before Interest, Taxes, Depreciation, and Amortization) basically tells you how much cash is left over after paying the business operating costs, excluding one-time charges. I want to see how much I am paying for a midstream operator’s Adjusted EBITDA. ET trades at 3.05x its Adjusted EBITDA while its peer group average is 5.83x. ET trades at almost half its peer group average and this is an indication that units are significantly undervalued.
Steven Fiorillo, Seeking Alpha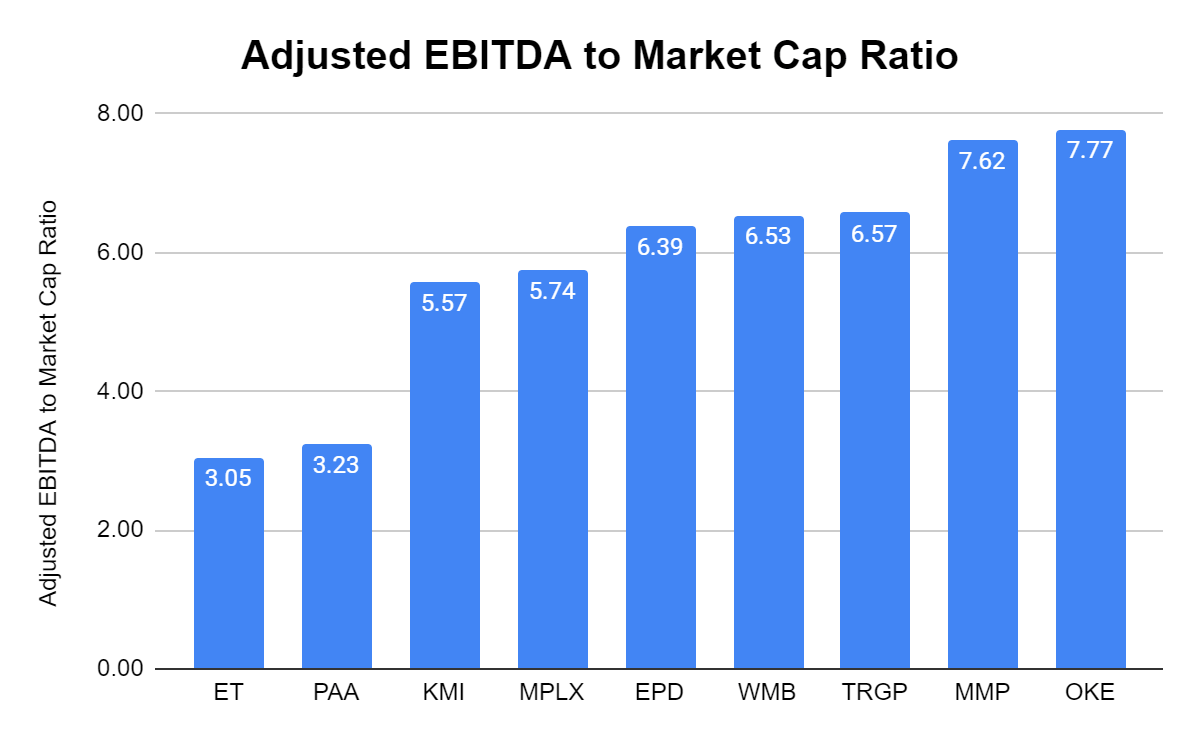
ET trades at a DCF to market cap ratio of 4.55x. WMB and OKE do not report DCF in their quarterly reports, so this is why their numbers are blank on this metric. From the other 7 companies, the DCF to market cap average is 7.06x. ET trades at the 2nd lowest valuation in its peer group on this metric.
Steven Fiorillo, Seeking Alpha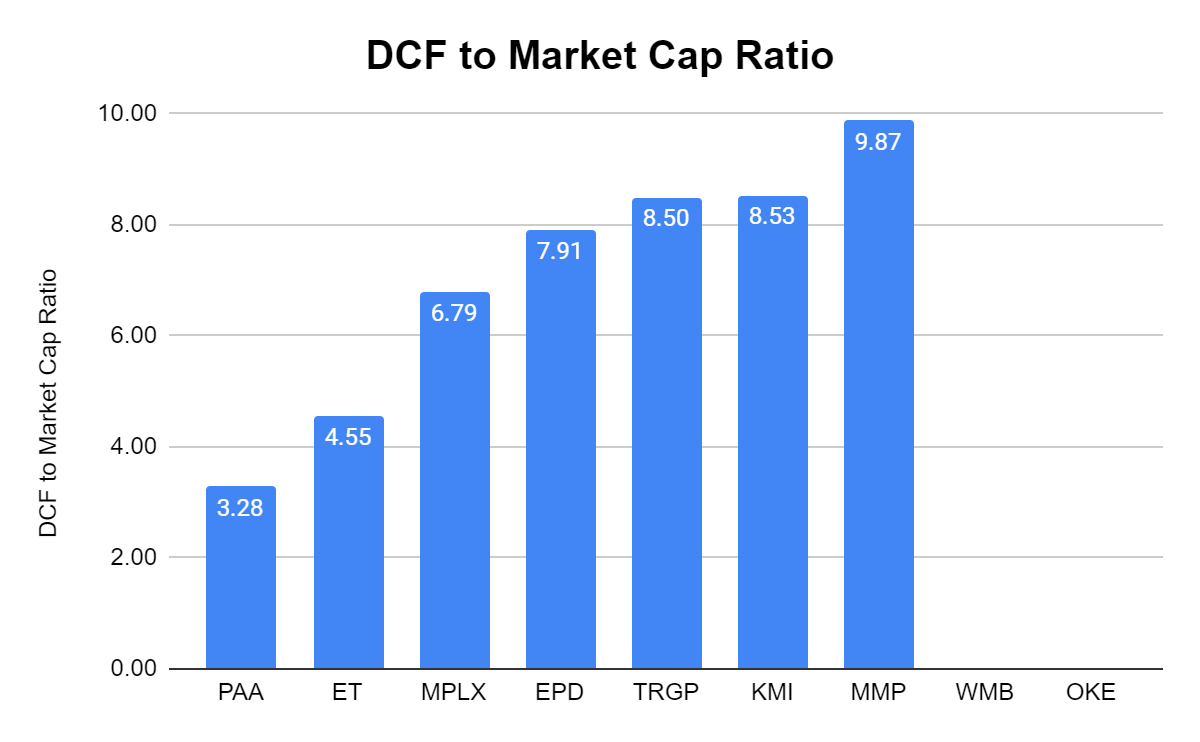
Price to sales isn’t generally used in the energy space, but it’s still an interesting metric to review. The peer group trades at a 1.81x P/S ratio. Mr. Market hasn’t even given ET a 1:1 ratio on its revenue generated, as its P/S ratio is 0.45x.
Steven Fiorillo, Seeking Alpha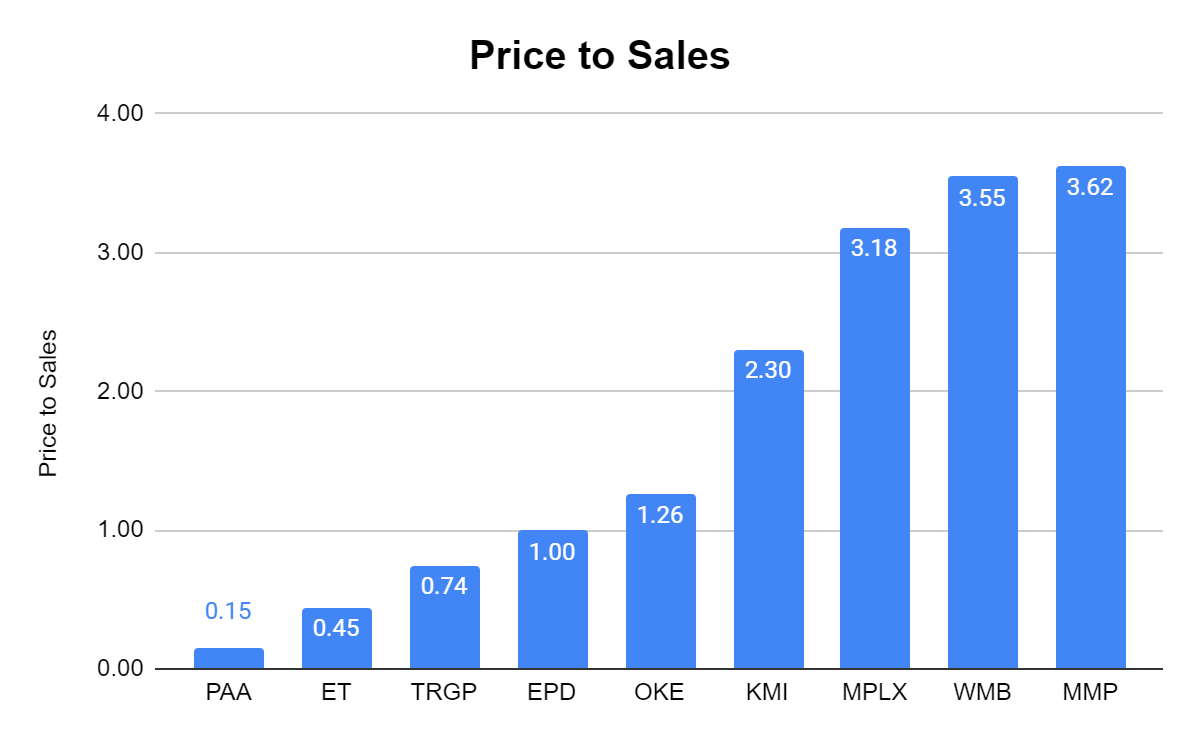
While ET certainly seems undervalued, a main complaint over the years has been its debt and leverage ratio. I look at the total debt to Adjusted EBITDA ratio to see if ET’s debt is out of control or if it’s in line with its peers. ET’s debt is on the higher end of the spectrum, but it’s a tight range of 3.15x to 4.37x. The peer group average is 3.74x, and ET trades slightly above it, around 4.09x.
Steven Fiorillo, Seeking Alpha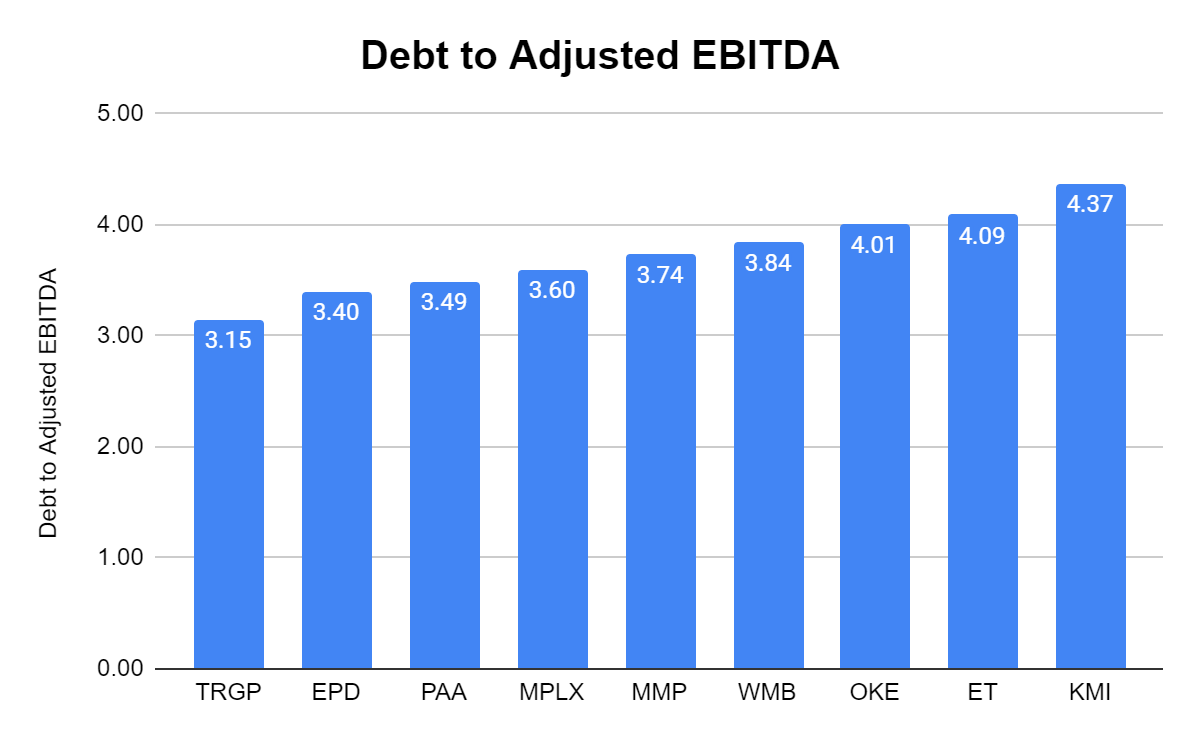
If Units of ET doubled from here and traded at $23.62, it would put its market cap at $72.91 billion. ET’s P/S ratio would still be under 1x at 0.89x, but its Adjusted EBITDA to market cap ratio would be 6.1x compared to its peer group average of 5.83x, and its DCF to market cap ratio would be 9.1x compared to its current peer group average of 7.06x. I think fair value for ET is around $20 as it would put its metrics more in line with its peers, and feel it should also trade at a premium as it generates the largest levels of revenue, Adjusted EBITDA, and DCF in the sector.
Why I am still extremely bullish on ET
At the beginning of June, ET signed a contract with China Gas where ET would supply 0.7M tonnes of LNG per annum on a free-on-board basis. The agreement is for 25 years and is expected to start as early as 2026. At the end of August, ET signed a 20-year agreement with Shell (SHEL) to supply 2.1M metric tons/year of LNG from its Lake Charles LNG export project in Louisiana. The LNG will be supplied on a free-on-board basis, and the purchase price will be indexed to the Henry Hub benchmark. This is the 6th agreement that has been announced in the previous 5 months bringing the contracted amount of LNG being exported from the Lake Charles facility to 8M metric tons per year. ET is positioned to become one of the largest exporters of American energy, with export facilities on both the East and Gulf Coast. I believe that exporting will be a growing revenue stream for ET, and there are only several companies with the capabilities to compete in the sector.
Insiders continue to purchase shares of ET, and regardless of investor perception of Kelcy Warren, he continues to spend tens of millions on additional units. ET is also improving its leverage ratio, and increasing its distribution. By adding units today, the new units could see an increase of 32.61% through 2023 as the distribution could be brought back to its previous levels. I think that the market has mispriced ET’s units, and there is also a capital appreciation play. Today ET is still drastically undervalued, and a unit price of around $20 puts it much closer to its peer group averages.
Be the first to comment