

Dragan Mihajlovic
Thesis
One of the first investment books I read was Geraldine Weiss’ classic entitled Dividends Don’t Lie. Highly recommended for investors who have not read it yet. Even though the book was published more than 3 decades ago (in 1988), many of the concepts are timeless. A key plot from the book is the following dividend-yield chart (for Allied Signal, a blue-chip stock from that era). There are at least two foundational concepts behind the plot that are so powerful that they underpin all my investment analysis. And in this article, you will see these concepts applied to Energy Transfer (NYSE:ET).
First, always be value-oriented and dividends are the most reliable value metric (hence the title of the book). As to be seen later, dividends provide a more reliable way to hack into a firm’s owners’ earnings. And currently, ET’s dividend yields are above the historical average, indicating an attractive owner’s earnings yield.
Second, always allow some error of margin. As you can from the dividend-yield plot, the valuation band is quite wide even for a blue-chip stock (a factor of 2x for Allied Signal with 3.5% yield being the overvaluation line and 7% being the undervaluation line). And later you will see that band is even wider for ET. In cases like this, it is always better to be approximately right (or directionally right) than precisely wrong. You will that the current condition of ET leaves a sizable margin of safety.
Dividends Don’t Lie by Geraldine Weiss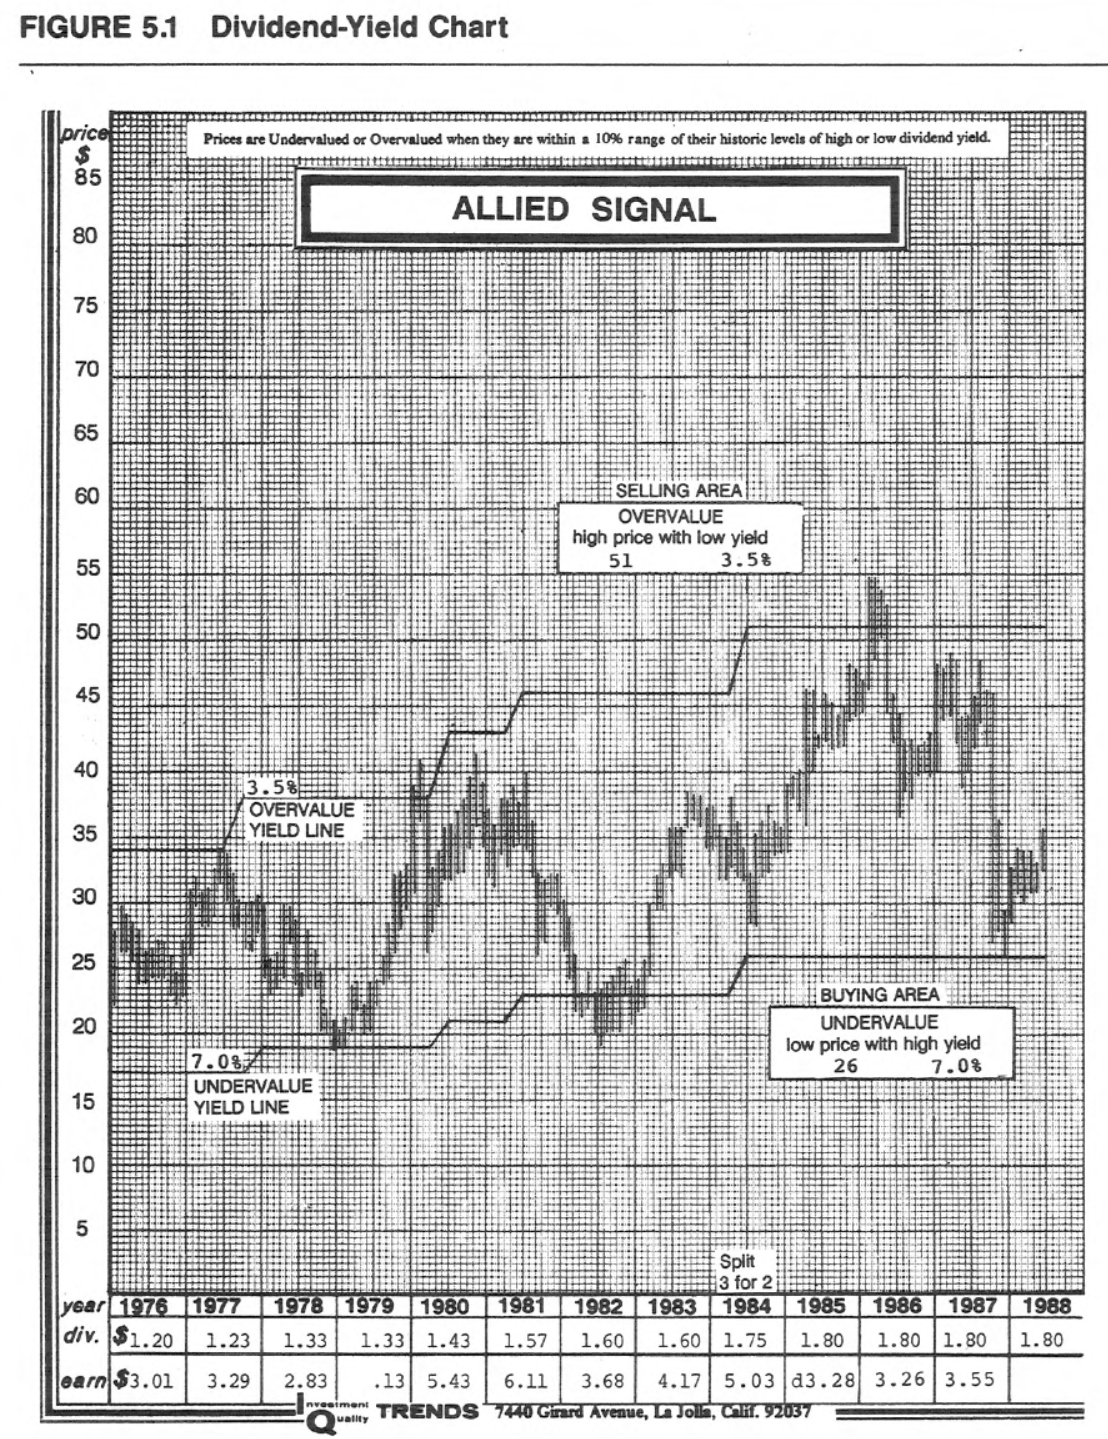
ET’s dividend yield chart
These days, we do not normally plot the dividend-yield chart as Weiss did back in 1988. Probably technology has evolved so it has become much easier to plot the dividend yield in the plot shown below. It conveys the same information as Weiss’ original plot. In a way, it is easier to see the valuation band. For example, you can immediately see that at the extreme of the undervaluation line, the yield reached 26.9%. And at the extreme of the overvaluation line, it reached 2.3%. And the band spans more than 10x here.
In practice, to dampen the volatility a bit, I typically remove the outlier data points, such as those highlighted in the yellow boxes below. Once these outliers are removed, the undervaluation corresponds to a yield of around 10% and the overvaluation line about 3%, with an average of around 7% in the long term. Currently, the stock is yielding 6.92%, close to the historical average. But the point is that it is far above the overvaluation line to leave plenty of margin for error.
Seeking Alpha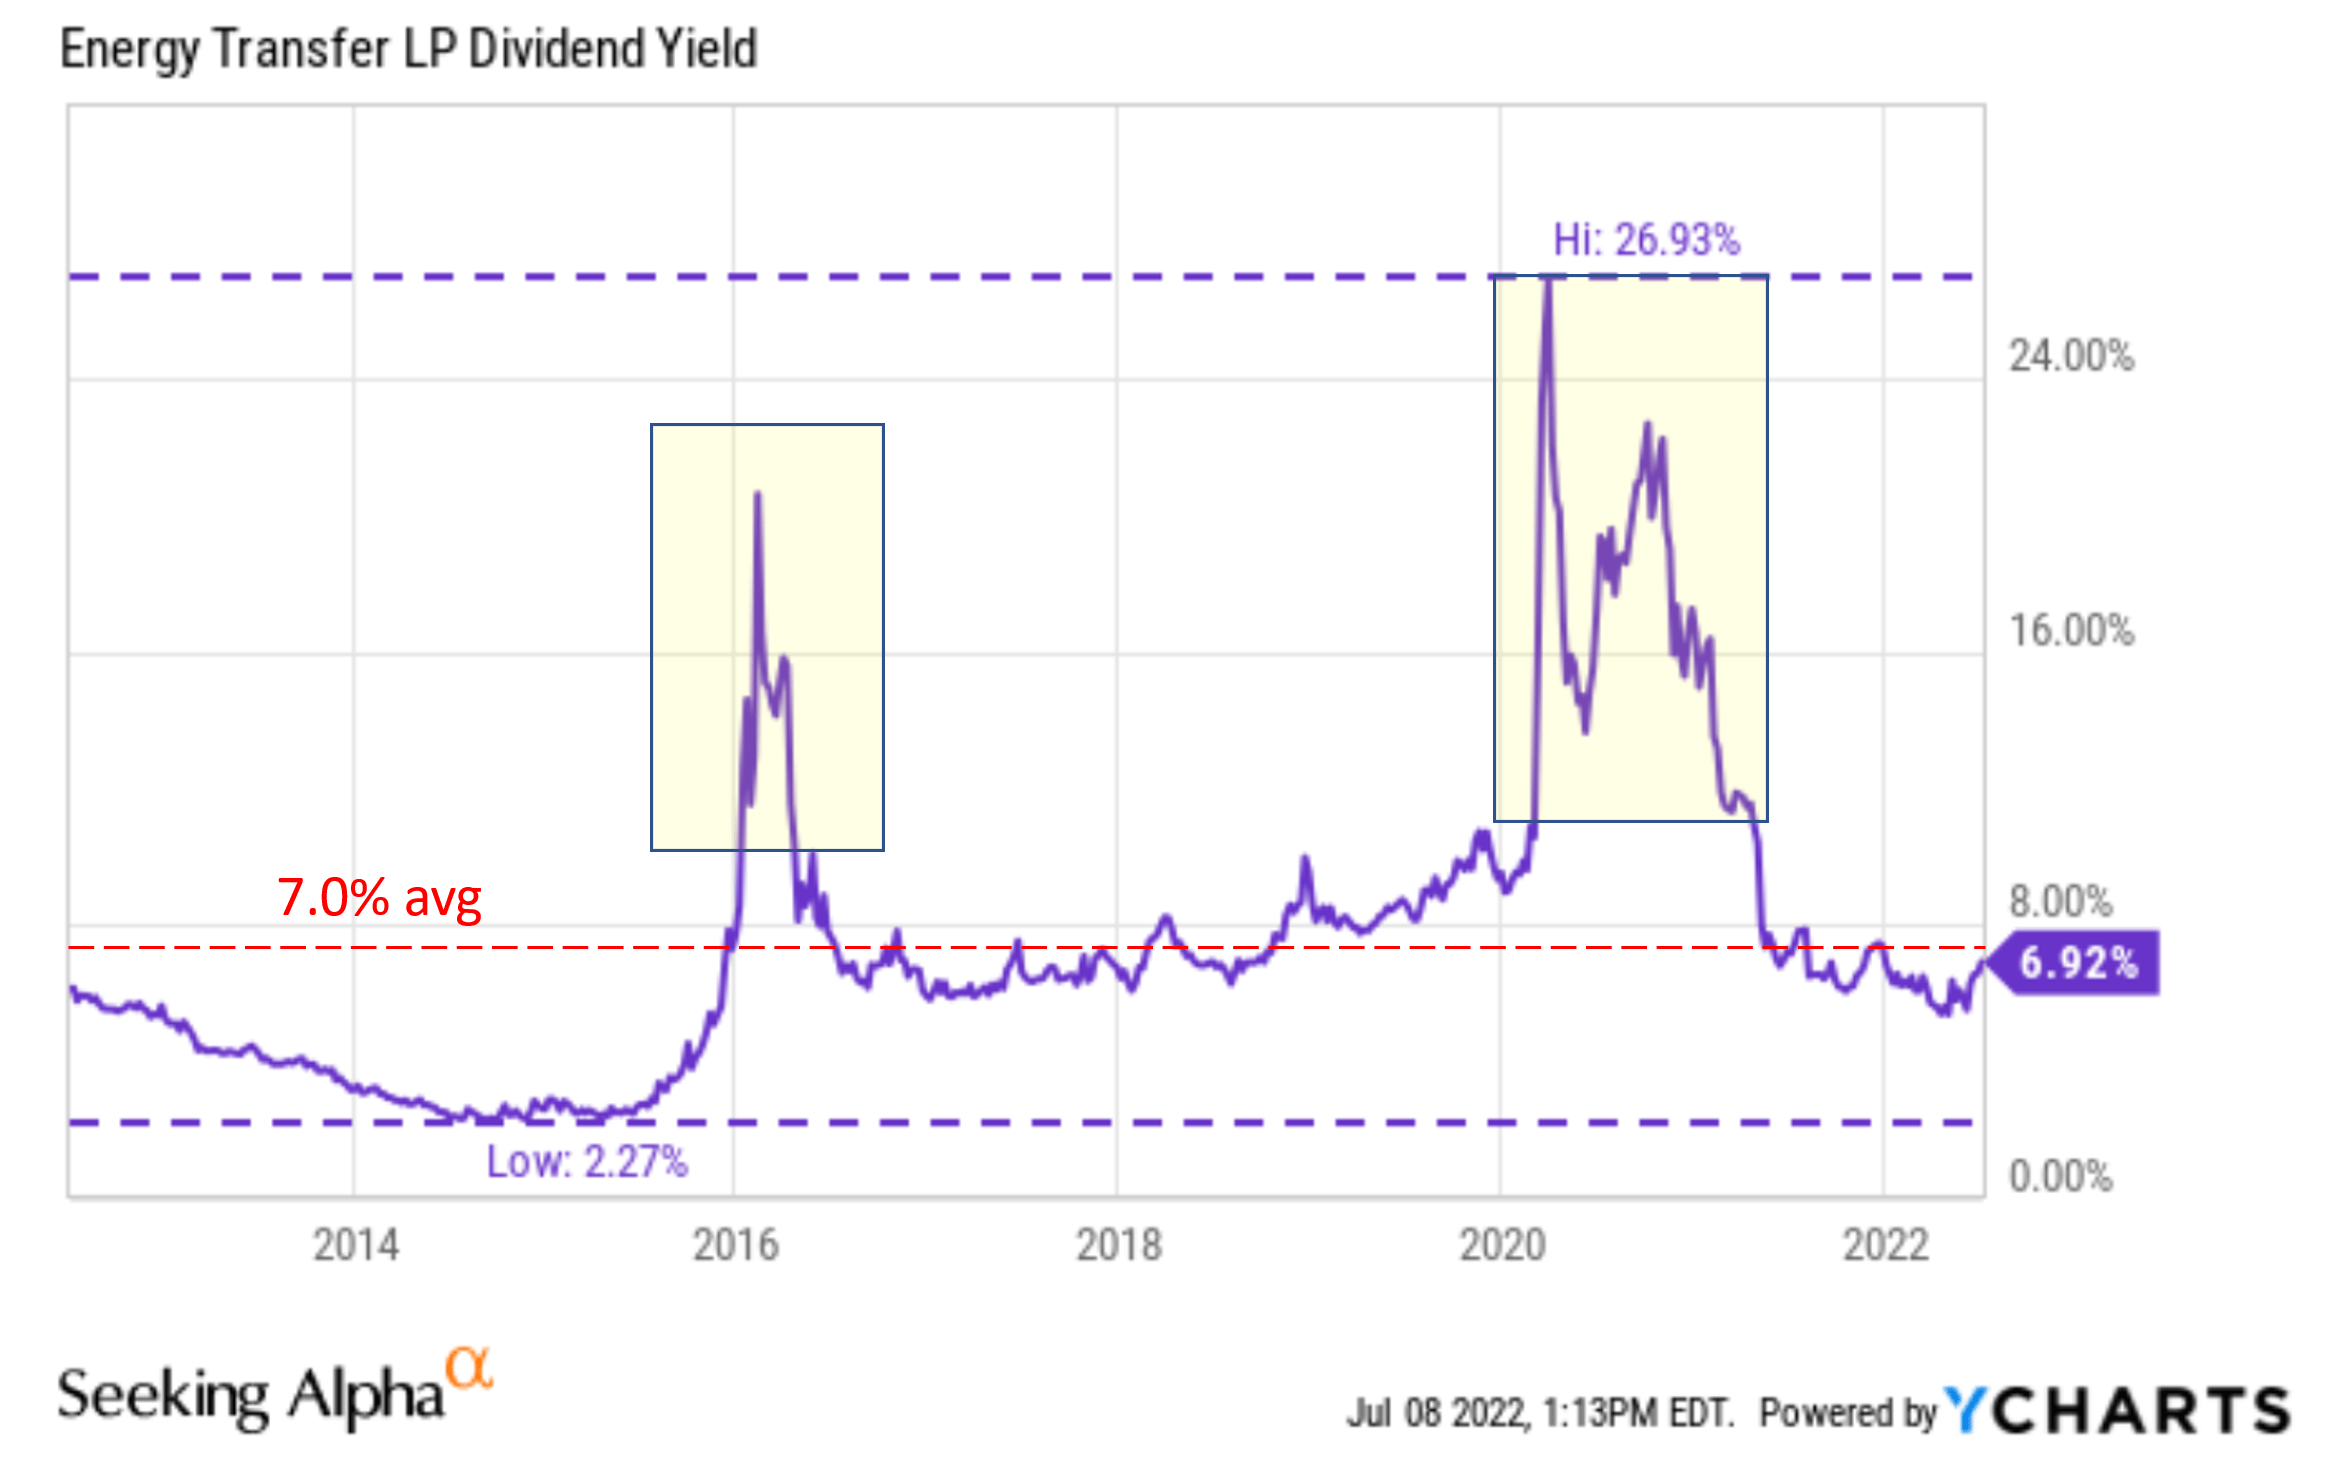
ET’s dividends safety
ET’s current financial strength is currently near the peak level in a decade, adding another layer of margin for error, as you can see from the following two charts. The first chart shows its interest coverage ratio. Historically, it has earned an average of 2.1x of its interest expenses (with a fluctuation from as low as 1.1x to as high as 4.0x). Currently, it is earning 3.1x. Not only far above its historical average but close to the peak level.
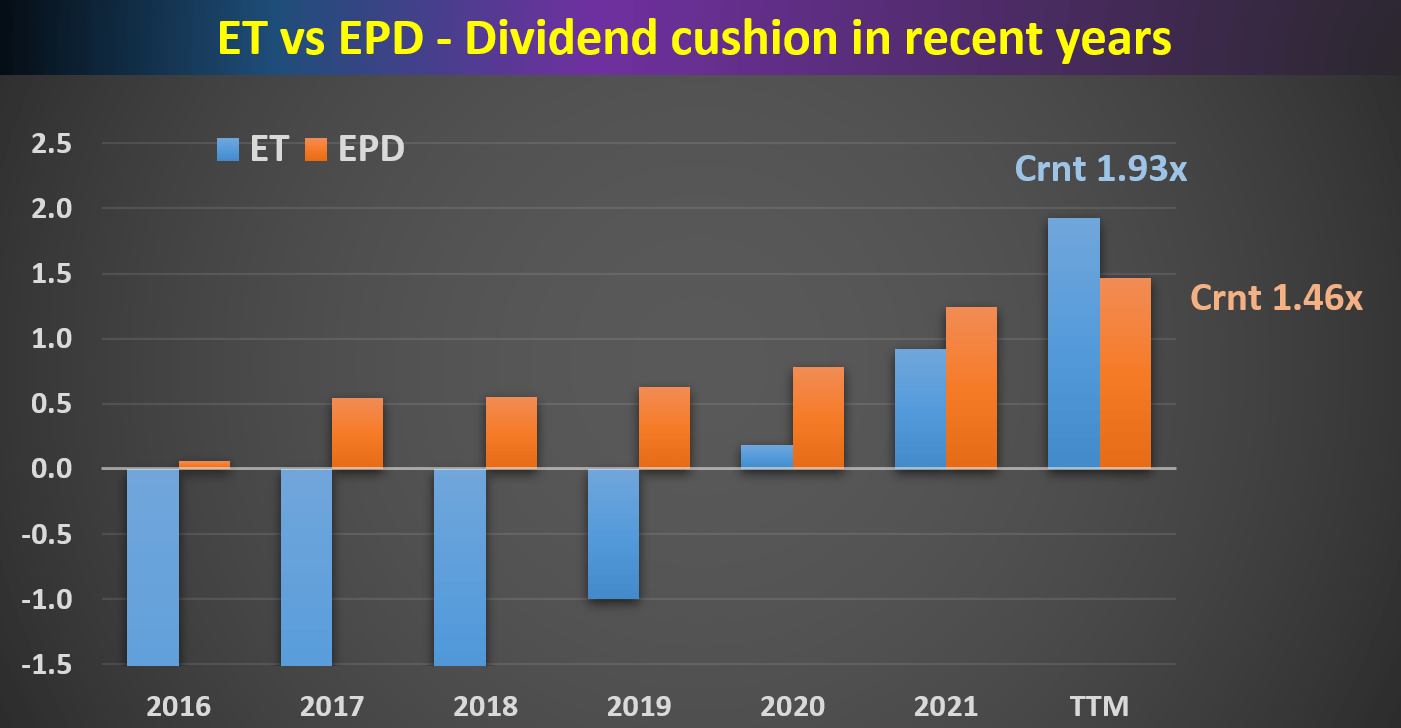
The scone chart shows its dividend cushion ratio, a holistic consideration of its finances (debt, payables, dividends, earnings, et al) as detailed in my earlier article here. And as seen, ET’s dividend cushion ratio is at 1.93x, the highest level in a decade. The comparison against its close peer Enterprise Products (EPD) adds a broader perspective.
Seeking Alpha Author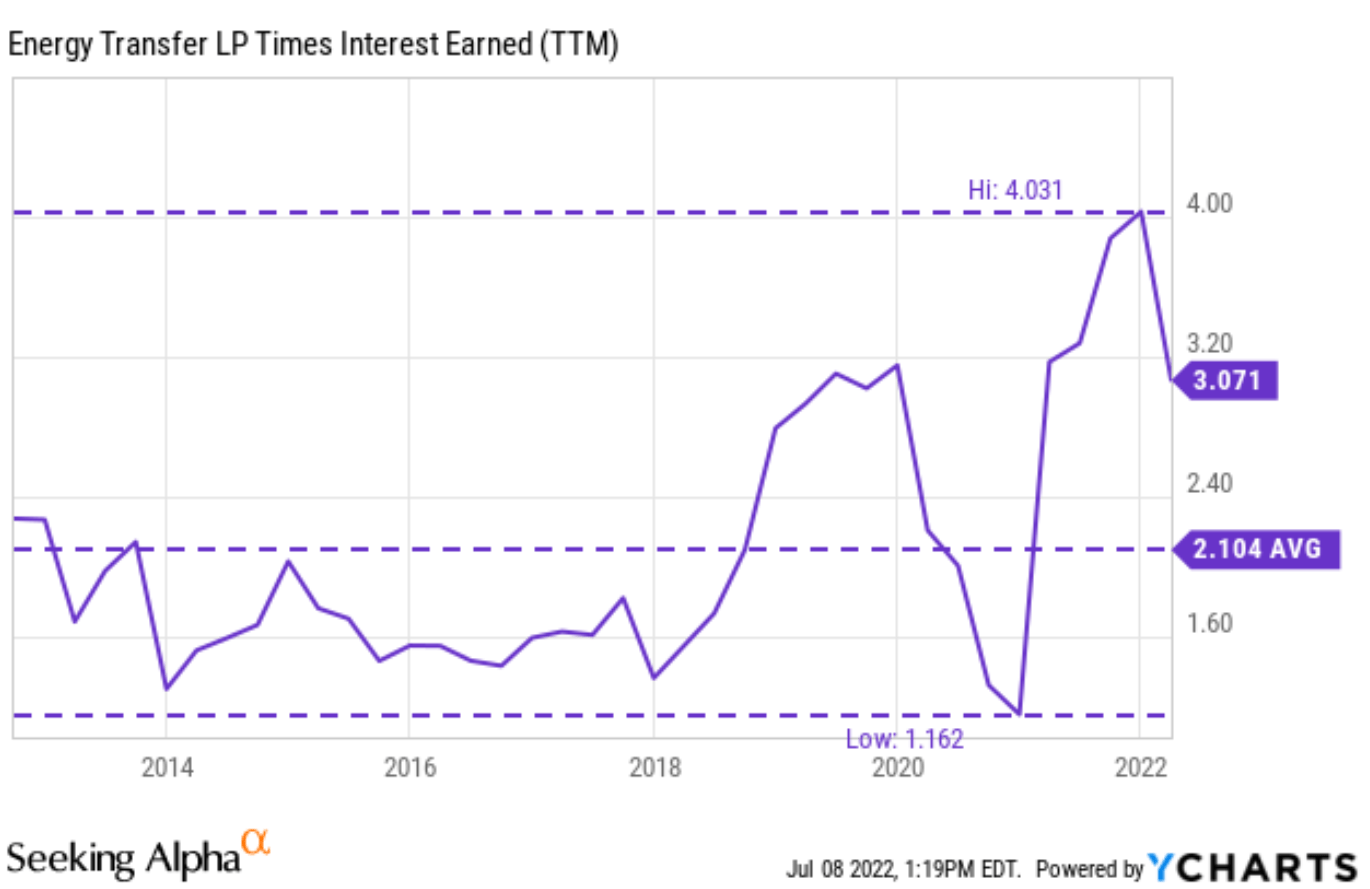
ET’s yield spread against risk-free rates
Finally, it is my view that the discussion of any dividend stock won’t be complete without benchmarking it against risk-free interest rates.
This work will use the dividend yield spread against risk-free interest rates for such benchmarking. Details of these concepts and approaches have been provided in our earlier article. Dividend yields and yield spread are what we first check before making any investment decisions because of:
- The common PE or Price/cash flow multiples provide partial and even misleading information due to the differences between accounting earnings and owners’ earnings.
- Dividends provide a backdoor to quickly estimate the owners’ earnings. Dividends are the most reliable financial information and least open to interpretation.
- The dividend yield spread (“YS”) is based on a timeless intuition. No matter how times change, the risk-free rate serves as the gravity on all asset valuations and consequently, the spread ALWAYS provides a measurement of the risk premium investors are paying relative to risk-free rates.
This next chart shows the yield spread between ET and the 10-year treasury. As can be seen, the spread fluctuated in quite a wide range too. But similar to the discussion of the yield chart above, the YS has been range-bound and tractable once we remove the outliers like those highlighted in the yellow boxes. The YS has been within a range of 2.0% to 7.0% the majority of the time with an average near 4.65%.
And as of this writing, the yield spread is about 5.0% with ET yielding 8.11% and 10-years rates hovering around 3.1%. It is above the historical average by a little bit. But again, the key observation is that it is far away from the thinnest level of 2%, providing an allowance for error.
Author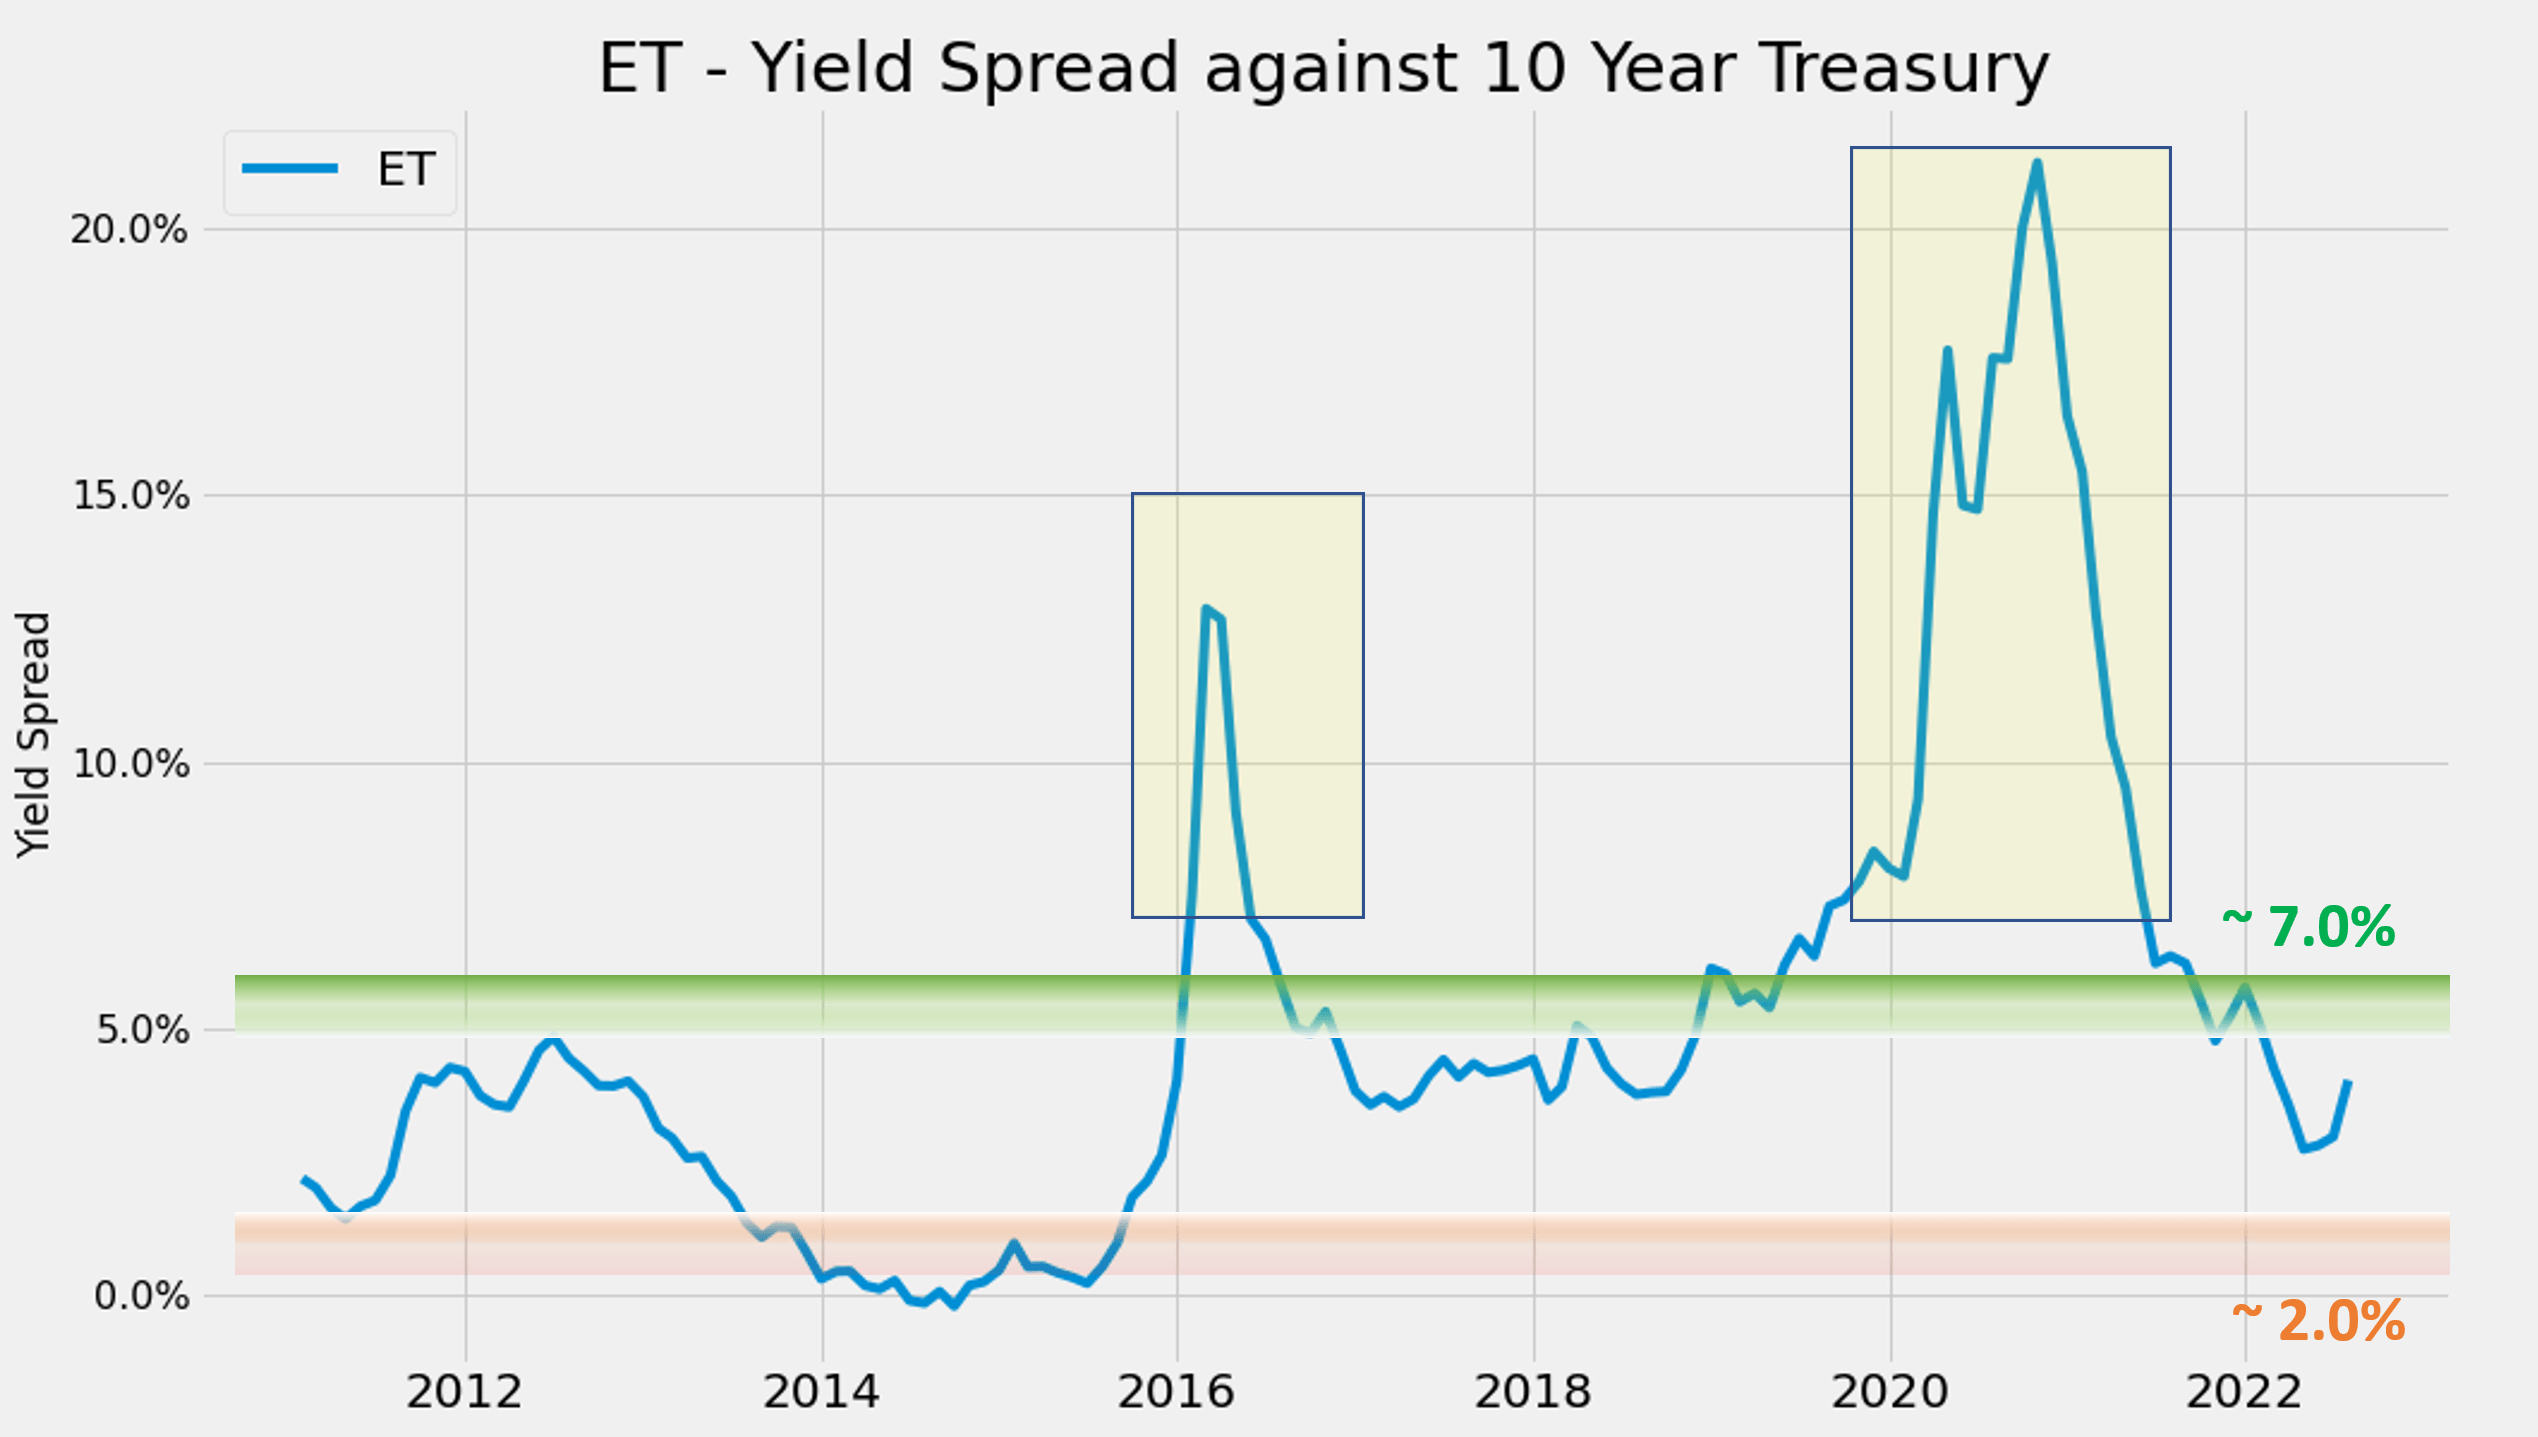
Finally, for readers familiar with our analyses, you know that the short-term returns are closely correlated with the yield spread for funds or stocks that have demonstrated stable earning powers and dividends. It is also true for ET. The chart below shows the 1-year total return (including price appreciation and dividend) from ET when the purchase was made under different yield spreads. You can see that there is a clear positive trend even when all the outlier data points were included in the regression. The Pearson correlation coefficient is 0.34. It is a moderately strong correlation, but not as strong as other dividend stocks we’ve analyzed before. And the main reason is that ET stock prices are impacted by commodity prices (not its earnings, as elaborate immediately below).
Author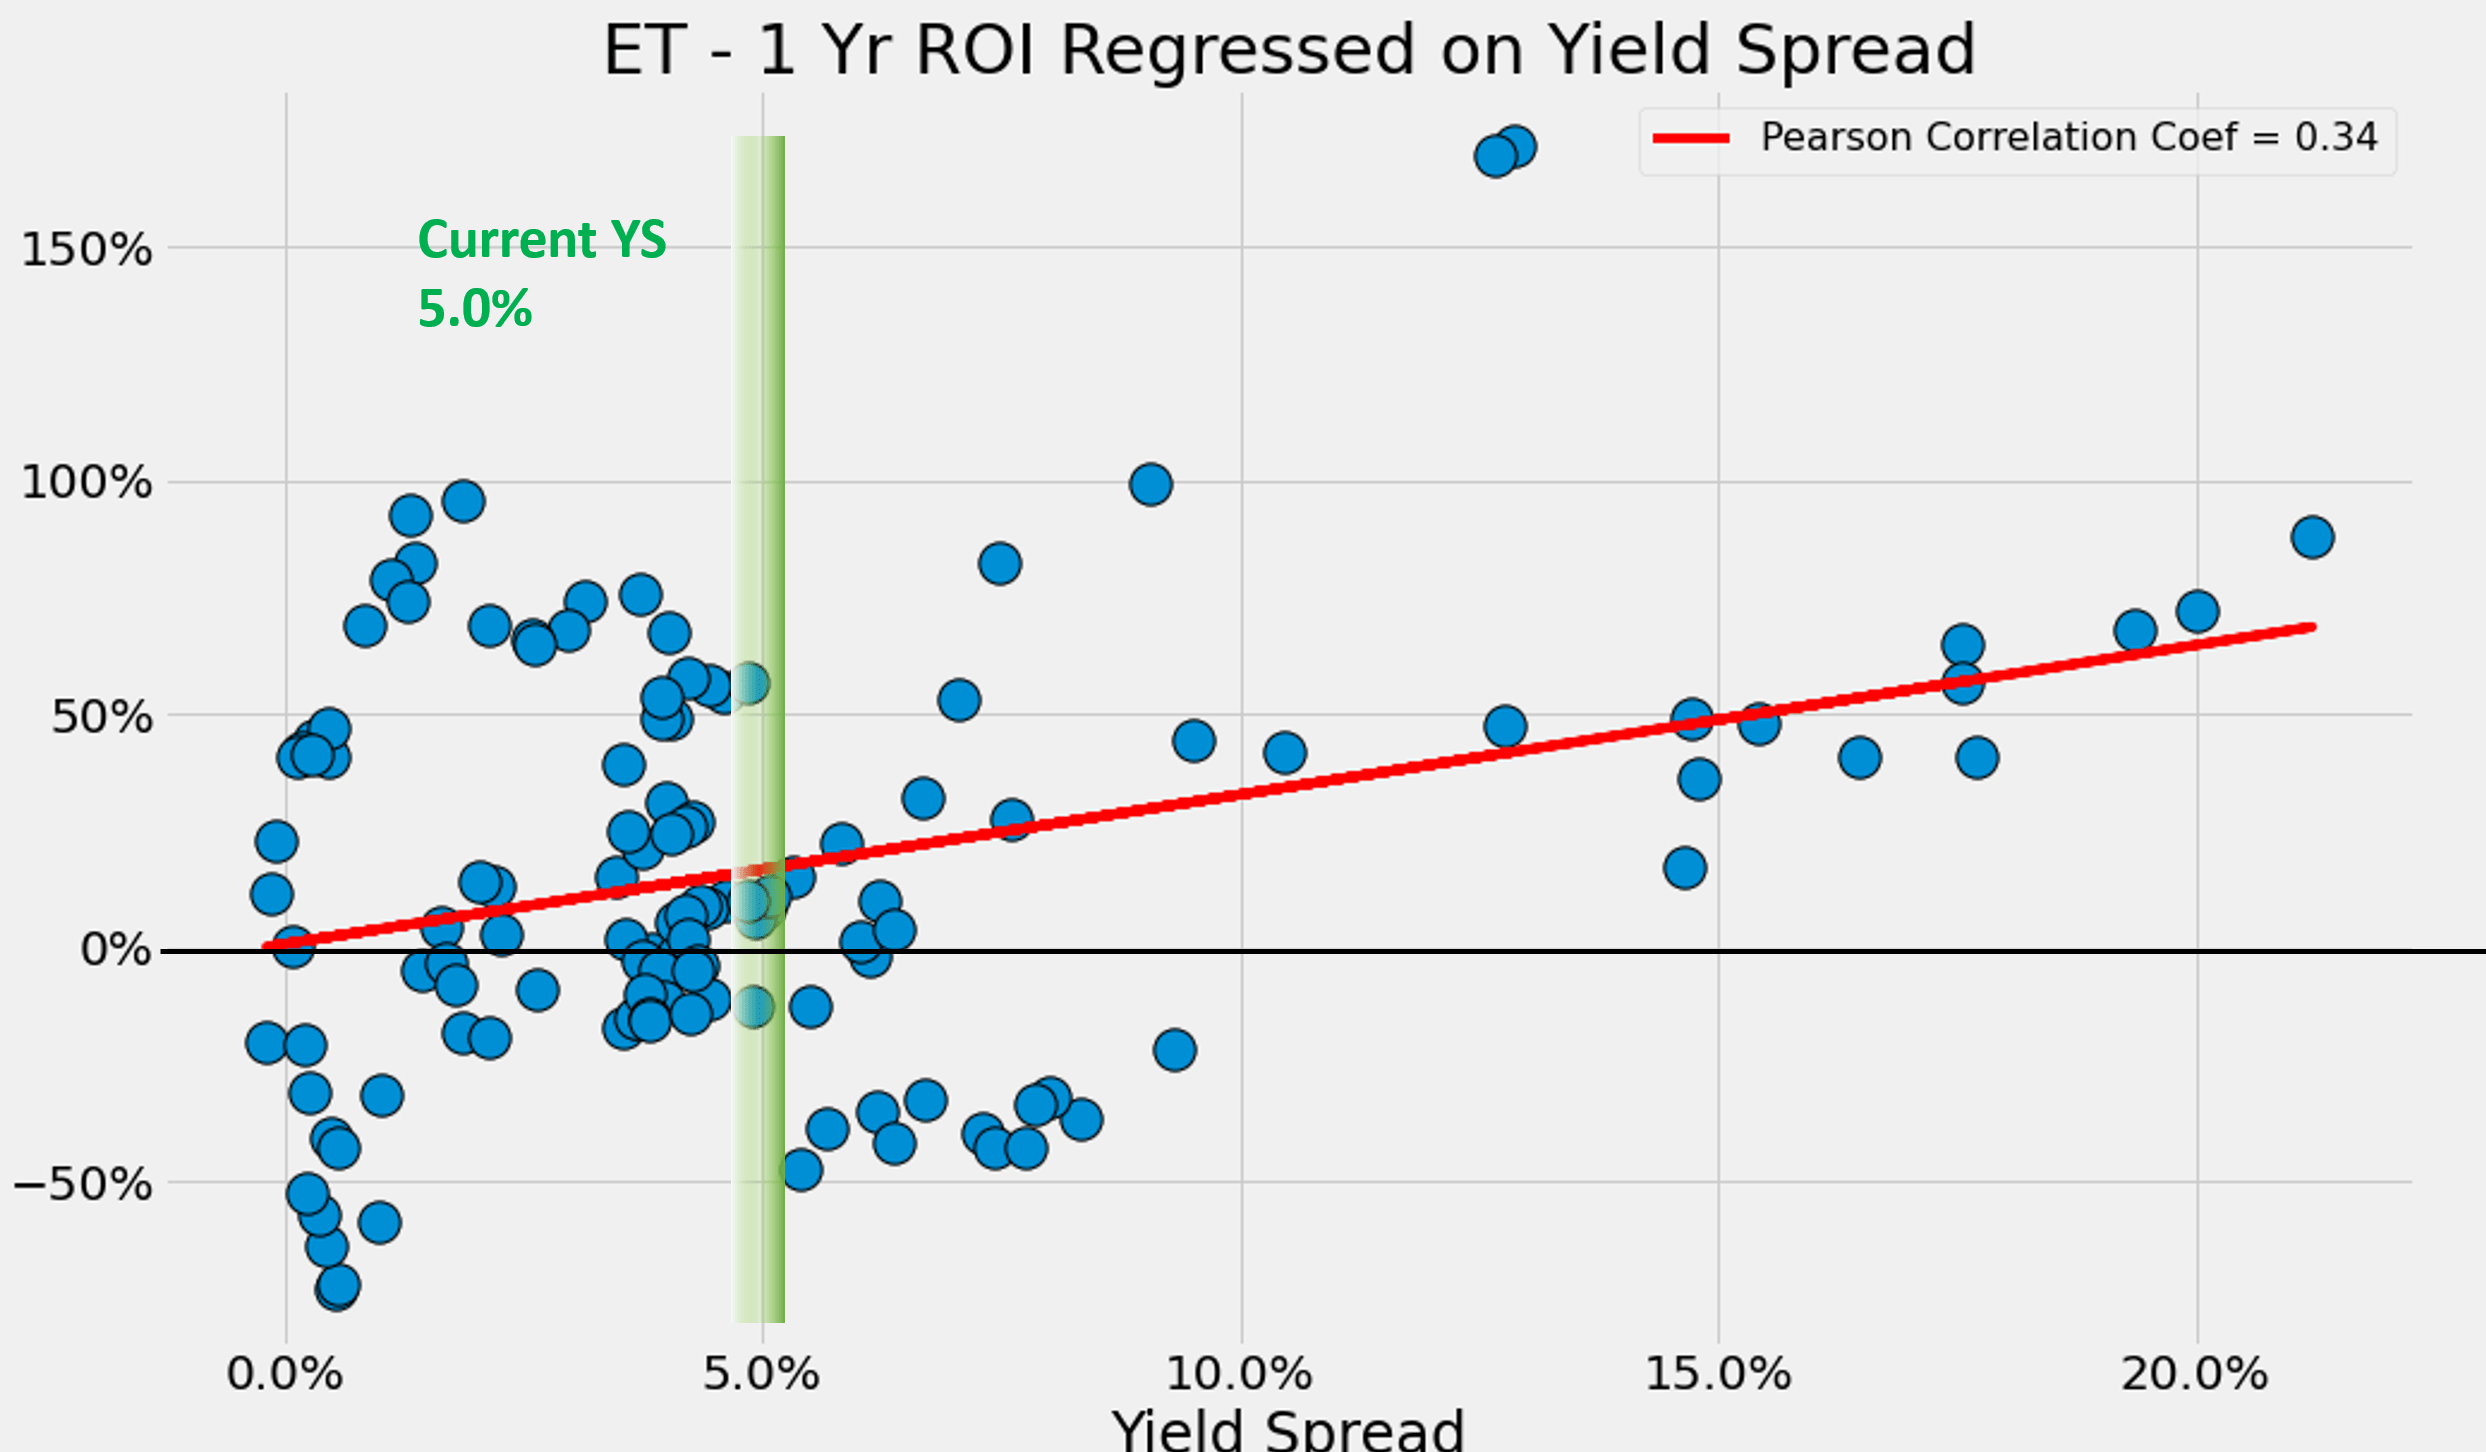
Final thoughts and risks
Even though ET’s stock prices are sensitive to oil price (something we are experiencing now), its earnings actually show a very weak correlation with oil prices as you can see from the chart below. Overall, its operating income shows almost zero correlation to oil price in the long term. The midstream segment is like the railroads for to the energy sector. They make their profit by charging the transportation fees, not by selling what they transport. Hence, the market overreactions because of oil price fluctuations could actually provide opportunities for long-term investors.
Finally, a word about risks. Higher borrowing cost is a risk for ET. Despite its peak financial strength, ET (and other pipe businesses too) depends on debt financing to a substantial degree. ET’s current long-term debt is about $45B. Hence, a 1% increase in borrowing rate would translate into $450M of additional interest expenses or about 10% of its current net profit. We also face a realistic possibility of recession too. A recession could shrink consumption and hurt the demand for ET. Finally, investors do need a stronger nerve to tolerate the price volatilities. As aforementioned, ET’s valuation in terms of yield fluctuated by more than 10x in the past decade, from 26.9% to 2.3%.
Seeking Alpha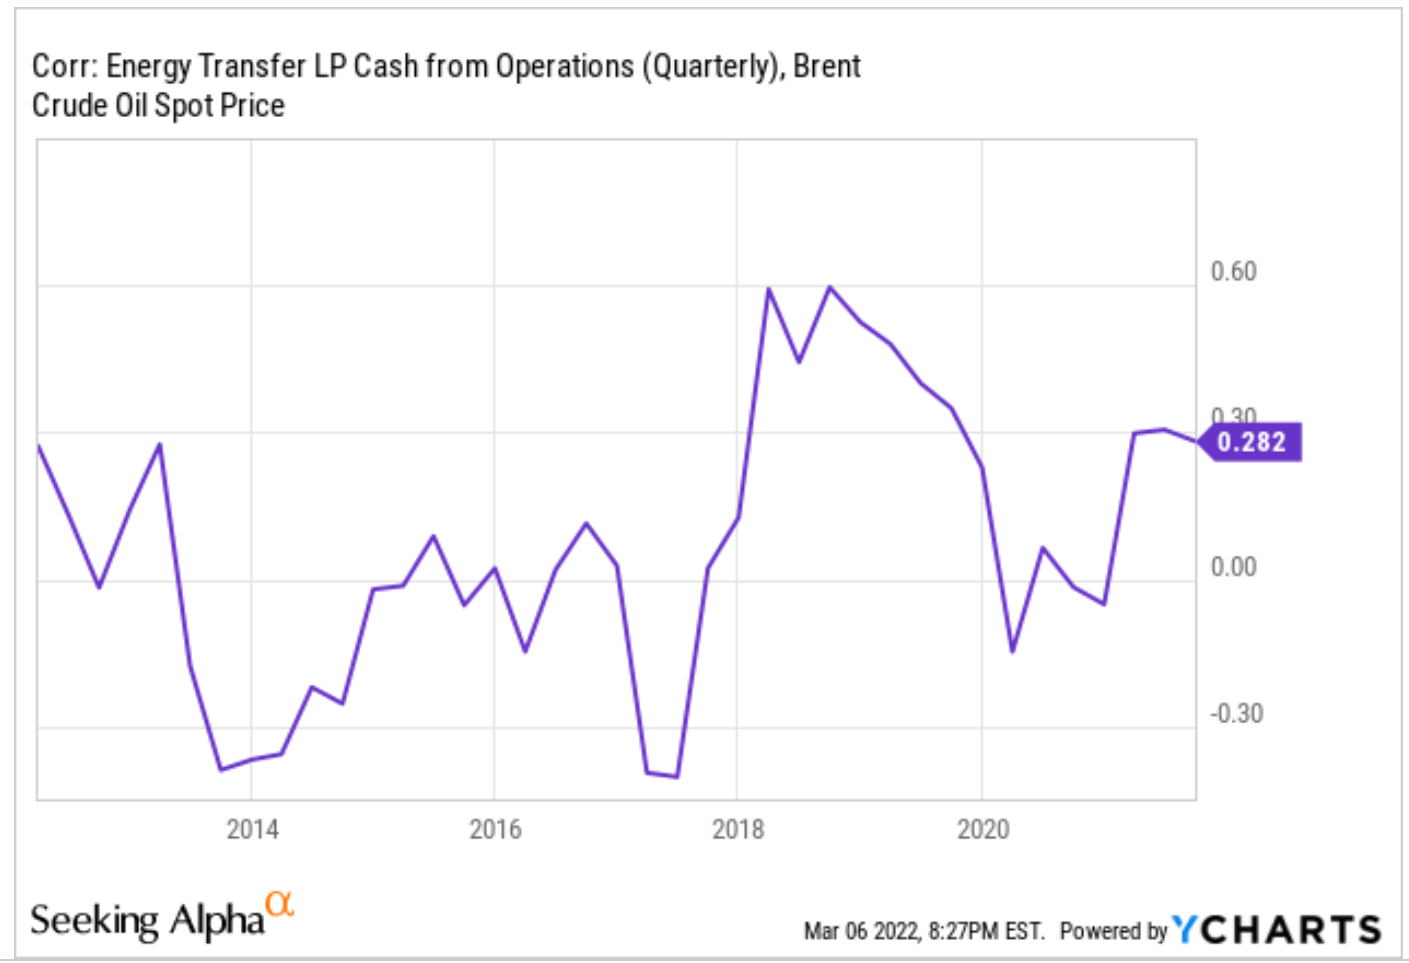
Be the first to comment