

Sinenkiy
Thesis
Energy Transfer (NYSE:ET) reported strong Q2 results earlier this week, beating consensus estimates on both lines. It reported an EPS of $0.39 (GAAP basis), beating consensus estimates by $0.02. Its revenue came in at $25.9B, representing a 71% increase YoY and beating consensus by more than $5.5B. And as you will see more, such strong growth was largely driven by the Enable Midstream acquisition and its smooth integration in the past few months, which leads me to the main thesis for today.
In the remainder of this article, I will argue that we are only begging to see the benefits of the Enable acquisition, and the acquisition will continue to pay dividends – both in the financial sense and also in the figurative sense – for years to come.
50% dividend raise
Firstly, let’s take a look at dividends in the financial sense. The acquisition, combined with a range of other positive catalysts (as detailed in our other articles on the energy sector), has put ET in a strategic position for growth. Management is confident about the continued demand for their products and services. And in Q2 ER, they raised the 2022 guidance by about 3.3%, from an expected EBITDA of $12.2 billion to $12.6 billion to be between $12.6 billion to $12.8 billion.
As a clear indicator of this confidence, ET announced a quarterly cash distribution raise to $0.23 per common unit for the quarter ended June 30, 2022. More specifically,
This distribution represents a more than 50% increase over the second quarter of 2021. Future increases to the distribution level will continue to be evaluated quarterly with the ultimate goal of returning distributions to the previous level of $0.305 per common unit per quarter ($1.22 annualized) while balancing the Partnership’s leverage target, growth opportunities and unit buybacks.
After this dividend raise, ET features an FW dividend yield of 8.44%, about 14% above its historical average as you can see from the following chart.
Seeking Alpha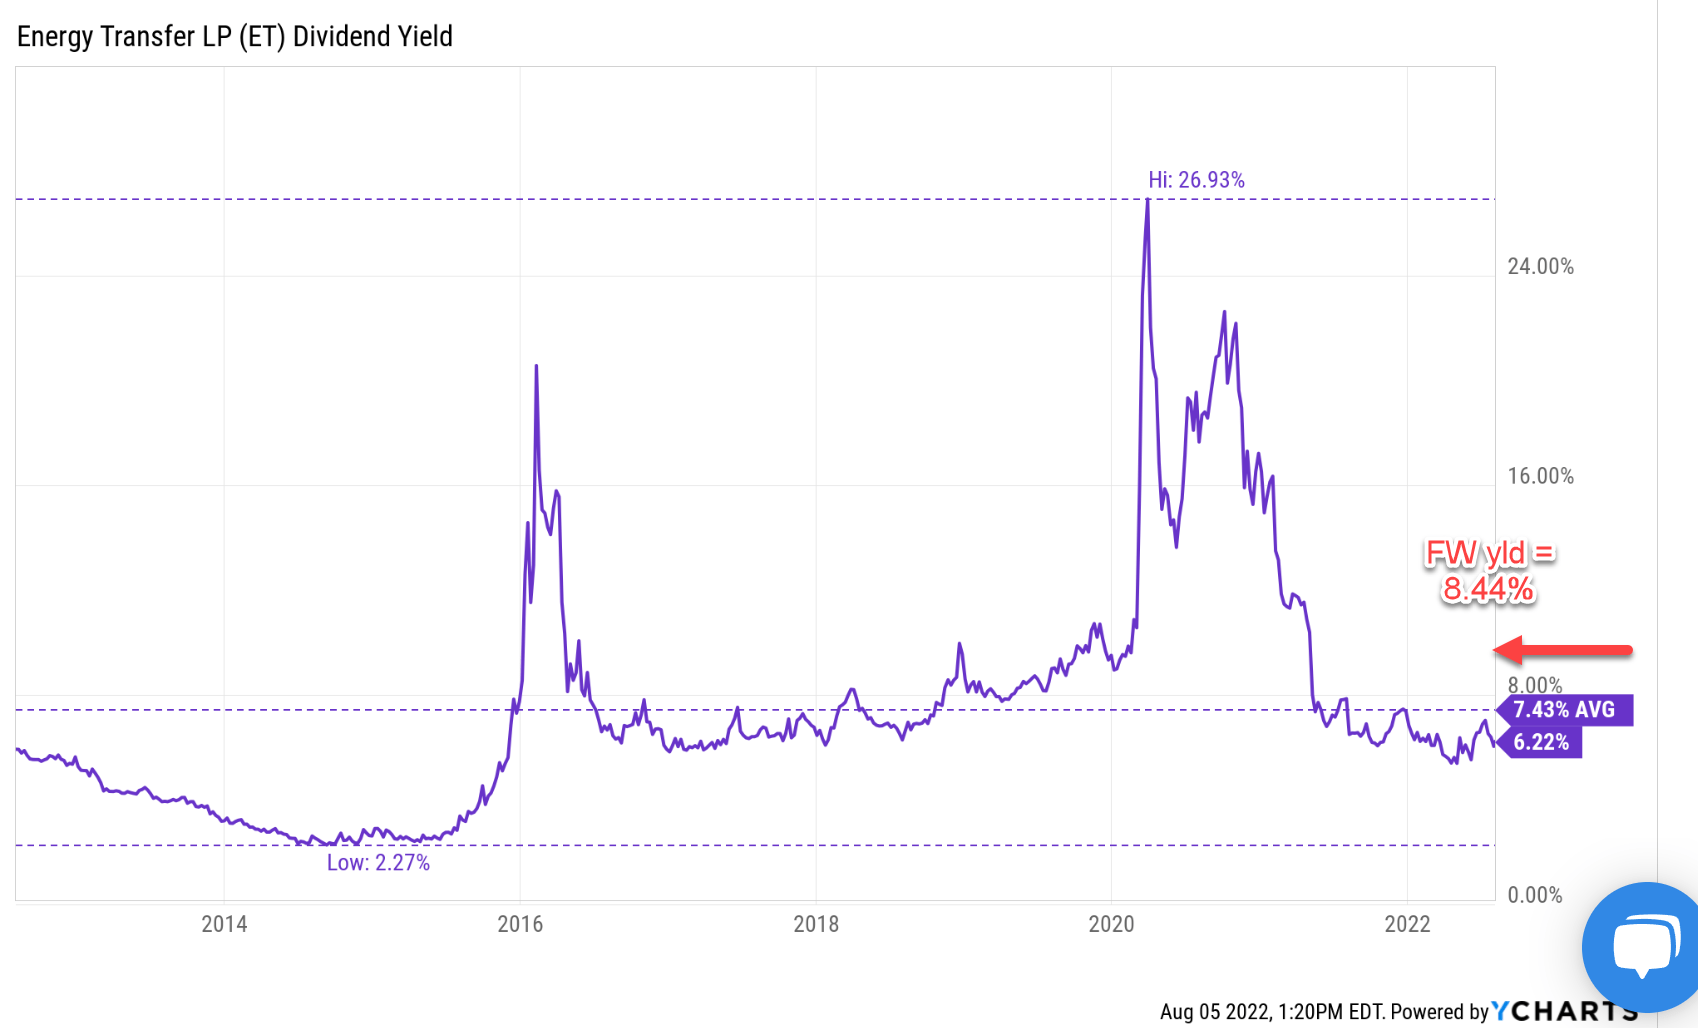
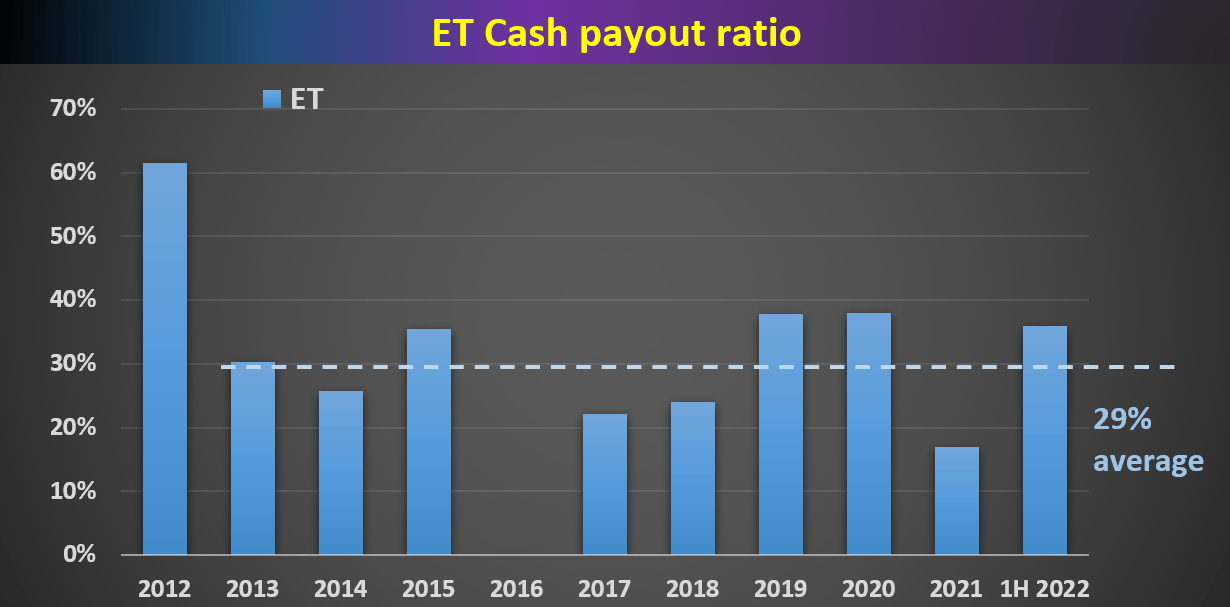
At the same time, thanks to its strong cash generation, such high dividends are also very safe at the same time. The following two charts show ET’s payout ratio in terms of earning and cash flow payout ratios. In terms of earnings payout ratio, ET’s average in recent years has been about 69%. And as you can see, its payout ratio for 1H 2022 (both Q1 and Q2 included) is only about 59%, substantially lower than its historical average (which is already at a very safe level). The cash payout ratio is even lower as seen in the second chart. ET’s cash payout ratios have been on average 29% in recent years, and its payout ratio has been about 36% for 1H 2022. Admittedly, it’s a bit above the average. But I see no reason of concern here at all, as the 36% is quite low in absolute terms.
Looking forward, I see the dividends to keep rising at a healthy pace because of the very favorable conditions as elaborated on next.
Author Author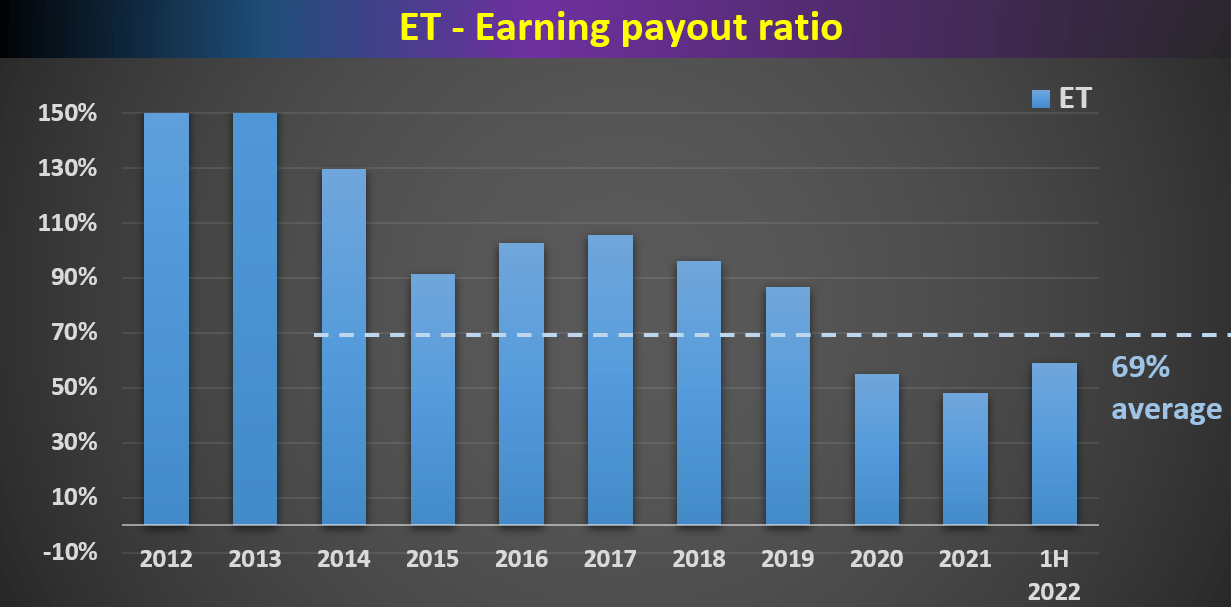
Peak Asset Utilization
Operationally, ET is firing on all cylinders, especially the operation of the Enable assets. As co-CEO Tom Long commented during the ER (abridged and emphases added by me):
During the quarter, we benefited from the addition of the Enable assets as well as increased rates and higher utilization on the Transwestern Tiger, Rover and Frontline systems due to more favorable market conditions volume growth. We continue to see heavy utilization on many of our interstate pipelines, including Tiger, FGT, Stash and Rover.
To be more specific, during Q2, ET reported record NGL transportation, record fractionation volumes, and record processing volumes in the Permian Basin. And to put things under a broader perspective, the picture below shows ET’s asset turnover rates over the past 5 years. As you can see, it has been hovering around 0.2 before the pandemic and then hit its bottom at around 0.1 during the pandemic. It then rose sharply afterward and surpassed the pre-pandemic level around early 2021. Currently, its asset turnover rates sit at 0.25, the peak level in the past 5 years.
Seeking Alpha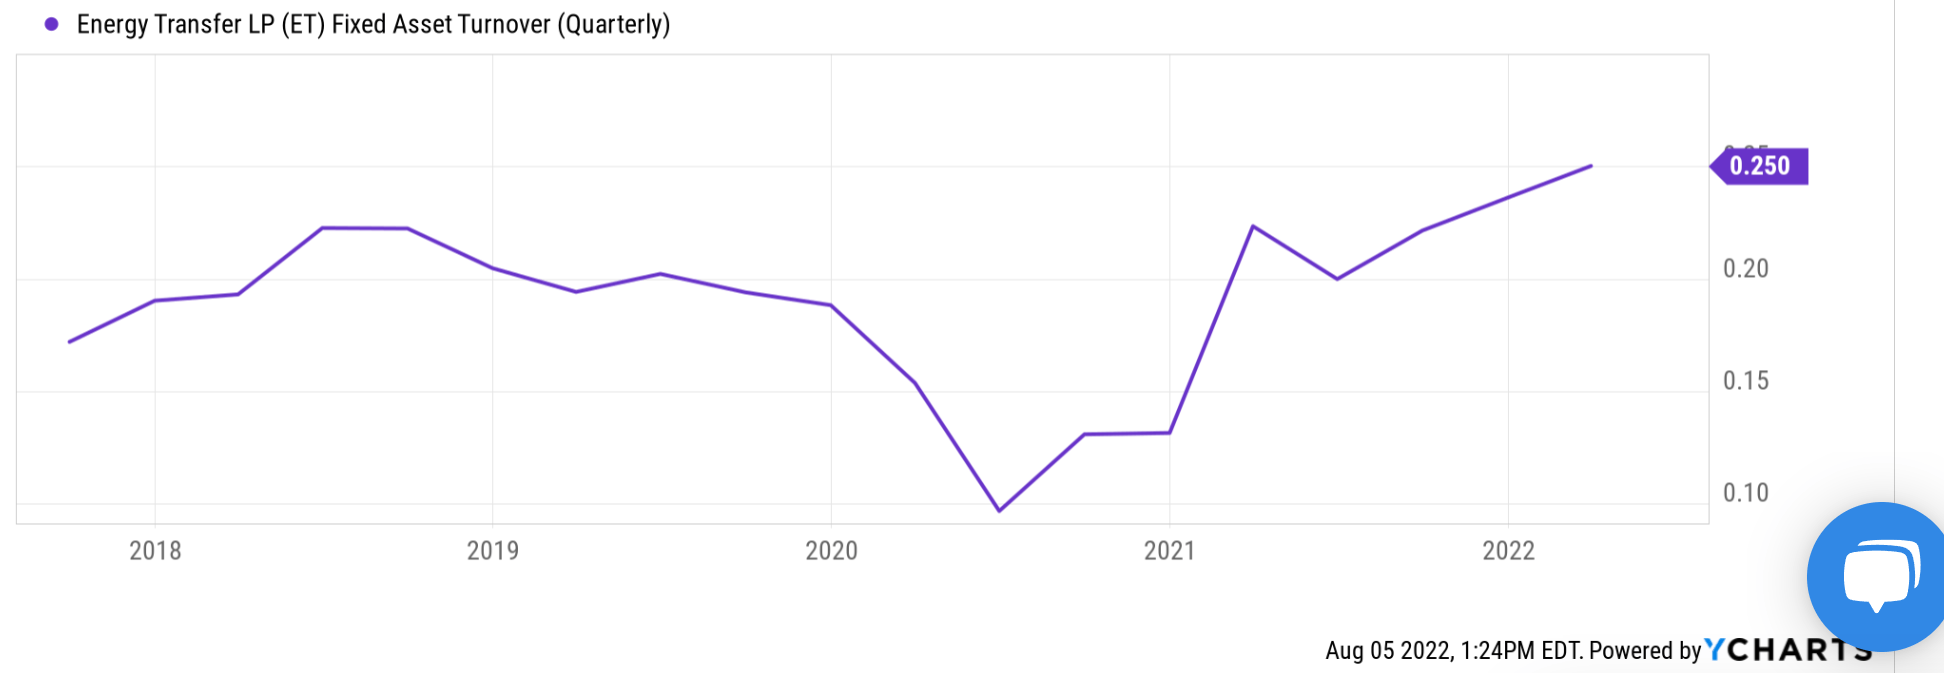
Growth and projected returns
I think the consensus forecasts, as shown below, dramatically underestimated the growth potential. The pessimistic forecasts actually expected shrinkage of its EPS between 2022 and 2022 and 2024 (from $1.61 to $1.53). By the way, I recommend readers ignore the estimates for 2025 and 2026, as only one analyst provided his/her analysis. I am projection a 5% annual growth for the next few years considering the continued integration of its Enable assets and also other capital projects the company is taking on currently. To name a few, these projects include the two additional cryogenic processing plants they are building, the Grey Wolf plants, and also the Bear plants
Seeking Alpha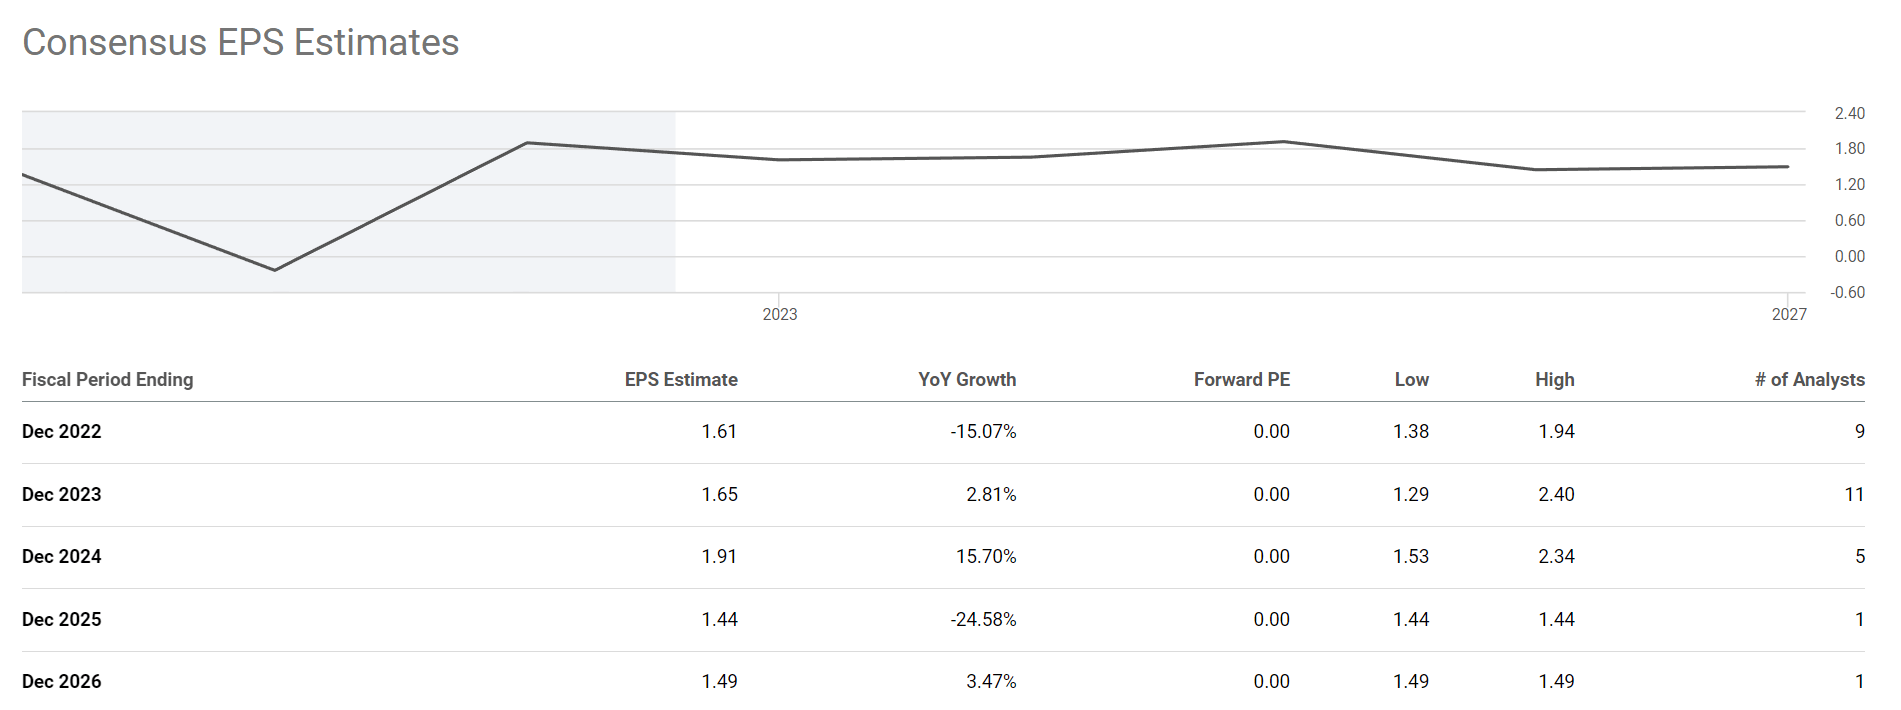
In terms of valuations, the following tables show that ET is undervalued. The discount is about 6% in terms of PE multiple from its historical averages. In terms of dividends, it is about 14% undervalued in terms of its FW yield as aforementioned.
The combination of compressed valuation and healthy growth prospects as mentioned above provides favorable return potential even under conservative assumptions as shown. For the next 3~5 years, the total return is projected to be in a range of 29% (the low-end projection) to about 38% (the high-end projection), translating into an annual return of 6.6%to 8.4%.
Author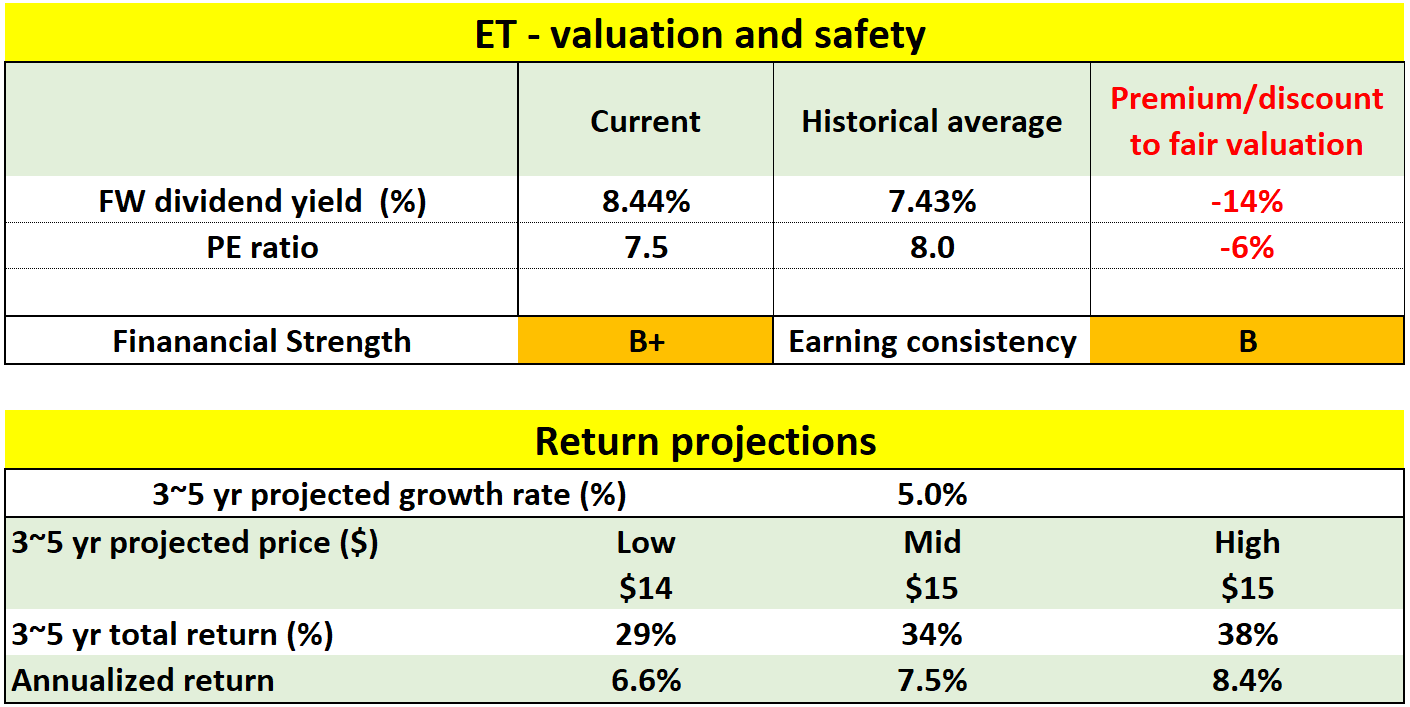
Final thoughts and risks
Two final thoughts before closing. First, note that the above projections assumed no expansion of valuation at all. I’ve only assumed the valuation to return to the mean. To me, assuming a PE of 8x is very conservative, considering that its PE has been above 20+ before 2018 and its median PE in the past decade is around 15x. Secondly, note that its FW dividend yield is 8.44%, which is already above the range of my projections and illustrates again how conservative these projections are.
Finally, risks. As shown in the table above, its financial strength is excellent as a pipeline business. But under the grand scheme of things, its financial strength is only B+ considering its leverage. Earning consistency is also not the best when we broaden our view beyond the energy stocks due to the cyclical nature of the sector.
Be the first to comment