

gradyreese/E+ via Getty Images
It’s April Fools’ Day, but rest assured, this is a prank-free zone, which might be a nice respite for anyone who’s spent even a second on social media today.
The first quarter of 2022 is in the books and it has certainly been an eventful one. We wanted to take the opportunity to recap the quarter in this week’s Jarvis Newsletter, as we analyze the trends that have shaped market action over the past three months. We’ve seen the outbreak of the first major war in Europe in recent memory, continued supply chain challenges, persistent inflation in the price of almost everything, and the beginning of a Fed tightening cycle that has interest rates rising back to levels unseen since 2018.
With all the challenges facing businesses, large and small, and the negative news coming from many directions, you will not be surprised that we have witnessed significant pullbacks in the major stock indexes, with the S&P 500 down 5.6% for the quarter and the NASDAQ Composite losing 10.2% in value. Small caps also struggled, falling by just under 9%. The lone bright spot came in the energy sector, with the Energy Select Sector SPDR ETF (XLE) rising by an astounding 35% from January 1 to March 31.
But the news hasn’t been all bad across markets. While many high-flying growth stocks have lost between 30-60% of their value just in 2022 alone, we have begun to see signs that their fortunes are changing. As we have shared with you over the last two weeks of newsletters, investors are starting to become more optimistic about the fortunes of the more richly valued businesses. From our point of view, we still think the technology space is comprised of some of the most innovative and exciting companies available to public investors. The question really is whether the valuations are justified and we think market participants are starting to see opportunities to shop for bargains in a beaten down market.
This week began with remarkable optimism, as the S&P 500 continued its rally, rising another 3% from last Thursday’s close through Tuesday. That move reversed through Wednesday and Thursday and the indexes ended up just above flat for the week. With that said, we think the action continues to be constructive in the markets: we still see significant intraday moves occurring, but it is good to see something of a consolidation of the past two week’s gains. Note that the VIX index closed Thursday’s session at 20.56, which indicates that the fear that characterized the first three months of the year is beginning to subside.
With that all being said, let’s get into it!
Below is the performance data of key indices, ETFs for the five trading days between 3/25/22 and 3/31/22.
Left Brain Investment Research, Yahoo! Finance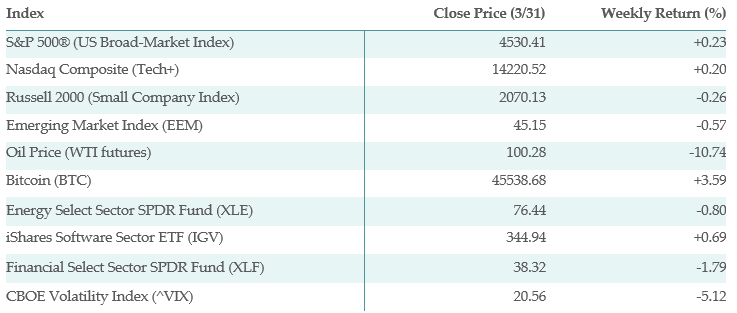
What’s Working?
Ordinarily we see interesting patterns in the weekly performance of the ETFs in our “Everything List”. This week, we are unable to draw such conclusions. With that said, these are some of the best performing ETFs this week.
The best performing ETF in our list this week was the Central Europe&Russia Fund (CEE), which rose more than 33 percent over the past week. This ETF is mostly comprised of Russian shares which are scarcely trading in the context of the sanctions on Russian interests.
Despite the fact that emerging market stocks were down this week (as seen in the table above), fixed income instruments had a strong week. Western Asset Emerging Markets Debt Fund (EMD) and Invesco Emerging Markets Sovereign Debt Portfolio ETF (PCY) were two of the strongest ETFs in this week’s trading. Interestingly, BlackRock Corporate High Yield Fund, Inc. (HYT) was up 3.66% this week, as interest rates fell during the last half of the week. High yield bond funds have seen large outflows for the first three months of 2022, so we will be watching closely to see if there is follow through in high yield. High yield performance is usually a good proxy for overall market risk tolerance.
With oil prices down as much as 9% this week, businesses that use crude oil as an input had a strong week, with Utilities Select Sector SPDR ETF (XLU) and VanEck Vectors Oil Refiners ETF (CRAK) among this week’s winners.
What is not Working?
Commodities had a very tough week. With the 9% rise in oil, you will not be surprised to see this list dominated by United States Brent Oil Fund, LP (BNO), United States Oil ETF, LP (USO), and the Invesco DB Commodity Index Tracking ETF (DBC). Another weak ETF was the SPDR S&P Metals and Mining ETF (XME), which has been one of the best performers of 2022. The worst performing ETF in our entire list was Aberdeen Standard Physical Palladium Shares ETF (PALL), which fell by more than 11% on the week.
Beyond that, we saw major pain in the economically sensitive sectors of retail and homebuilders. We saw negative 4% moves in iShares U.S. Home Construction ETF (ITB), SPDR Homebuilders ETF (XHB), and SPDR S&P Retail ETF (XRT). This is the second straight week that we have seen a pronounced down move in homebuilders, which are struggling in the context of the Federal Reserve’s tightening cycle.
First Quarter in Review
It has been an eventful quarter across an array of financial markets. From our point of view, there were two main themes: (1) the continued increase in commodity prices; and (2) a persistent rise in interest rates.
These two themes were major contributors to the negative performance we saw in virtually every sector outside of energy and commodities. CEO Noland Langford and I recapped which sector ETFs were the strongest over the first 3 months of 2022 and the pattern was undeniable: the list was absolutely dominated by energy-related ETFs like United States Natural Gas ETF, LP (UNG), VanEck Vectors Oil Services ETF (OIH), SPDR S&P Oil & Gas Exploration & Production ETF (XOP), and Energy Select Sector SPDR ETF (XLE).
Outside of energy, other ETFs with positive momentum were in the materials space, including VanEck Vectors Steel ETF (SLX) and SPDR S&P Metals and Mining ETF (XME). In our investment team meetings throughout the quarter, we have often lamented the fact that we cannot allocate entirely to energy and materials! Clearly from a portfolio context that would be a bad way to allocate investments, but it has been frustrating that little beyond commodities has worked this year.
There is more texture in the list of losers for the quarter. Among the worst performing sector ETFs in the 1st quarter were ARK Innovation ETF (ARKK), SPDR Homebuilders ETF (XHB), Renaissance IPO ETF (IPO), Invesco NASDAQ Internet ETF (PNQI), and AdvisorShares Pure US Cannabis ETF (MSOS). The thread we can pull through these worst performers is that they are traditional “risk on” sectors, which we are not surprised to see based on the action, especially in the NASDAQ over the first quarter. Additionally, the rise in 10-year interest rates has been a factor in the struggles for both homebuilders and growth stocks.
Oil Stocks vs Oil Prices: A Changing relationship
It may seem like an obvious statement that oil stocks should fluctuate with the price of oil. With that relationship in place, holders of oil stocks should be expecting their holdings to move up in way that is closely correlated with oil prices.
In general, that relationship holds. However, at a certain point, a rising oil price can be destructive for oil companies, as there is some level of demand destruction at some price level, likely above $100/barrel. Here at Left Brain, where we have been bulls on the energy business over the last few months, we watched in some level of shock and horror as the price of oil rose to $130/barrel. This is not only because of the concern for demand destruction, but also because we understood that the relationship could cut both ways: as the price of oil (predictably) fell back down to earth, would it take oil stocks down with it?
Fortunately, we have begun to see a new relationship take hold between the price of oil and the performance of oil stocks. Take a look at the year-to-date chart of Energy Select Sector SPDR ETF (XLE) as compared with the price movement of crude oil futures.
The relationship between oil stocks and oil prices has started to decouple. (TradingView)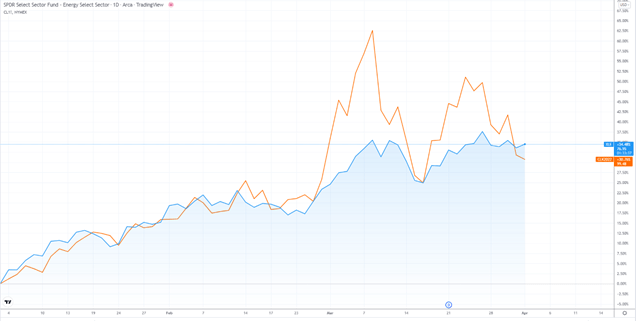
Taking a look at the chart above, we can see quite easily that that the movement of XLE and CL (oil futures) was almost exactly one-for-one for the first 8 weeks of 2022, but there was a clear decoupling at the beginning of the war in Ukraine. Though oil stocks did move higher marginally as oil futures jumped to $130/barrel, they ceased to track oil prices in a one-for-one way beginning on February 24.
Why does this all matter to energy stock investors? The answer comes in the volatility of oil prices. For instance, we have seen four separate $8/barrel moves in the price of oil in just the past week of trading! As energy investors, we would rather not see our stock positions fluctuate wildly in a time of high oil price volatility. The question is: what is really happening here? We have a couple of theories. First, oil producers are likely to be taking advantage of persistently high oil prices to hedge the price of future production, which would theoretically decrease the volatility of earnings connected with the shift in oil price.
The second theory that we have is that investors are getting better at filtering out the oil price fluctuations from their decision-making process. The “break-even” production prices for most of the US oil producing companies sits somewhere between $35-50 per barrel, so oil price movements at current levels are much less impactful on these companies’ overall profitability metrics.
Without a doubt, the supply/demand dynamic in the oil business is quite tight and has plenty to do with why the price of oil is high. With that said, part of the price increases we have seen in 2022 have been related to geopolitical developments in Eastern Europe. As we earlier stated, this artificial price increase can be a double-edged sword. With this partial decoupling between oil prices and oil stock performance, we are more confident that these stocks will remain strong, even if the geopolitical premium evaporates in the oil futures market. We remain bullish on the energy space, particularly as regards pipeline operators, integrated oil companies, and smaller exploration and production firms.
Takeaways from this Week
After two strong weeks of market action, things were more mixed this week. We saw a strong open to the week, which reversed quite heavily later in the week. The VIX continues to fall, but we still saw significant volatility in the oil markets. The 10-year US Treasury rate climbed above 2.55% at one point this week, only to fall back to 2.3% late in the week.
We saw economically sensitive sectors like financials and homebuilders struggle this week, along with commodity-related sectors like energy and metals/mining falling as commodity prices took a breather.
The first quarter was quite eventful and everything beyond energy seemed weak. A number of “bounce back” candidates are beginning to emerge and we are working in-house to develop a shopping list. We are heartened to see a change in the relationship between oil stocks and oil prices.
Be the first to comment