

Moussa81
Introduction
The London-based Endeavour Mining plc (TSX:TSX:EDV:CA, LSE: EDV, OTCQX: EDVMF) is one of the largest gold producers in West Africa, with six operating assets across Senegal, Cote d’Ivoire, and Burkina Faso and a strong portfolio of advanced development projects and exploration assets in the Birimian Greenstone Belt across West Africa.
EDVMF Map Presentation January 2023 (EDVMF Presentation)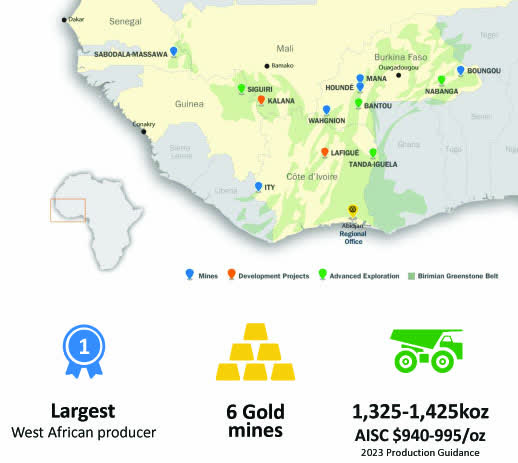
The company posted its operational and financials highlight for 4Q22 and full-year 2022 on January 23, 2023. Also, Endeavour Mining released its 2022 Presentation.
Important note: This article is an update of my article published on December 26, 2022. I have been following EDVMF on Seeking Alpha since 2021.
1 – 4Q22 and full-year 2022 Production Snapshot
Endeavour Mining announced that gold production for the fourth quarter of 2022 was 355,225 Au ounces and sold 352,448 Au ounces at an AISC of approximately $954/oz.
For the full-year 2022, the company announced a gold production of 1,410,407 Au ounces at an AISC of $928 per ounce, beating guidance of 1,315-1,400koz at an AISC within the guided $880-930/oz range.
EDVMF Yearly gold production history (Fun Trading)
CEO Sebastien De Montessus said in the press release:
2022 was another successful year for Endeavour in which we delivered against all our objectives and met guidance for the 10th consecutive year. We produced 1.4Moz of gold over the year, reaching the top end of our guidance. We are particularly pleased to have achieved our all-in sustaining cost guidance of below $930/oz, despite the inflationary pressures impacting the industry, as a result of our strong production performance and optimisation initiatives
2 – Investment Thesis
Endeavour Mining continues to present an excellent financial profile. One characteristic that increases the company’s risk profile is that Endeavour mines exclusively in West Africa, which is not considered a safe jurisdiction compared to North America. This element should be factored into your strategy imperatively.
On the other side, Endeavour Mining has a well-diversified assets portfolio which provides some protection.
Finally, Endeavour Mining is paying a semi-annual dividend of approximately $0.41 per share or a dividend yield of 3.4%:
Endeavour is pleased to announce its H2-2022 interim dividend of $100 million or approximately $0.41 per share based on its current issued share capital. As such, the total dividend amounts to $200 million or approximately $0.81 per share for FY2022, which represents $50 million or 33% more than the minimum dividend commitment for the year, reiterating Endeavour’s strong commitment to paying supplemental shareholder returns.
Also, the share buyback program continued in 4Q22 with $24.2 million worth of shares repurchased in 4Q22 (totaling $98.7 million in 2022).
One important financial item for Endeavour is primarily the price of gold. Gold has recovered significantly since September and is now up 7% on a one-year basis. The Fed raised interest by 50 points in early December and indicated that it would increase interest rates by two hikes of 25 points each, which pushed the market to turn bullish on gold.
EDVMF Gold, Silver, Copper prices 1-Year chart (Fun Trading StockCharts)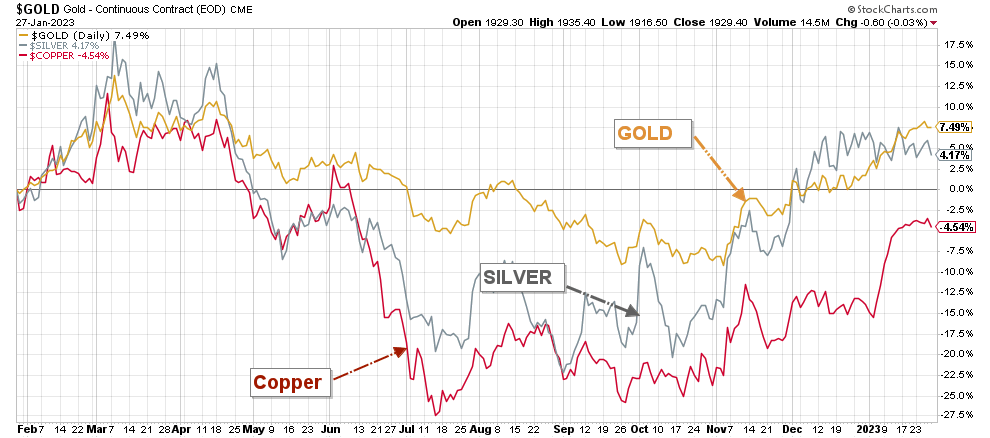
This situation has raised the gold price average to well above $1,900 per ounce, which is a solid boost to future earnings. However, the Fed is about to hike interest rates by 25 points this coming week, and it is still unknown how it will receive the news.
Thus, the best way to profit from such a volatile market is to trade short-term LIFO of about 35%-45% of your total position and use your short-term gain to increase your core long-term position for a much higher target.
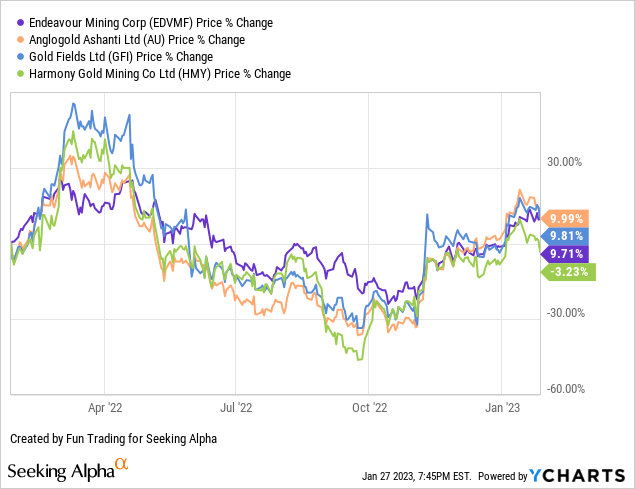
3 – Stock Performance
EDVMF has performed well on a one-year basis and is up 10%, comparable to most of its peers.
Endeavour Mining – Balance Sheet History And Trend – The Raw Numbers
| Endeavour Mining | 4Q21 | 1Q22 | 2Q22 | 3Q22 | 4Q22 |
| Total Revenues in $ Million | 697.17 | 686.20 | 629.6 | 567.6 | – |
| Net income attributable to shareholders in $ Million | -106.36 | -42.20 | 189.4 | 57.6 | – |
| EBITDA $ Million | 85.27 | 215.40 | 414.6 | 299.2 | – |
| EPS diluted in $/share | -0.48 | -0.17 | 0.76 | 0.23 | – |
| Operating Cash flow in $ Million | 355.78 | 304.30 | 253.20 | 153.7 | – |
| Capital Expenditure in $ Million | 132.30 | 85.20 | 140.30 | 121.4 | – |
| Free Cash Flow in $ Million | 223.49 | 219.10 | 112.90 | 32.3 | – |
| Total Cash $ Million | 906.20 | 1,054.30 | 1,109.8 | 888.9 | 1,002* |
| Total Long-term Debt in $ Million | 841.90 | 916.80 | 885.10 | 829.9 | 830 |
| Shares outstanding (diluted) in Million | 251.82 | 249.64 | 249.06 | 248.31 | – |
| Production Au Oz | 4Q21 | 1Q22 | 2Q22 | 3Q22 | 4Q22 |
| Total Production Gold | 398.0 | 367.0 | 345.1 | 342.7 | 355.2 |
| AISC (co-product) from continuing operations | 900 | 848 | 954 | 960 | 954 |
| Gold Price realized | 1,787 | 1,911 | 1,832 | 1,679 | 1,758 |
Source: Company M&A. Fun Trading files.
*Total cash is estimated. Cash and cash on hand is $951 million as of December 31, 2022.
4 – Debt Situation in 4Q22; No Net Debt and Total Cash of approximately $1,002 million; Liquidity $1.53 billion
EDVMF Quarterly Cash versus Debt history (Fun Trading) Cash and cash equivalent ($951 million) and investments were approximately $1,002 million, and the debt (including current) was $829.9 million at the end of December 2022. The company continues to be net debt-free, with net cash of $121 million (according to the company). Available liquidity is now $1.51 billion. EDVMF Financial position at the end of December 2022 (EDVMF Presentation)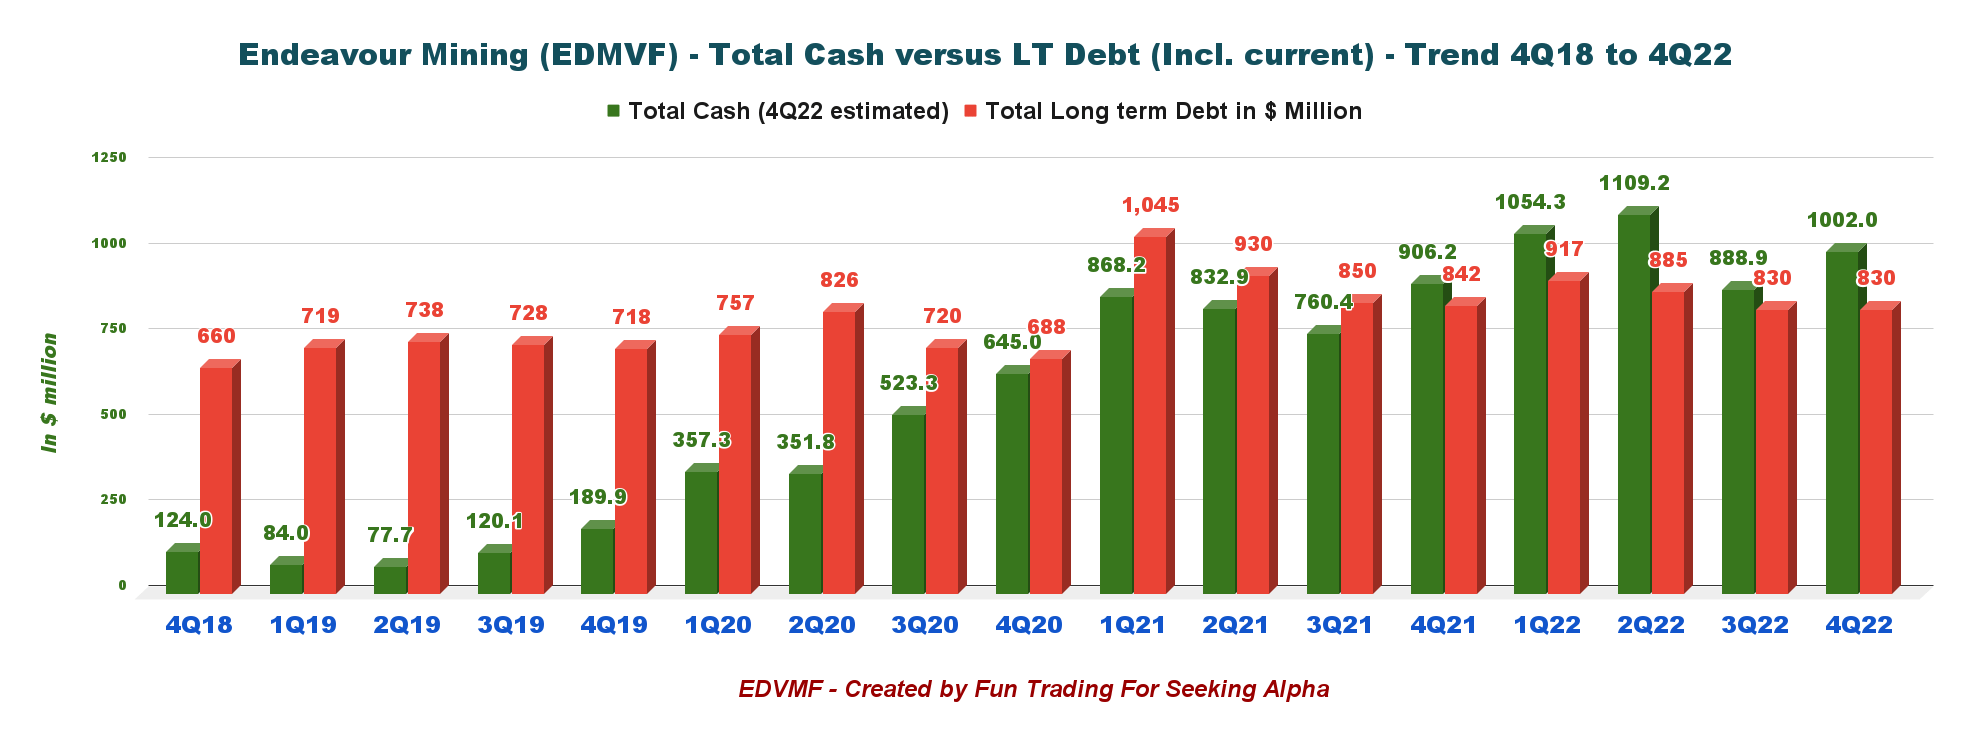

5 – Quarterly Gold Production Analysis
5.1 – Quarterly Gold Production
EDVMF Quarterly gold production history (Fun Trading)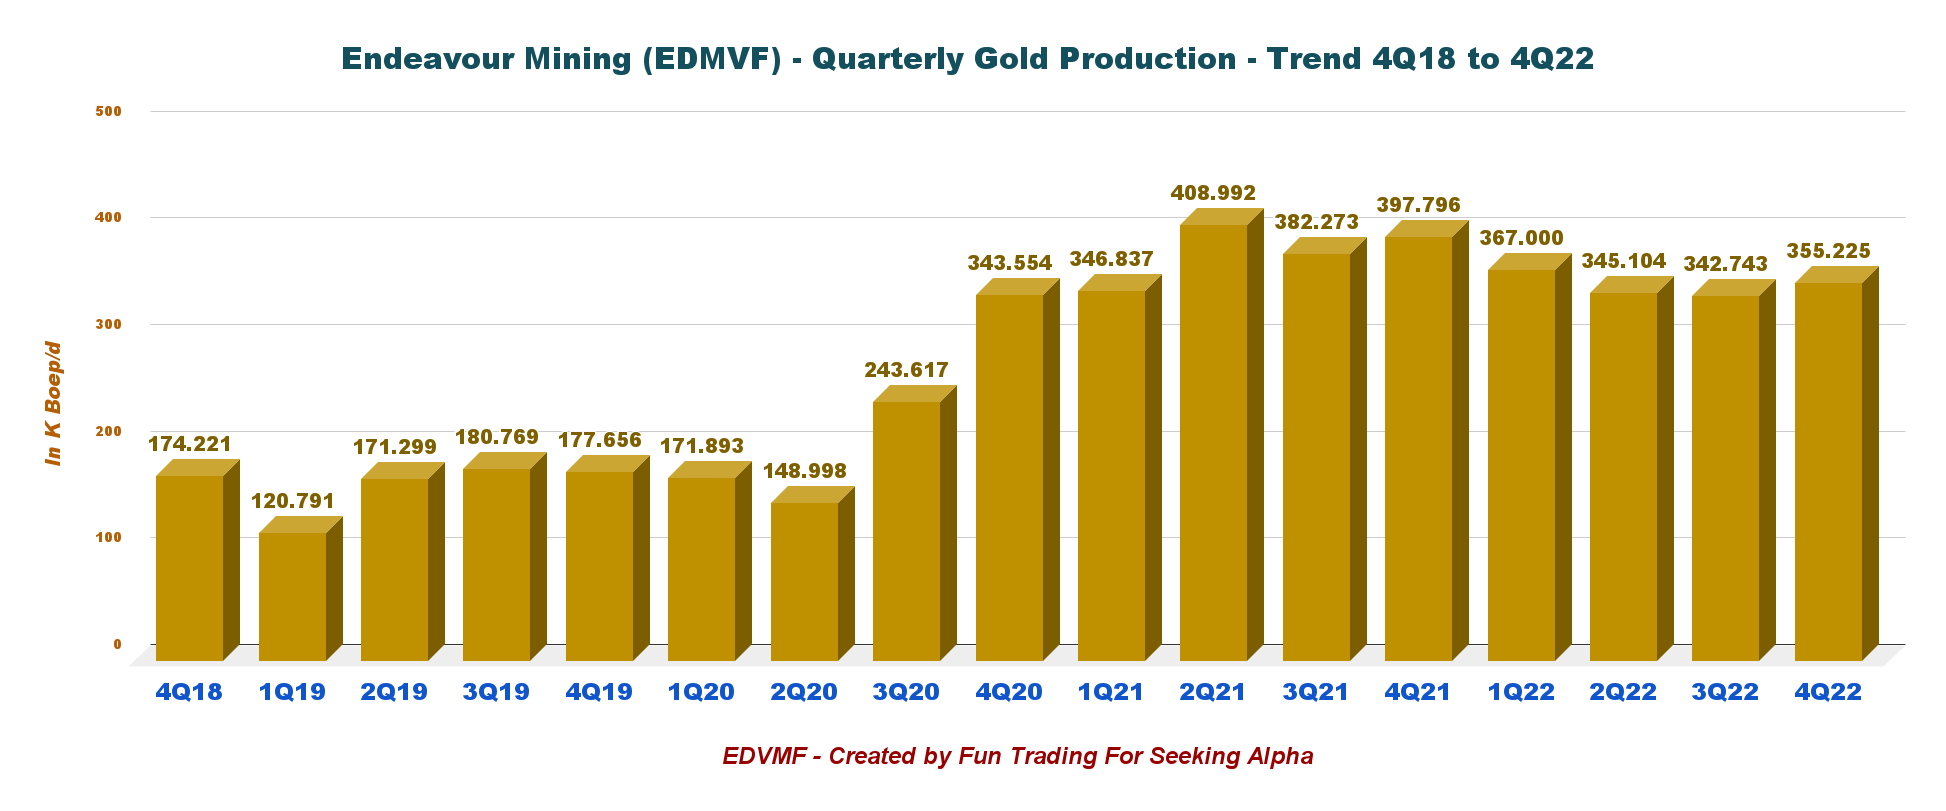
4Q22 gold production from continuing operations was 355,225 Au ounces, slightly increasing over 3Q22. Production was up 3.6% sequentially.
5.2 – Gold production per mine. Comparison between 4Q21 and 4Q22
EDVMF Quarterly Production 4Q21 versus 4Q22 (Fun Trading)
Production for 4Q22 decreased significantly compared with 4Q21, mainly because the company sold its Karma mine.
5.3 – Quarterly Gold price realized and AISC
AISC for all operations decreased slightly this quarter to approximately $954 per ounce, which is still excellent but higher than 4Q21 due to inflationary pressures.
EDVMF Quarterly AISC and Gold price history (Fun Trading)
6 – Sabodala-Massawa project BIOX expansion and the new 80%-owned Lafigué Project:
Production is expected to be between 315K to 340K Au ounce in 2023, with an AISC between $760 and 810 per ounce. P&P reserve is 4.44 Moz with M&I resources of 6.877 Moz. However, the BIOX expansion is expected to be completed in H1 2024 (first gold).
EDVMF Sabodala-Massawa mine (EDVMF Presentation)
Also, the new project Lafigué in Côte d’Ivoire has started and will be completed in 2024. The 80%-owned Lafigué project construction decision was announced the 17 October 2022.
7 – 2023 Guidance – 1.325-1.425 Moz with AISC of $940-$995 per ounce.
EDVMF 2023 Guidance (EDVMF Presentation)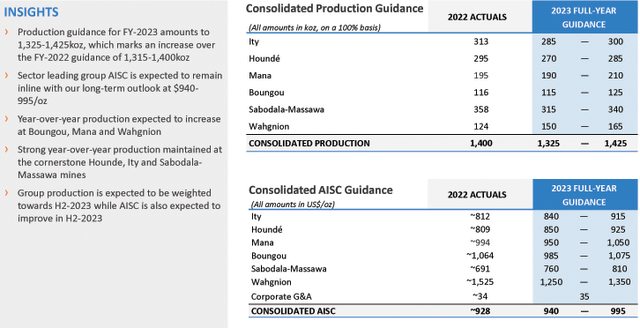
Commentary And Technical Analysis
EDVMF TA Chart short-term (Fun Trading StockCharts)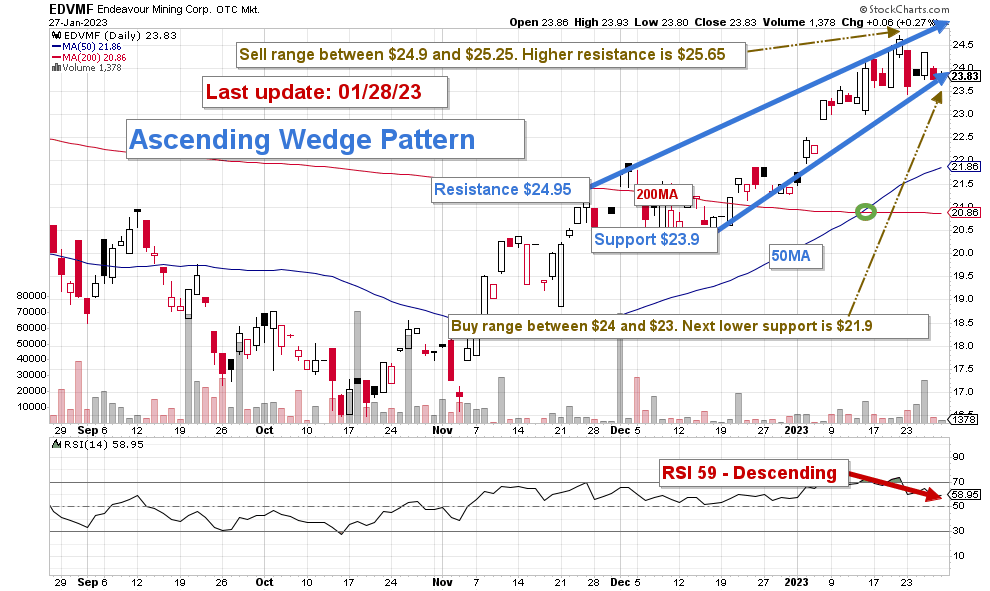
Note: The chart is adjusted for dividends.
EDVMF is highly correlated to the gold price. Thus, the Fed decision coming this week will be crucial for the gold price and EDVMF. The gold price should retrace next week and retest at $1,880 per ounce.
Thus, the best-adapted approach is to sell EDVMF short-term LIFO while keeping a core long-term position for a much higher final target. It is what I am suggesting in my marketplace, “The Gold and Oil Corner.”
Watch the gold price like a hawk.
Editor’s Note: This article discusses one or more securities that do not trade on a major U.S. exchange. Please be aware of the risks associated with these stocks.
Editor’s Note: This article discusses one or more securities that do not trade on a major U.S. exchange. Please be aware of the risks associated with these stocks.
Be the first to comment