

onurdongel/E+ via Getty Images
Natural gas and natural gas liquids have a bright future in the energy landscape. According to recent research by the U.S. Energy Information Administration, domestic natural gas production is expected to be fully recovered to pre-COVID-19 levels by early 2023 and the long-term growth profile remains promising. In particular, international export potential looks increasingly robust due to global demand growth as developing economies look for affordable clean energy alternatives to fuel their growth. In fact, the EIA expects U.S. LNG exports to more than double between 2020 and 2029. As a result, natural gas production is expected to increase steadily through 2050, giving it nearly 3 decades of growth runway at a minimum.
For investors looking to ride the natural gas and NGL wave and who are looking for attractive current income combined with steady long-term growth that is at least somewhat indexed to inflation, two promising investments include ONEOK (NYSE:OKE) and Enbridge (NYSE:ENB). In this article, we will compare them to see which is more attractively priced today.
OKE Stock: Natural Gas Pureplay With Stronger Growth Potential
OKE owns a high-quality portfolio of assets that have performed well through tumultuous energy markets in recent years. It is a great way to invest in the natural gas and NGL trend as it derives all of its EBITDA from these segments. In 2021, 26.3% of its EBITDA came from natural gas gathering and processing, 58.1% came from NGLs, and 15.6% came from natural gas pipelines.
As the chart below illustrates, over the past decade OKE has seen its distributable cash flow per share growth every year except for 2020, though the 10.1% decline was quite modest given the headwinds facing the global economy and energy sector in particular. It is even more impressive when you consider that natural gas liquids volumes in its main areas of operation declined by over 20% sequentially in Q2 2020.
Furthermore, cash flow generation bounced back quickly and this year DCF/share is expected to be 29.3% higher than it was in 2019, good for an 8.94% CAGR over that span.
Much of this performance strength lies in the fact that 90% of OKE’s earnings are fee-based, ~85% of its customers are investment-grade, and what little commodity price exposure it has is hedged, making its cash flows extremely resilient to market headwinds.
OKE DCF/Share (TIKR)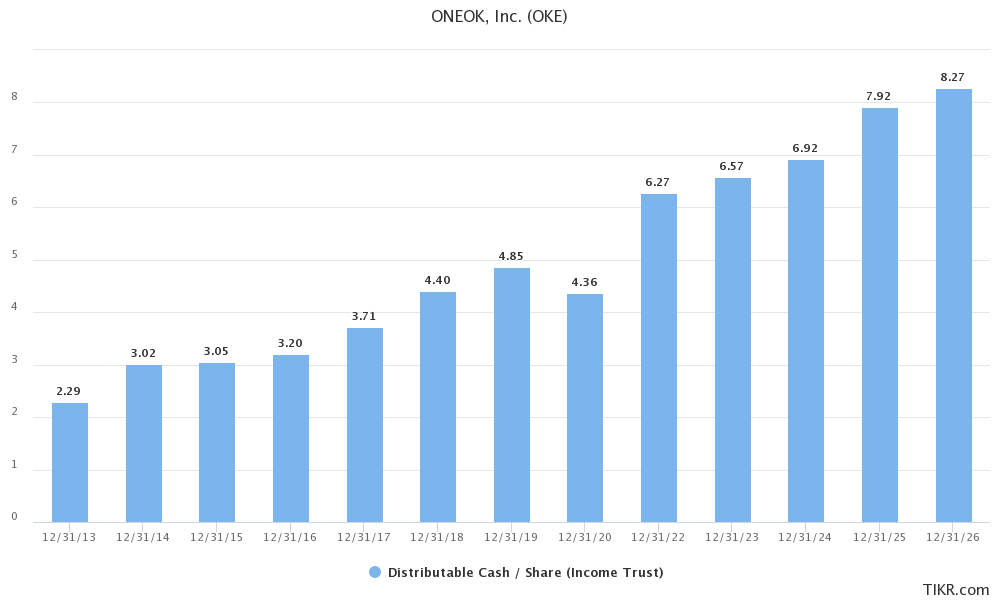
Moving forward, growth is expected to remain quite strong as well, with DCF/share forecast by analysts to grow at a 7.1% CAGR between 2023 and 2026. This growth is likely to be driven by a combination of the aforementioned strong growth in natural gas and NGL demand, inflation-indexed pipeline contracts, share buybacks, and continued opportunistic growth investments. In particular, it expects to see increased production activity driving growth in its pipeline volumes in the Rockies, where it is currently running at just 62% of its full capacity.
While the company certainly has a lot going for it, the valuation profile is a bit less compelling. The dividend yield looks attractive at 5.3%, especially when combined with the expected 5% free cash flow CAGR and the 7.1% DCF/share CAGR over the next four years. However, when compared to its history and rising interest rates, it is a bit less attractive. Over the past five years, the average dividend yield is 6.83%. The EV/EBITDA ratio is roughly in line with recent averages at 12.37x compared to the five-year average of 12.68x.
ENB: More Diversified Portfolio With A Higher Yield
ENB owns an even more impressive portfolio of high-quality and well-diversified midstream energy assets. In fact, it is the largest natural gas distributor and the second largest natural gas transmitter in North America with the second longest natural gas pipeline network on the continent. As a result, it is responsible for transporting a whopping 20% of the natural gas consumed in the United States.
However, unlike OKE which is a natural gas/NGL midstream pureplay, ENB has much greater diversification, with the largest crude oil pipeline network in North America that enables it to move a quarter of its crude oil. ENB also has a growing renewable energy asset portfolio. While renewable energy production made up just 3.6% of ENB’s total EBITDA in 2021, it is a rapidly growing segment of the business and will become a bigger part of the business model in the years to come.
As the chart below illustrates, over the past decade ENB has seen its distributable cash flow per share growth every year except for 2017 when an energy crisis hit. However, in contrast to OKE, ENB weathered the 2020 energy market crash very well as it saw its distributable cash flow per share actually grow by 2.2% year-over-year. DCF per share has continued to grow at a strong pace since then, increasing by 6.2% in 2021 and expected to grow by 7.5% this year.
Much of this performance strength lies in the fact that ENB’s cash flows are 98% sourced from either take-or-pay, fee-based, or hedged contracts. On top of that, ~95% of its customers are investment grade or equivalent, positioning the company exceptionally well to weather energy market volatility.
ENB DCF/Share (TIKR)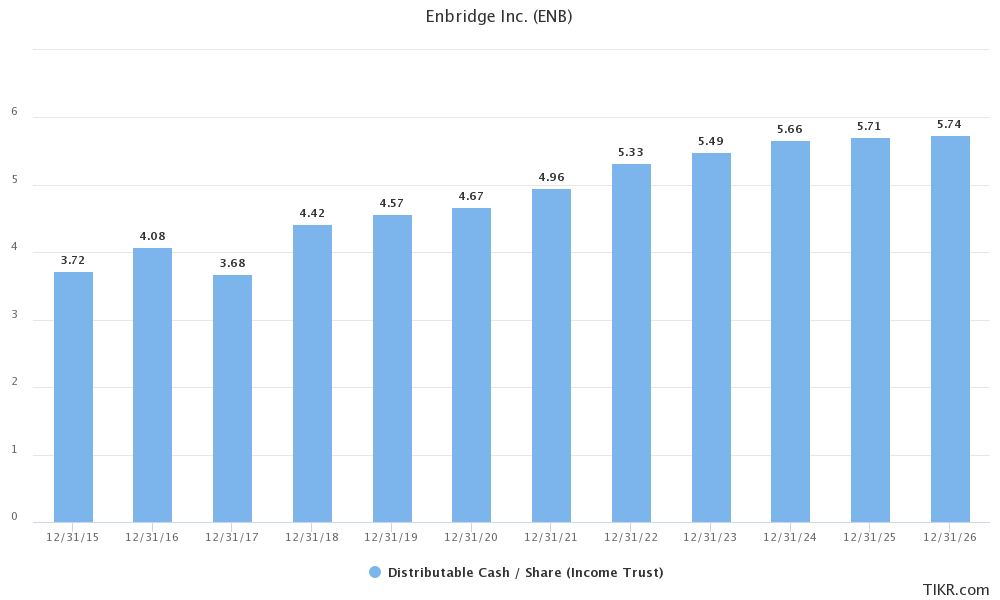
Moving forward, ENB’s DCF/share growth prospects are not as rosy as OKE’s according to analyst estimates with just a 1.9% CAGR forecast through 2026.
Looking at its valuation, ENB compensates for some of that weaker growth profile with a much more attractive dividend with a forward yield of 7.2%. This gives it a 190 basis point yield advantage over OKE. That said, its EV/EBITDA multiple of 13.32x stands at a steep premium to OKE’s as well as ENB’s own recent history (five-year average is 12.74x).
Investor Takeaway
Both OKE and ENB have phenomenal, battle-proven business models that are poised to benefit from long-term growth in natural gas and NGLs. They also both offer investors strong current income yields along with steady long-term growth prospects. When comparing OKE with ENB, it really boils down to these differences:
- OKE offers better total return potential given its substantially greater growth, lower valuation, and better yield plus growth combination.
- ENB offers better current yield as well as a convincingly more conservative positioning thanks to its much larger and better diversified business model, higher focus on investment grade customers and fixed-fee contracts, longer dividend growth track record, better performance during 2020, and superior balance sheet (BBB+ credit rating compared to BBB for OKE).
While both companies are reasonably priced ways for income investors to play the long-term bullish outlook for the natural gas industry, OKE is better suited to more aggressive investors who would rather forego some current income and take on a bit more risk in exchange for greater growth potential whereas ENB is better suited for conservative investors looking for attractive current yield.
Be the first to comment