spooh
Thesis
Enbridge (NYSE:ENB) and Enterprise Products Partners (NYSE:EPD) have recently gained the elite status of dividend champions. As of 2022, ENB has been growing its quarterly dividend payouts consecutive for 26 years and EPD for 25 years. They are currently the only two mid-stream stocks in this elite club.
Since I mentioned “stocks”, I wanted to first clarify the use of terminology before going any further. For hardcore MLP investors, they should be called partnerships, not stocks or companies. Also, their dividends should be called “distributions” and their shares be called “units”. Although I imagine there will be a multitude of readers from various backgrounds. Thus, I will use these above terminologies interchangeably for the remainder of this article – both for the sake of convenience in my writing and also for the ease of reading for readers more familiar with stocks.
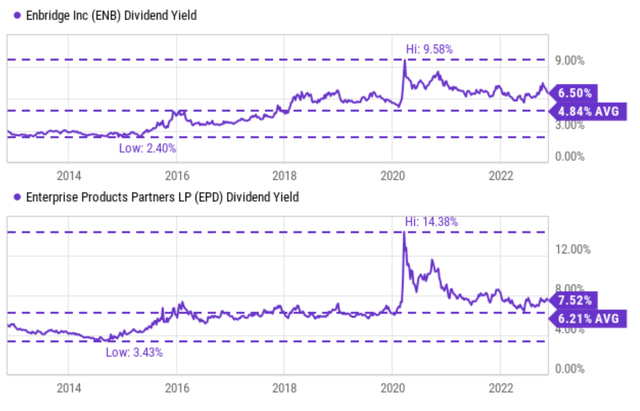
Both ENB and EPD are in a very attractive spot now for income-oriented investors. They are both offering generous and stable dividends currently, not only in absolute terms but also compared to their own track record. As seen in the chart below, ENB is yielding 6.5% and EPD yielding 7.52%.
And the thesis of this article is twofold. First, I will argue that they are not only attractive because of their current high yield. They are also in a strong position now, near the strongest position in 10 years actually, to keep growing their dividends going forward. Second, even though I feel both to be strong candidates in the mid-stream space, I do feel they are best suited for a specific set of investors with specific goals. And you will see that my overall verdict is that ENB is better suited for investors with a more aggressive risk profile, while EPD is better for more conservative investors.
ENB and EPD: Q3 recap
Both ENB and EPD have reported strong results in their recent Q3 earnings report (“ER”). To wit, ENB’s Q3 Non-GAAP EPS dialed in at C$0.67, beating consensus estimates by C$0.03. Revenue came in at C$11.57B, representing a small growth of 0.9% YoY and missing consensus estimates slightly by C$900M. However, its distributable cash flow (“DCF”) grew to $2.5 billion or $1.24 per share, translating into a healthy annual growth rate of 8.7% compared to its last year’s figures ($2.3 billion or $1.13 per share). It also reiterated its 2022 full-year outlook for DCF per share in a range between $5.20 to $5.50.
Q3 results for EPD are equally strong, beating consensus estimates on both lines. Its Q3 GAAP EPS came in at $0.62, exceeding consensus estimates by $0.01. And its revenue dialed in at $15.46B, representing a remarkable 42.8% YoY growth and exceeding consensus estimates by $1.64B. Its DCF, excluding extraordinary items such as asset sales, grew 16% to $1.9B in Q3, translating into an annual growth rate of 19% compared to $1.6B for the same quarter last year.
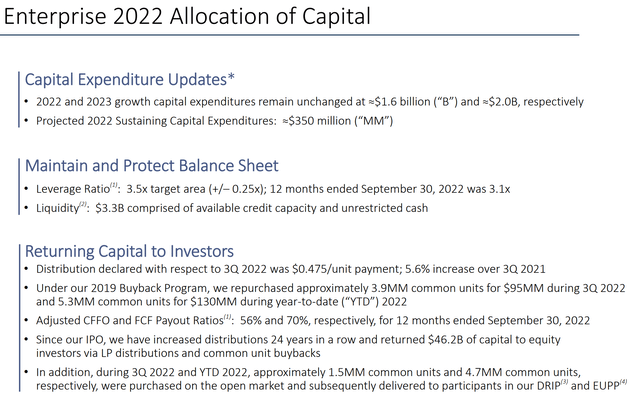
Looking forward, both ENB and EPD are in a strong position not only to cover their current dividends but also to keep raising them. For example, EPD’s projected DCF provides 1.8x coverage of its current dividend distributions and also leaves room for its buyback programs.
ENB and EPD: Profitability and dividend safety
Of course, dividend safety in the long term ultimately hinges on business fundamentals and sustainable profitability. And in both EPD and ENB’s cases, their safety is supported by consistent profitability and our societal energy demand.
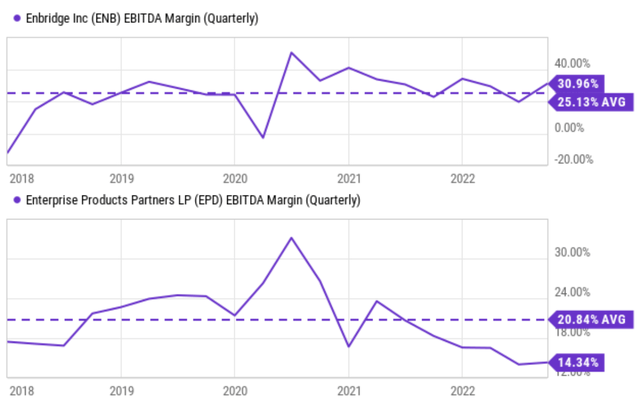
As seen from the chart below, their profitability metrics are similar in many ways. But no matter how you slice and dice these metrics, my overall feeling is that ENB enjoys better profitability. Let’s start with topline metrics and take the gross profit margin as an example. END features a gross profit margin of around 38%, far above EPD’s 11.5%. Moving onto bottom-line metrics such as EBITDA and net margins, the comparison is similar. ENB features a net margin of around 11.3%, more than 200 basis points above EPD’s 9.12%. Although 9.12% is a healthy margin in itself. As a reference point, the average profit margin for the overall economy averages around 8% in the long run and rarely goes above 10%. The comparison in EBITDA margin is even more dramatic. ENB’s EBITDA hovers around 23.3%, more than 800 basis points above EPD’s 15.1%. And ENB has been maintaining such a lead in the long term too as you can see from the 2nd chart below.
Seeking Alpha data Seeking Alpha data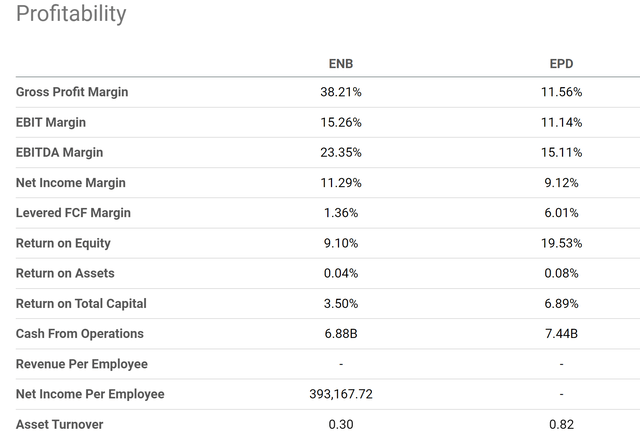
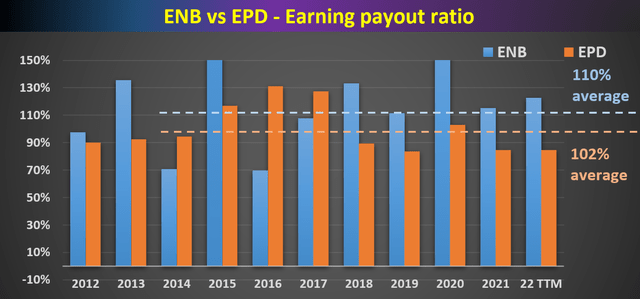
And for dividend growth investors, I am sure we all know the common metrics to gauge dividend safety (e.g., earnings payout ratio, cash payout ratio, et al.). The two charts below show ENB and EPD’s earnings and cash payout ratios. As you can see, both ENB and EPD have been consistently managing their distributions in the past and that’s how they become dividend champs. To wit, at a very overall level, ENB and EPD’s payout ratios are essentially identical. In terms of cash payout ratio, ENB’s average ratio is 62% in the recent 5 years, only 4% above EPD’s average of 58%. In terms of earnings payout ratios, ENB’s average has been 110% in the past 5 years, again only 8% above EPD’s 102% average.
Author based on Seeking Alpha data Author based on Seeking Alpha data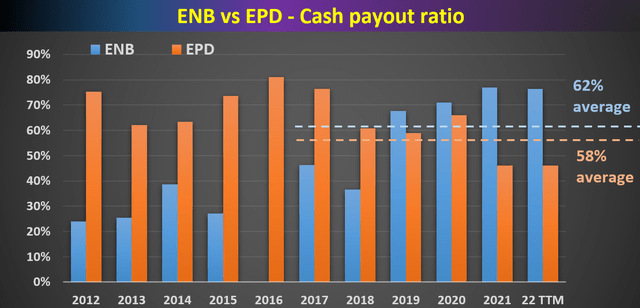
ENB and EPD: Dividend cushion ratios
These pay-out ratios enjoy simplicity, but we always want to go a step further for a more accurate and comprehensive assessment. As detailed in our earlier article, the above simple payout ratios could be limited and misleading in the following ways:
- These payout ratios ignore the current asset that a firm has on its balance sheet. Obviously, for 2 companies with the same earning powers, the one with more current assets sitting on its balance sheet should have a higher level of dividend safety.
- These simple payout ratios also neglect the pending financial obligations. Again, for 2 companies with the same earning powers, the company with a lower level of pending obligations (pension, debt, CAPEX expenses, et al) should obviously have a higher level of dividend safety.
For a more accurate assessment of dividend safety, we find the so-called dividend cushion ratio (“DCR”) an effective tool. Details of the DCR can be found in Brian M Nelson’s book entitled Value Trap. And the DCR in this article is analyzed following the procedure below:
The DCR measure is a ratio that sums the existing net cash (total cash less total long-term debt) a company has on hand (on its balance sheet) plus its expected future free cash flows (cash from operations less all capital expenditures) over the next 5 years and divides that sum by future expected cash dividends (including expected growth in them, where applicable) over the same period. If the DCR is significantly higher than 1, the company generally has sufficient financial strength to pay out its future dividends. The higher the DCR, the safer the dividend, all else equal.
In my following analysis, I made one revision to the above method. Instead of subtracting the total long-term debt, we subtracted the total interest expenses over a 5-year period. The reason for this revision is to adjust the status of businesses such as ENB and EPD. Mature businesses like ENB and EPD probably will never need to repay all of their debt at once. But them do have to service their debt and cover the interest expenses at all times.
With this background, the DCR for ENB and EPD are shown in the chart below. The key observation from here is that their true dividend safety is even stronger than the payout ratios shown above, especially in the case of EPD. Both stocks boast the strongest dividend safety in terms of DCR in a decade. A few highlights:
- The payout ratios above would suggest that their current dividend coverage is equally strong as in the past few years. However, their DCR shows a completely different picture. Neither of them had very no “cushion” at all back in 2016 and ENB actually suffered from a negative DCR at that time. In other words, their dividend distributions had been hand-to-mouth at that time and could not absorb any earnings hiccup.
- Then, as seen, both of them have improved their DCR since 2016. And currently, both of their DCRs stand at a peak level since 2016. ENB’s DCR turned positive in 2019 and its current value is a healthy 0.56x. EPD’s improvement is even more dramatic. Its current DCR sits at 1.47x, far better than the 1x threshold mentioned above. A 1.47x DCR roughly means it has enough cushion to cover dividends even if its earnings suffer speed bumps about 2 years in a row.
Author based on Seeking Alpha data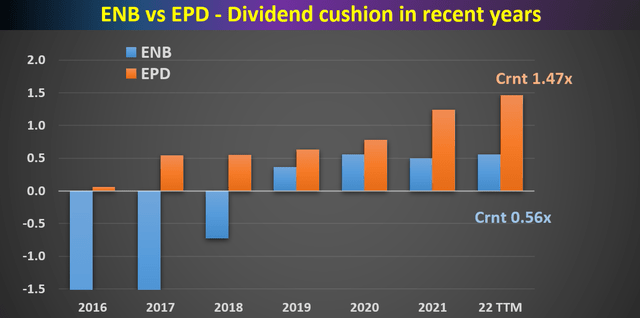
ENB vs. EPD: Valuation and Projected Returns
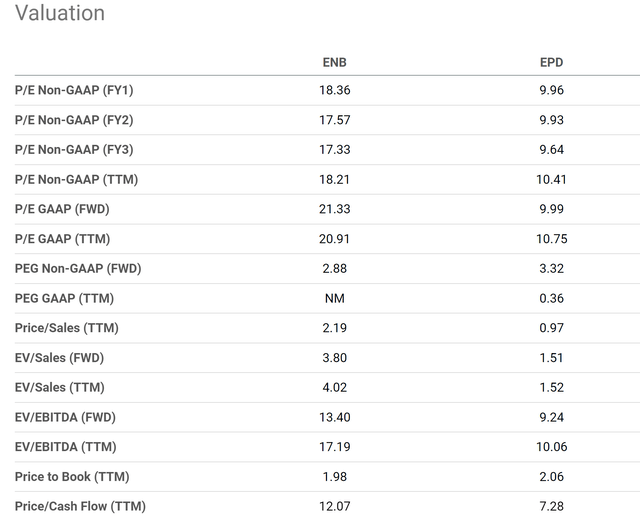
In terms of valuation, ENB is valued at a large premium compared to EPD due to its superior profitability aforementioned. EPD’s valuation is almost 2x higher than EPD in terms of FY1 PE ratio (18.3x vs 9.9x). Considering that ENB is relatively more leveraged, let’s look at leverage-adjusted valuation metrics too. And such metrics show a similarly large premium. For example, in terms of the TTM EV/EBITDA ratio, ENB’s valuation is 17.2x, about a 70% premium compared to EPD’s 10.0x as seen.
Given their dividend champ status, I think another very informative valuation metric would be their dividend yield. As aforementioned, ENB is currently yielding 6.5%, about 34% above its historical average of 4.84%. EPD is yielding 7.52%, about 21% above its historical average of 6.21%. Hence, under their current conditions, I see that ENB is at a large discount than EPD despite its higher multiples in absolute terms.
As detailed in our earlier articles, I am projection similar total return potential for both stocks in the next ~5 years: both in the double-digit range. Although I foresee a better total return potential from ENB due to its profitability metrics and also its more compressed valuation by its historical standard.
Risks and final thoughts
Both ENB and EPD entail certain risks. They face largely the same macroscopic risks in terms of energy supply uncertainties (for example, caused by the pandemic, geopolitical tensions in Europe, and also the possibility of a recession). Higher borrowing cost is another risk common to both stocks. Both of them depend on debt financing to a significant extent. And finally, climate and environmental concerns are constantly a risk for both of them (together with the rest of the sector too). Finally, master limited partnerships have specific tax implications that could make them unsuitable for certain accounts.
To conclude, my final verdict is that both ENB and EPD are strong candidates for income-seeking investors. They offer an attractive combination of generous payouts, dividend safety, and favorable price appreciation given their current valuation discounts. In particular, their true dividend safety is even stronger than the simple payout ratios shown on the surface, especially in the case of EPD. In terms of Dividend Cushion Ratios, both are in the strongest position in a decade.
Although I feel each is better suited for a specific audience with specific risk profiles. My recommendation is that ENB is better suited for investors with a more aggressive risk profile, while EPD is better for more conservative investors. My estimate shows that ENB offers a larger price appreciation potential and a large total return potential, at the cost of higher valuation multiples, lower dividend yield, and also lower safety level. And EPD offers the opposite.


Be the first to comment