

Vladimir Zakharov
Intro
We wrote about iShares MSCI Emerging Markets ETF (NYSEARCA:EEM) back in March of this year when we recommended a delta neutral strangle due to the high levels of implied volatility in the fund at the time. Although the ETF has lost roughly 19% over the past 6+ months, selling strangles would have been a sound play in EEM, given how the position could have been defended through rolling the put side of the strangle, both down in strike and out in time over time.
Before we get into how we view EEM now from a strategy viewpoint, let’s take a look at the technical chart to see the fund’s state of affairs at the moment. Suffice it to say, the fund (demonstrated by how low the long-term histogram has fallen to as well as the RSI momentum indicator), has not been this oversold since 2008 which is revealing in itself. In saying this, we still are nowhere near a bullish crossover on the MACD indicator, although shares are now coming up against very strong underside resistance which dates back to 2008. This means that trend followers due to the sustained trend of lower highs and lower lows remain bearish in this fund.
Technical Chart of EEM (Stockcharts.com)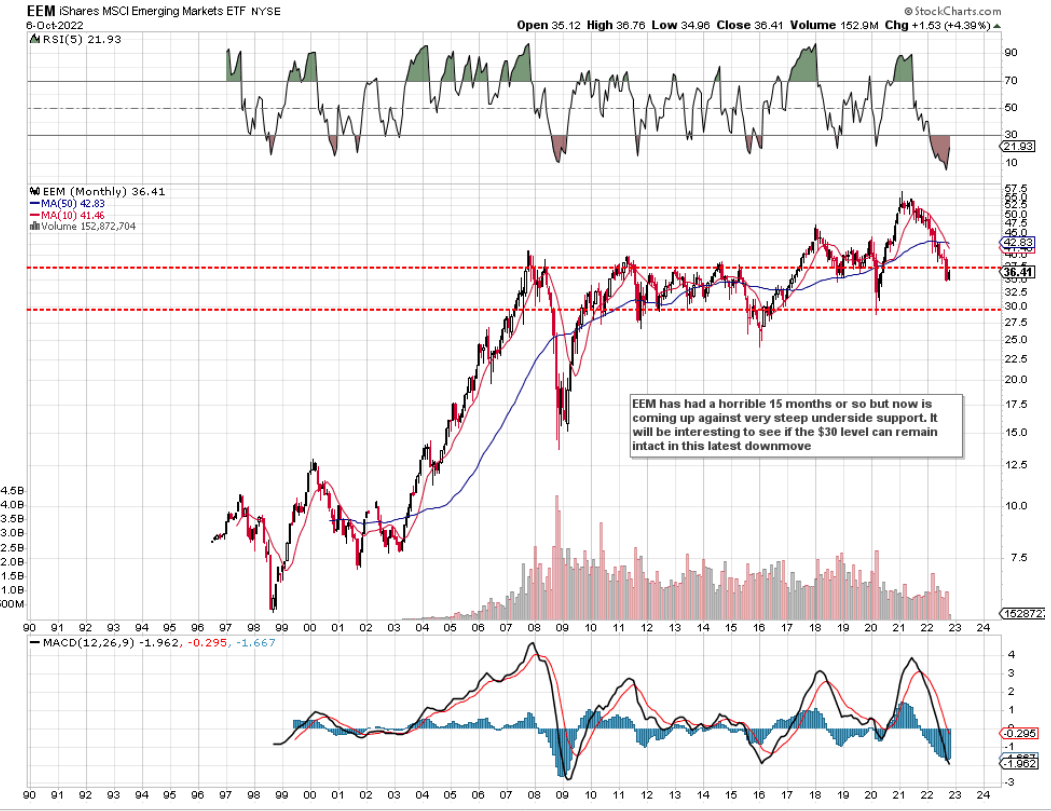
Bearish Sentiment
Bearish sentiment can be further confirmed by the rise of short interest (13%+) in the fund and the high level of implied volatility (25%+) as we can see below. Both of these parameters are well above standard norms for EEM and denote elevated risk for the seasoned ETF investor.
However, when sentiment is at extremes, there always is an opportunity for the contrarian if one has the courage to go against the grain. For one, we have that multi-year underside support, which should at the very least slow down the sustained pattern of lower lows we have seen for months now. For a contrarian, this may be all that one needs. Let me explain.
EEM Implied Volatility v Historic (Interactive Brokers)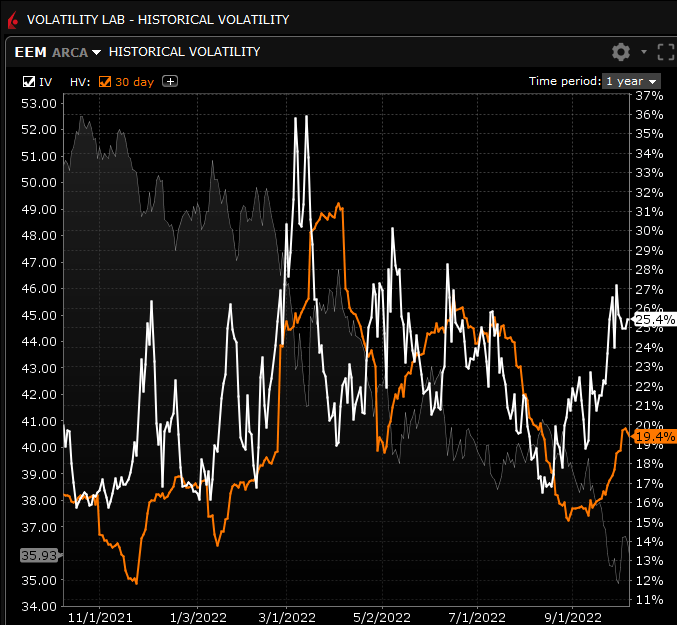
Volatility Is Always High Close To Bottoms
When selling options over a short timeframe (like 2 months), time decay or theta really works in one’s favor. In fact, given where implied volatility is in EEM at present and how closely this fund has been tracking SPY, a broad range bottom in equity markets, in general, will most likely result in a contraction in volatility which would again favor the option seller as one could profit not only from theta but also from vega.
Another way to take advantage of the present setup in EEM is to take advantage of the fund’s put skew. When there is more fear of the downside, a 30 delta put for example with be richer in premium than a corresponding 30 delta call option. Therefore, since puts trade richer than calls which means that call spreads trade richer than their corresponding put spreads, some undefined risk option strategies to consider would be a naked put, a jade lizard (Combination of an out-of-a-money naked put with an out-of-the-money call spread) or a ratio spread. After sizing up the three options, we believe the ratio spread is the best choice for the following reason.
Ratio Spread
Although I’m sure there will be options traders who may opt for the Jade Lizard as it is a high probability of profit setup also, we are favoring being directional in EEM at present. The worst-case scenario of all three strategies is the defense of a naked put. This is not a problem from a risk standpoint as, given the amount of diversification and holdings which make up EEM, we can simply roll down and out until we can finally book a profit.
EEM Holdings Breakdown (Seeking Alpha)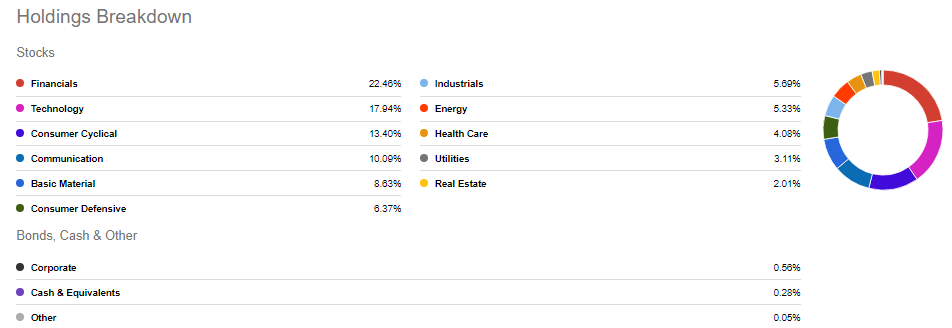
With the ratio spread, however, we can get the lowest cost basis, which is key. Remember, the put spread is made up of a long bearish put spread and a short put. As we can see below, given the cheapness of the put spread (Which could yield $100 if the trade goes against us) and the richness of the $34 naked put, we can bring down our cost basis substantially from where shares are trading at presently.
| Present EEM Price | $35.92 |
| Long November $35/$34 put spread cost (Debit) | +$26 |
| Short $34 Naked put option (Credit) | -$58 |
| Ratio Spread Cost (Credit) | -$32 |
| Breakeven On Trade (Cost Basis) | $32.68 |
| Probability of Profit | 86% |
Conclusion
Although EEM has been getting absolutely hammered in recent sessions, we would caution against a delta neutral strategy in here in case of a violent turnaround to the upside. We believe the sale of a put ratio spread is the best strategy in the fund at present. We look forward to continued coverage.
Be the first to comment