

Lemon_tm
Written by Nick Ackerman, co-produced by Stanford Chemist. A version of this article was published to members of the CEF/ETF Income Laboratory on October 7th, 2022.
Eaton Vance Tax-Managed Buy-Write Strategy Fund (NYSE:EXD) has bumped up to a premium since the last time we covered it. To be fair, though, the fund was only at a slight discount when we last touched on it. This premium has expanded quite materially in just the last week or so. Either way, that has actually helped it dodge some of the downturn we saw in the broader market. At least on a share price total return basis.
EXD Performance Since Previous Update (Seeking Alpha)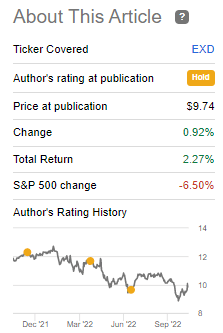
Now that the fund is at a premium, it still might not be time to panic out of the fund. It remains fairly attractive compared to its sister fund at this time or a “Hold.” However, with equities down across the board, putting some capital to work in a quality name such as EXD could be a compelling option for long-term investors.
The Basics
- 1-Year Z-score: 2.56
- Premium: 9.76%
- Distribution Yield: 8.58%
- Expense Ratio: 1.26%
- Leverage: N/A
- Managed Assets: $89.5 million
- Structure: Perpetual
EXD’s strategy is to “invest in a diversified portfolio of common stocks and write call options on one or more U.S. indices on a substantial portion of the value of its common stock portfolio to seek to generate current earnings from the option premium. The Fund’s portfolio managers use the adviser’s and sub-advisers internal research and proprietary modeling techniques in making investment decisions. The Fund evaluates returns on an after-tax basis and seeks to minimize and defer federal income taxes incurred by shareholders in connection with their investment in the Fund.”
EXD is on the smaller side, even for closed-end funds. This can be a risk to larger investors that need a lot of liquidity. It is just over $93.7 million in total managed assets. For a larger fund that’s virtually similar, one could consider its ~$1.341 billion sister, Eaton Vance Tax-Managed Buy-Write Opportunities Fund (ETV). ETV’s premium is even higher than EXD’s at this time. A point we’ll explore in the next section.
Another benefit of EXD compared to other closed-end fund choices at this time is the lack of leverage. Instead, they operate with an option writing strategy against indexes.
Performance – Still Offering Some Shelter
The fund’s options strategy would have also reasonably been assumed to provide at least some slight benefit beyond the benefit of an expanding premium. That’s what we noted earlier in the year in that previous update. This continues to be the case as the fund benchmarks against the S&P 500 and Nasdaq 100. Below is a YTD comparison of the performance against the SPDR S&P 500 (SPY) and Invesco QQQ Trust (QQQ).
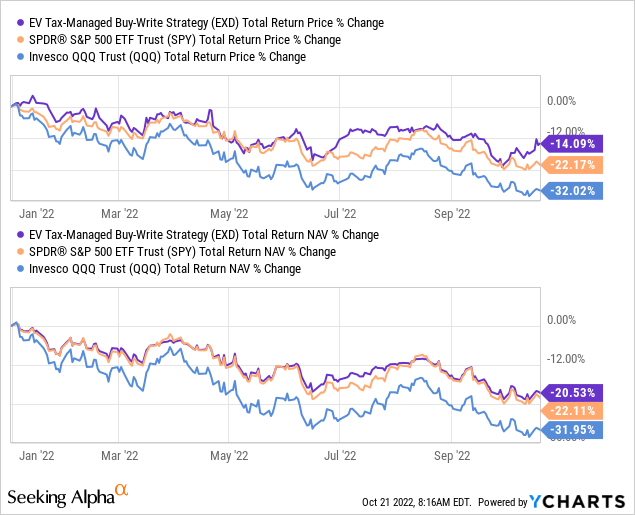
With a tilt towards a heavier tech exposure, a comparable fund without an options writing strategy could be expected to perform somewhere in the middle. However, EXD has held up on a total NAV return basis, better than both benchmarks. That being said, it has been running quite close with SPY. A heavier positioning into the mega-cap tech names could also be seen helping this fund.
For the fund’s premium, we can see above that the 1-year z-score puts it well above the usual level. In the last week or so alone, this has ramped up significantly. If we look at the longer term, the fund is more elevated than we’ve seen in the last several years. At least, going back to when the fund converted to a wildly different fund. Stanford Chemist published an article about when the conversion took place that explains it more in-depth.
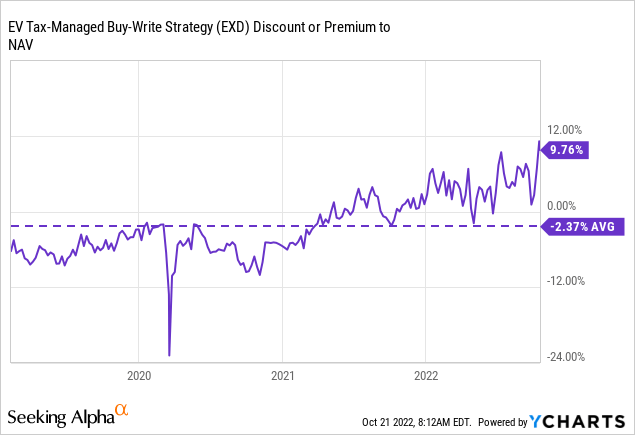
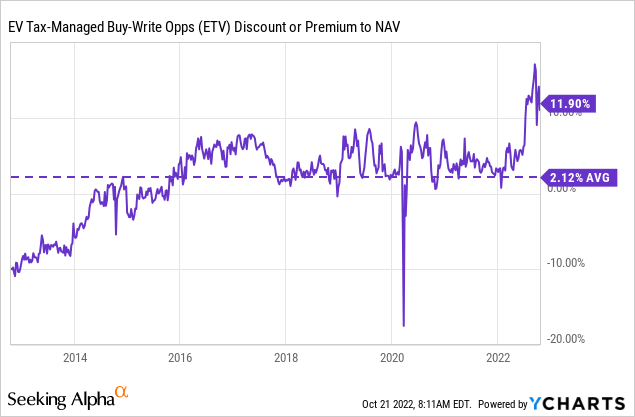
That might not be a fair comparison, though, simply because it had taken some time for investors to realize the fund had changed. Additionally, with COVID in 2020, CEF discounts widened out significantly too. Instead, a better look could be provided by looking at ETV. The sister fund has the same strategy. Albeit holdings are slightly different. We can see that the fund has sustained a higher premium for quite a few years.
For ETV, we can see the premium is even higher at this time. However, even ETV would be elevated at this point. It could suggest, though, that EXD is still fine to hold for now, as ETV isn’t going to be an attractive alternative. It also could suggest that some small premium could be appropriate for EXD. Ideally, it would probably be below the current level to be an attractive buy candidate. Of course, the usual caveat of “past performance never guarantees future results” is present here too.
Distribution – When Gains Are Hard To Come By
When the strategy change took place, EXD switched to a monthly distribution. Since that time, it hasn’t been cut. To note, ETV hasn’t cut since ~2010.
EXD Distribution History (CEFConnect)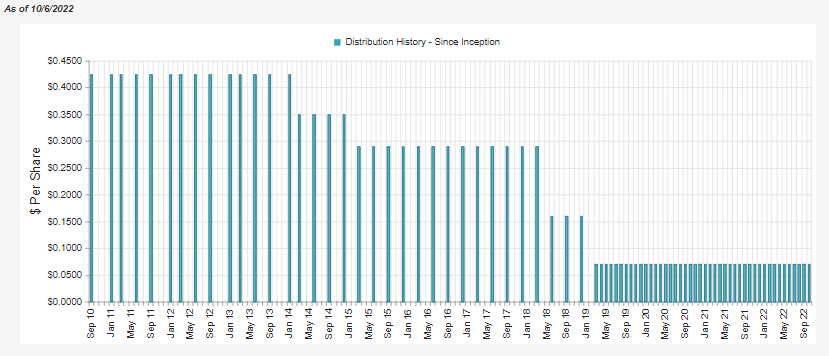
The distribution yield currently works out to 8.58%, with the NAV rate pushing 9.42%. As an equity fund, they’ll rely heavily on capital gains to fund their payouts. We know those are becoming harder to come by in this type of market.
Once again, we go back to the options writing strategy, though. With the contracts expiring worthless, they are pocketing that premium. That results in capital gains being realized for the fund. For the first six months, this equated to nearly $8 million in option premium “income.”
EXD Semi-Annual Report (Eaton Vance)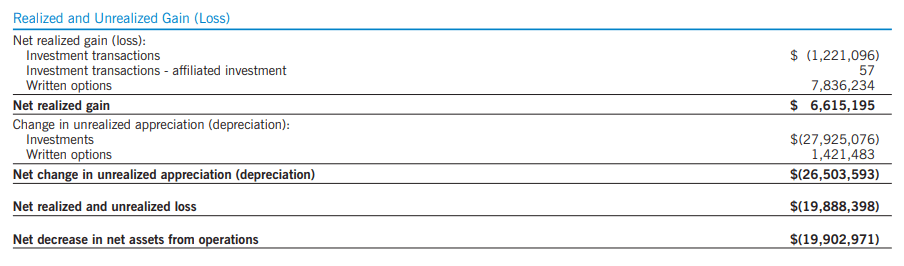
It wasn’t enough to offset the total unrealized losses in the portfolio, which is why the fund still declined in value. However, the premium collected was enough to cover the distributions paid out. That’s despite the negative net investment income the fund regularly generates.
EXD Semi-Annual Report (Eaton Vance)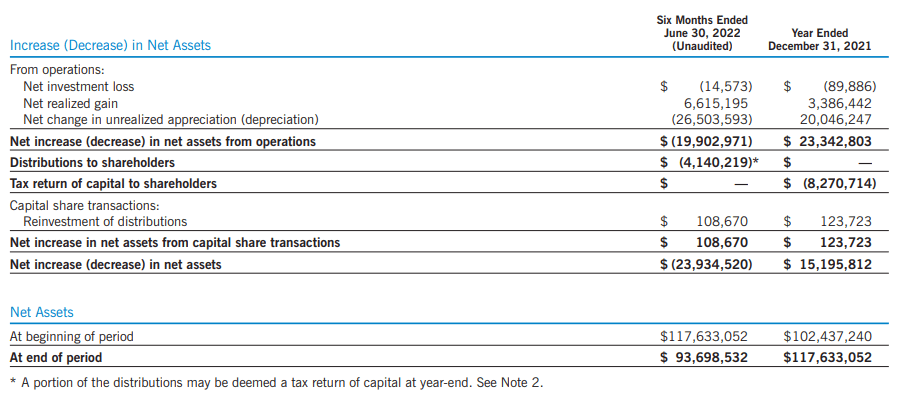
One reason why this could be seen as a negative is come tax time. When writing options that expire worthlessly, those gains are short-term capital gains. This can be remedied in two manners, though. This is a “tax-managed” fund, after all.
For one, the fund could realize more losses in its underlying portfolio, offsetting the gains and classifying the distribution as return of capital.
The second way is from carryforward losses from prior years. The fund generated significant losses under its prior strategy, and that can be helpful for shareholders holding the fund now. Fortunately, Douglas Albo recently covered that subject exactly for EXD in his fantastic write-up.
With that being the case, I suspect that the majority, if not all, of EXD’s distribution will continue to be classified as tax-deferred return of capital.
EXD’s Portfolio
Since the fund’s transition, the turnover of the fund has been incredibly low. This is something we’ve seen in ETV too. Another symptom of trying to stay tax-managed is limiting those realized gain potentials. As the market was strong for most of the preceding decade, gains were plentiful, and there was no real reason to sell positions.
Last year the turnover for the entire year was 3% for EXD. In the last semi-annual report (six months), the turnover rate exploded to 6%. Exploded is hyperbole. On a percentage basis for the difference, that is quite a large leap, regardless. With the market in turmoil, it would make them more flexible to shift the portfolio around without worrying about running into lots of gains.
All that being said, we still haven’t seen any meaningful changes in the top ten allocations of the fund.
EXD Top Ten Holdings (Eaton Vance)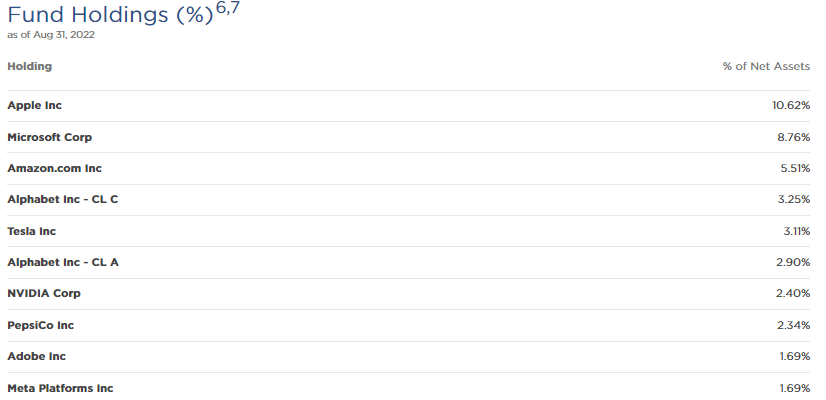
In fact, the only changes I can see are that Alphabet Class A (GOOGL) has swapped spots with NVIDIA (NVDA) and Adobe (ADBE) has swapped spots with Meta Platforms (META) since we saw the holdings earlier this year. Here was the performance of these positions in that specific period. ADBE and GOOGL holding up better in this period would contribute to this result.
Ycharts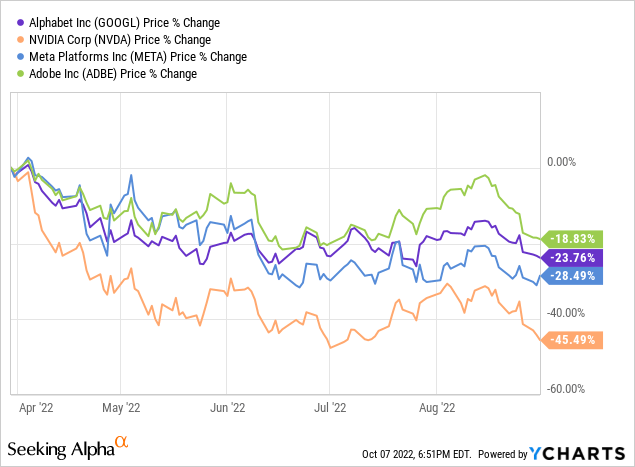
For META, the fund had increased the number of shares they held to 10,843 at the end of June from earlier in the year at the end of March. At the end of March, they held 10,375 shares. ADBE’s share count was reduced from 4564 to 4229. They don’t provide a share count for the end of August besides showing the percentage weightings I’ve included above. However, it gives us a glimpse into how the managers shifted some positions.
NVDA’s and GOOGL’s share counts stayed the same in that time period.
Since the end of August, NVDA has been slammed even further by a warning from Advanced Micro Devices (AMD) that they will miss revenue by a huge margin.
The heavy tilt towards technology comes thanks to the Nasdaq 100 exposure the fund tries to mimic. That puts the weighting of tech in the portfolio at a commanding allocation. Perhaps not too surprising after seeing the top ten list of the fund.
EXD Sector Allocation (Eaton Vance)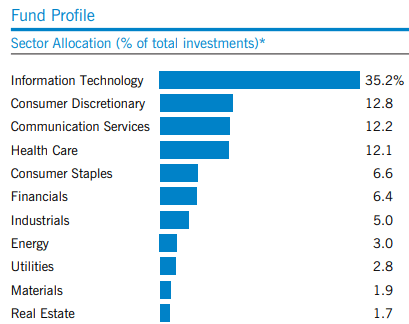
Conclusion
It’s a tough market out there in 2022, no doubt about it. A longer-term investor looking for places to put money or at least building up a watchlist could be appropriate. I think that while EXD isn’t overly attractive in terms of its discount/premium, it also isn’t overly extended to cause me to sell either. Combing that with the latest declines makes it a fairly interesting choice at this time. An equity fund that seems to be more than able to generate the gains needed despite the downturn is a place I’m quite content.
Be the first to comment