

MarkusBeck/iStock Editorial via Getty Images
BlackRock U.S. Equity Factor Rotation ETF (NYSEARCA:DYNF) is an actively managed fund designed to generate excess returns by opportunistically utilizing factors prevailing in the U.S. stock market, be it value, quality, momentum, etc.
Anecdotal evidence suggests that, unlike passively managed investment vehicles that track indices, being too dogmatic and inflexible, dynamic portfolios with positions selected to better reflect the Zeitgeist can produce market-beating returns. That might look doable at first glance: just overweight value players when the economic recovery is gathering momentum or trim exposure to growth names that have acute sensitivity to the accessibility of capital when interest rate increases are in the cards. Factor ETFs, which stick to an index, do not have that luxury, so they suffer badly when a factor guiding their investment decisions is out of favor. The comparison of the returns of the Invesco S&P 500 Pure Growth (RPG) and Pure Value (RPV) ETFs have delivered this year illustrates that vividly.
Seeking Alpha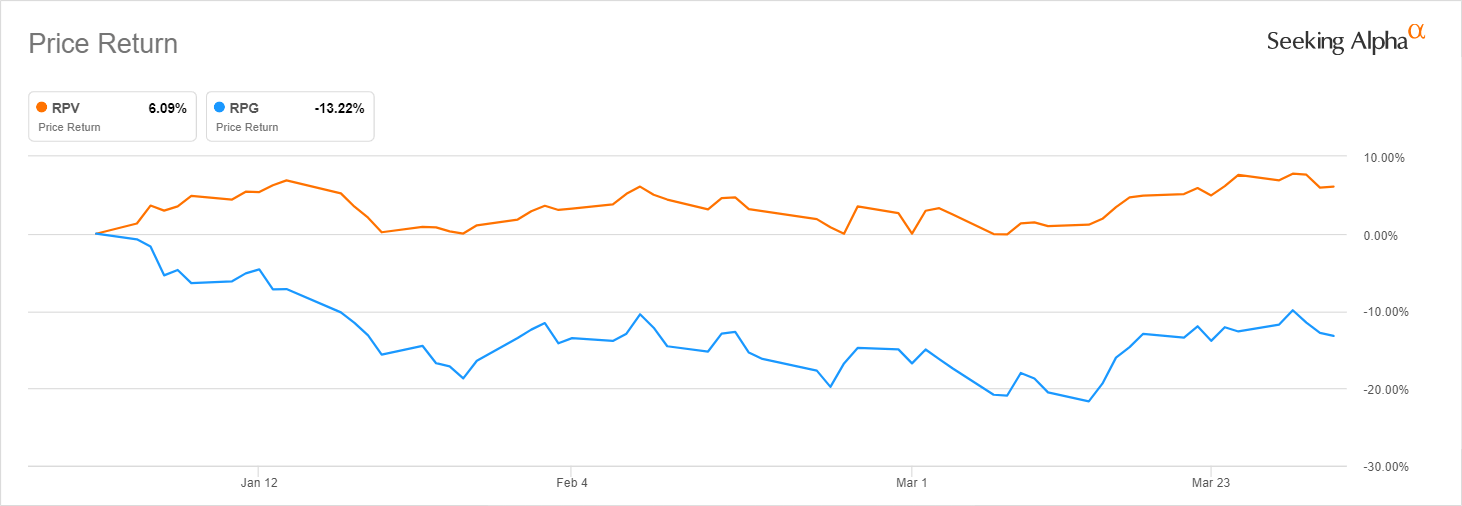
The reality is, as usual, a bit more complicated. It is not that simple to correctly identify and exploit the prevailing factor trends.
Over the periods touched upon in the article, DYNF failed to deliver excess returns or even worse – was in the red, while the market chugged along. Unfortunately, the ETF failed to fully benefit from the growth rally of 2020 and did not manage to utilize the tailwinds from the capital rotation of 2021-2022. Perhaps, only for now.
That said, despite a promising investment strategy, considering market-lagging returns this ETF has delivered during its relatively short history (incepted in March 2019), DYNF is a Hold at best.
Investment strategy. Holdings. Quant factors
As of the factsheet, the ETF is benchmarked against the MSCI USA index. As a quick reminder, this index and the S&P 500 are essentially similar, with the former having 629 constituents as of end-February. We will be comparing the fund’s returns with the S&P 500 ETF (IVV) below in the article.
DYNF’s purpose is to best the benchmark by investing in U.S. stocks selected using “a proprietary Factor Rotation model” designed by BlackRock Fund Advisors and its affiliates. The summary prospectus says “the current economic cycle” together with “the valuations and recent trends for each factor” are among the considerations. The goal is to allocate no more than 40% to a single factor.
The fund uses a fairly traditional set encompassing momentum (betting on outperformers that might continue leading), quality (firms with resilient margins and financial position), value (underpriced, overlooked equities), size, and minimum volatility. It favors large- and mid-cap players.
Since the strategy contains a lot of proprietary, classified ingredients, we certainly can only hypothesize about what exactly has the largest impact on the fund’s investment decisions. We will try to make such assumptions using the Quant data below focusing on value, growth, and quality factors.
In the current iteration, as of March 31, the DYNF portfolio is nicely diversified, with a substantial breadth of exposure. 446 stocks could be found in the portfolio, with most of them being from the information technology sector, close to 31%. Mega-caps dominate the portfolio with a 64% weight, while exposure to mid-caps is sub-1%. The $1 trillion league members like Microsoft (MSFT), Apple (AAPL), and Tesla (TSLA) occupy the top three positions in the portfolio, with a combined weight of around ~11.6%.
Comparing the end-2021 and end-March 2022 data, we see that DYNF has significantly rebalanced its portfolio. What has actually changed? And, most importantly, what might be the rationale behind these investment decisions?
For that purpose, I have paired the Quant dataset from 31 December 2021 with the DYNF holdings as of the same date (downloaded from the iShares website just recently).
Please take notice that this might help to interpret the adjustments made, but that is just a hypothesis, and the actual reasons for the fund managers purchasing/selling a particular stock can be completely different.
I have the following conclusions:
- DYNF’s breadth of exposure has narrowed. More specifically, the number of equity holdings fell from 622 to 446. Amongst names that were sold are Canadian Pacific Railway (CP), Advanced Micro Devices (AMD), Deere & Company (DE), etc. They had ~3.7% weight. Meanwhile, only eight were added, like Paramount Global (PARA) and Coterra Energy (CTRA), etc. Their share of the net assets is barely 0.5%.
- So, the answer to the question of whether the fund recalibrates its equity basket deeply and frequently is “yes, at times.”
- The end-December 2021 version of the portfolio was awfully overvalued as I can judge from the Quant data. The share of stocks with Valuation grades of D+ or worse was close to 80%. So, I would say that the fund’s exposure to the value factor which allowed such plays like the above-mentioned RPV to outperform the market YTD was rather minimal. It has increased of late, with the share of overpriced stocks plummeting to 57%, but partly owning to valuations across the board falling amid the shrinkage of growth premia.
- As I highlighted in a few articles from December 2021 and January 2022, lofty valuation exposed portfolios to a risk of a steep price decline, which finally has happened to most growth plays and has taken its toll on DYNF.
- Growth players (B- grade or better) had ~33% of the portfolio in December. The figure has fallen to ~22.3%.
- With value capturing a larger slice of the portfolio, the fund has probably intentionally underweighted growth expecting it to continue lagging amid gradual interest rate increases. Or this change in allocations can be just an inevitable consequence of the broad market decline. Again, this is just a hypothesis.
- Meanwhile, little has changed regarding quality. The share of highly profitable stocks inched by almost 3% to close to 96%. Yes, the quality of the portfolio remains nothing short of exemplary.
Performance analysis: the market did better
A dynamic multi-factor equity strategy looks good on paper. Unfortunately, in the real world, the returns it is capable of delivering are inconsistent, well below the market, and also weaker compared to a few peers.
I have selected the following passively managed peers to enhance the context:
- Invesco Russell 1000 Dynamic Multifactor ETF (OMFL), with a 29 bps expense ratio;
- Deutsche X-trackers Russell 1000 Comprehensive Factor ETF (DEUS), with a 17 bps ER.
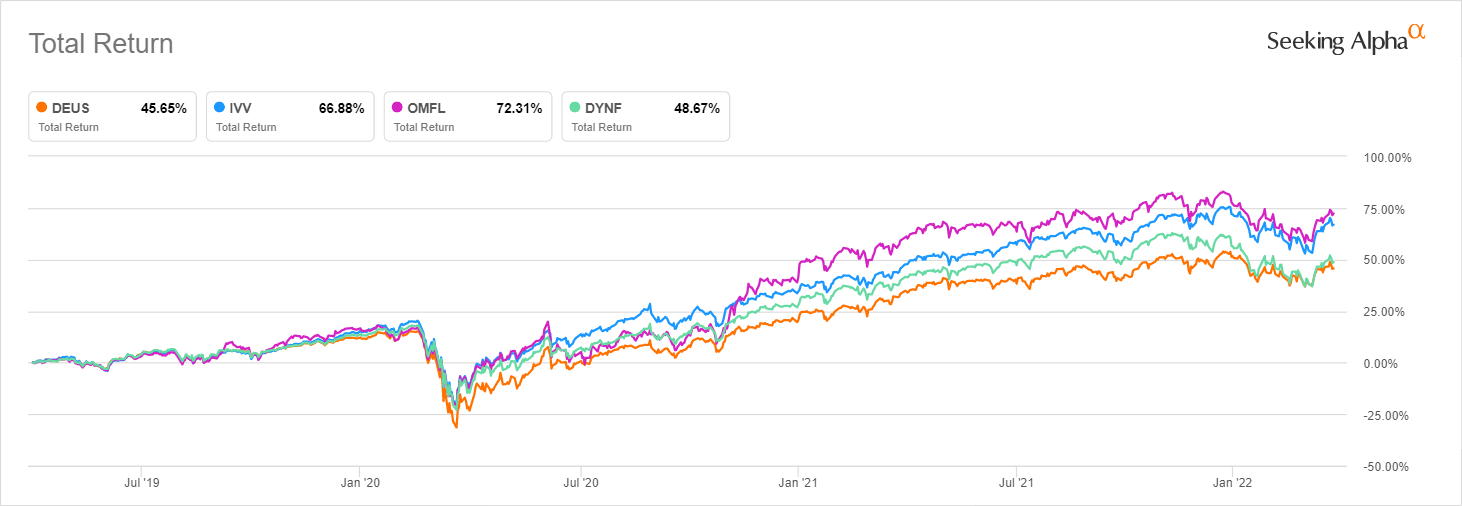
The table below compares the price performance of the ETF with OMFL, DEUS, and the iShares Core S&P 500 ETF (IVV), the bellwether fund.
Created by the author using the data from Seeking Alpha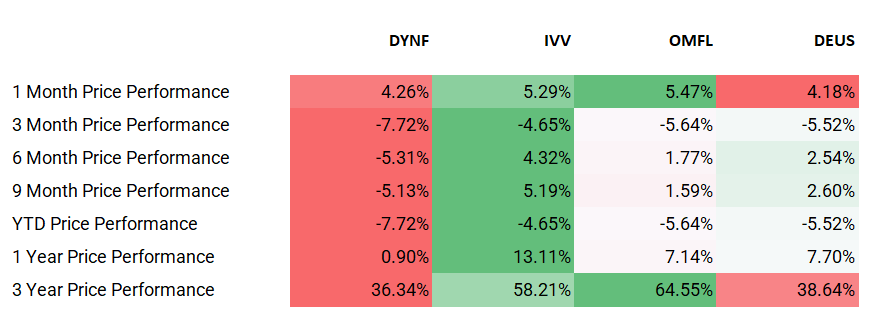
Over the periods featured, the fund not only failed to beat the market but also did worse than its peers.
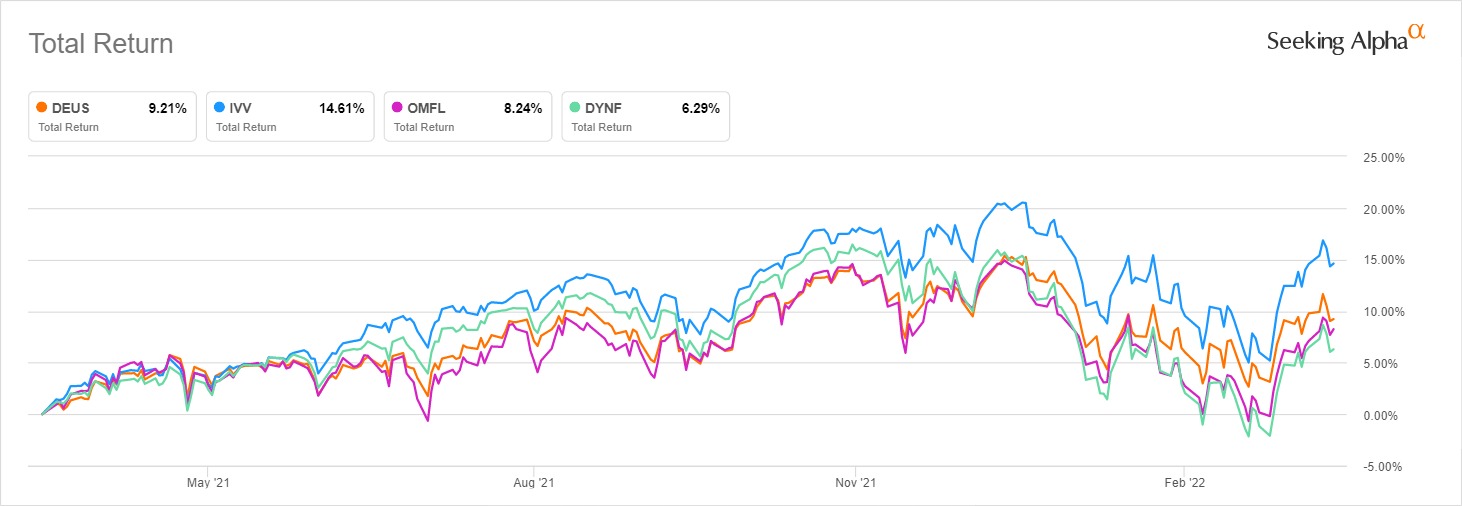
We should also assess total returns over the YTD, one-year, and three-year periods (DYNF made a sizeable distribution of short- and long-term capital gains in 2021, as the table on its website illustrates; this has a substantial impact on total return).
Unfortunately, the picture is barely better, regardless of the period assessed.
Seeking Alpha Seeking Alpha Seeking Alpha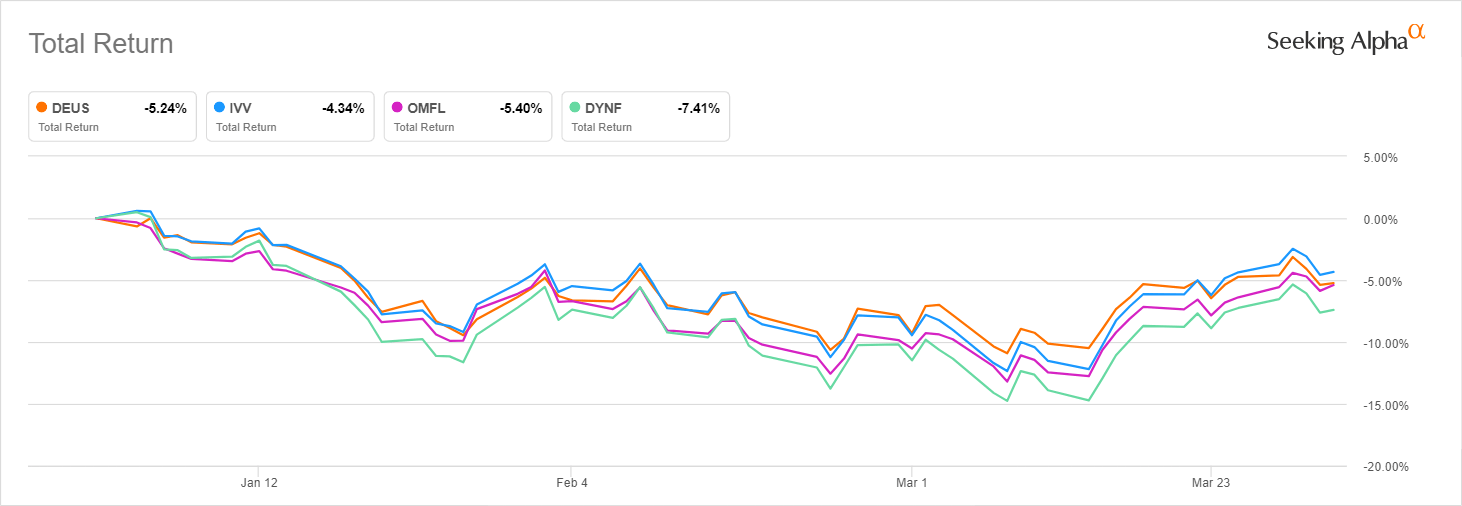
Final thoughts
DYNF has a comparatively promising strategy designed to benefit from the rotation of factors. In reality, its approach has not yielded consistent alpha yet.
During its first two full trading years, it underperformed the bellwether fund, despite plentiful opportunities to harness the prevailing factors, like growth (a 2020 thing) or value (the main theme of 2021 and of the early months of 2022). For example, in 2020, it delivered ~13.5% vs. IVV’s ~18.4%.
Meanwhile, I like its massive allocation to high-quality stocks (close to 96%), which makes it anything but a Sell. Nevertheless, I am hesitant to say its strategy will beat the market consistently going forward. Hence, it is only a Hold.
I should also highlight that though active strategies invite higher fees, the ETF is priced comfortably, with the expense ratio of 30 bps being only 1 bps higher than the asset class median. This is a silver lining.
In conclusion, my point here is that investors should ask themselves whether active funds with sophisticated methodologies are any better than bellwether ETFs. I am of the opinion that in numerous cases, sticking with heavyweight broad-market plays is the best ultra-low-cost strategy for the long term.
Be the first to comment