

USD PRICE FORECAST: US DOLLAR INDEX EXTENDS RETRACEMENT LOWER AS FED INTEREST RATE CUT ODDS BULGE ON CORONAVIRUS CONCERNS
- DXY Index tests technical support around the 99.00 handle following the 1% slide in USD price action off a three-year high amid mounting coronavirus concerns
- The US Dollar dropped further from its recent top throughout Tuesday’s trading session after weak consumer confidence data fueled another acceleration in Fed rate cut bets
- Currency volatility continues to rise according to US Dollar overnight implied volatility readings across select major currency pairs
The US Dollar Index (DXY) edged steadily lower over the last three trading sessions. The latest stretch of downside in USD price action is primarily attributable to a sharp rise in future interest rate cut probabilities from the Federal Reserve being baked in after disappointing economic data.
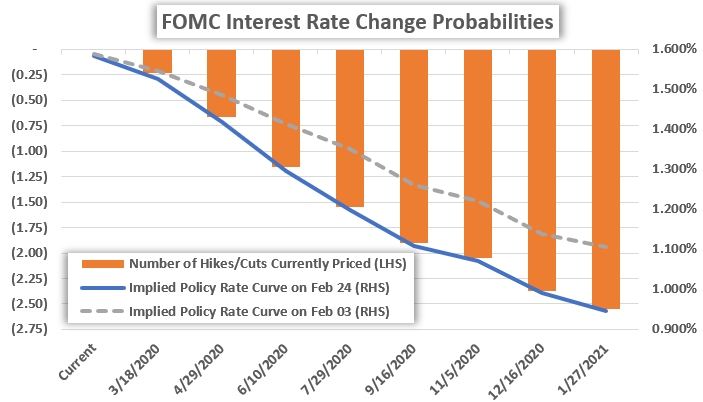
CHART OF FED INTEREST RATE CUT PROBABILITIES (FUTURES-IMPLIED)
Rekindled recession odds, largely due to the novel coronavirus outbreak and its adverse impact on global GDP growth, serves as the key themes contributing to the spike in Fed rate cut expectations over the last few days. An inverted yield curve is likely weighing on market sentiment and expectations as well.
That, interest rate traders have priced in another 18-basis points of cuts from the Federal Reserve since last week. This comes in spite of the latest Fed minutes, which detailed a neutral stance for monetary policy outlook this year.
DXY – US DOLLAR INDEX PRICE CHART: DAILY TIME FRAME (SEPTEMBER 2019 TO FEBRUARY 2020)
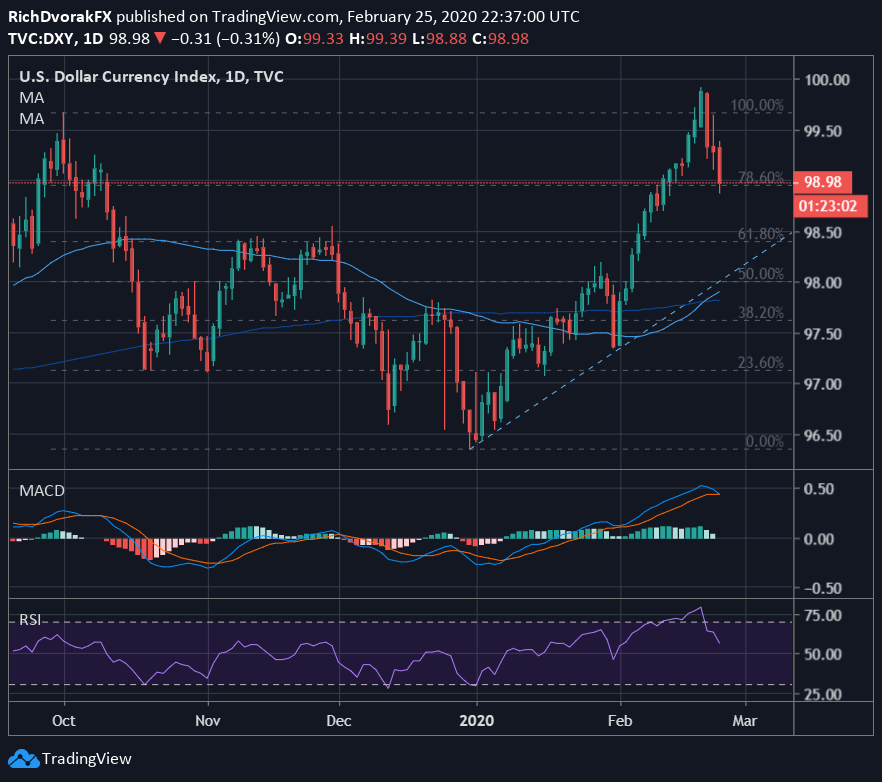
Chart created by @RichDvorakFX with TradingView
USD price action could remain under pressure so long as Fed interest rate cut bets continue to rise. Although, the US Dollar and broader DXY Index might find technical support from the 78.6% Fibonacci retracement level of its most recent bullish leg where spot prices currently trade.
Below this area brings to focus the 98.50 price level, which is underpinned by a confluence of support provided by the 61.8% Fib and positively-sloped trendline connecting the December 31 and January 31 lows.
USD PRICE ANALYSIS – US DOLLAR IMPLIED VOLATILITY & TRADING RANGES (OVERNIGHT)
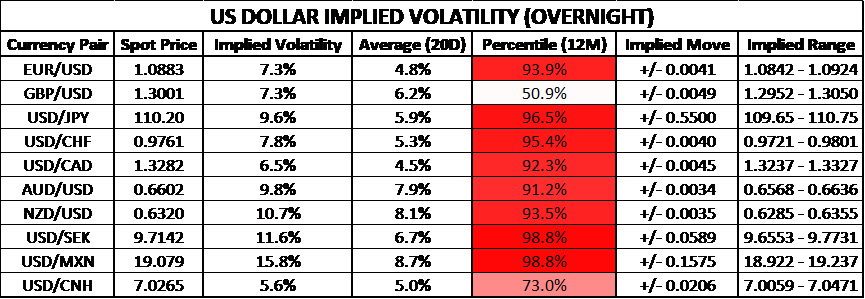
FX volatility has been running red-hot recently and elevated market activity is expected to continue. This is judging by overnight implied volatility readings across the US Dollar and its primary counterparts.
US Dollar overnight implied volatility readings rank in the top 90th percentile of measurements taken over the last year for nearly all selected pairs. This highlights the potential for outsized moves in USD price action.
Options-implied trading ranges are calculated using 1-standard deviation (i.e. 68% statistical probability price action is contained within the implied trading range over the specified time frame).
— Written by Rich Dvorak, Junior Analyst for DailyFX.com
Connect with @RichDvorakFX on Twitter for real-time market insight
Be the first to comment