

MicroStockHub/iStock via Getty Images
This dividend exchange-traded fund (“ETF”) article series aims at evaluating products regarding the relative past performance of their strategies and quality of their current portfolios. As holdings and their weights change over time, reviews may be updated when necessary.
DWX strategy and portfolio
The SPDR S&P International Dividend ETF (NYSEARCA:DWX) has been tracking the S&P International Dividend Opportunities Index since 02/12/2008. It has 102 holdings, a 12-month distribution yield of 4.53%, and a total expense ratio of 0.45%.
As described by S&P Dow Jones Indices, eligible companies must be in the S&P Global ex-U.S. BMI, excluding China A-Shares, and have:
- at least US$ 500 million in float-adjusted market capitalization
- at least US$ 5 million in 3-month median daily volume
- at least 10% of known shares actually available to foreign investors
- positive earnings-per-share (trailing 12-months) as of rebalancing
- stable or increasing three-year dividend growth (a small decline is allowed for current constituents)
- a Funds from Operations Per Share to Dividend-Per-Share ratio greater than 100%
- a dividend yield above the median yield of stocks that passed all other criteria
Then, remaining stocks are ranked based on risk-adjusted yield, defined as dividend yield divided by volatility of monthly dividend yields over the prior 36 months. The top 80 stocks are automatically added in the underlying index, then specific rules are applied to limit turnover of current constituents and reach a total of 100 stocks. Constituents are weighted based on trailing 12-month dividend yield, with a maximum of 3% by constituent, 25% by country, 25% by GICS sector and 10% for all trusts (including REITs). The underlying index is reconstituted annually, rebalanced semi-annually, and reviewed monthly for possible stock exclusion based on dividend criteria and corporate actions.
The next chart lists the top 10 countries, with an aggregate weight about 78%. Japan is the heaviest one with 15.7%, followed by Canada at 13.7%. Other countries are below 9%. China, Hong Kong and Taiwan weigh about 15.3% together: it is a significant exposure to geopolitical and regulatory risks.
DWX countries (Chart: author: data: SSGA)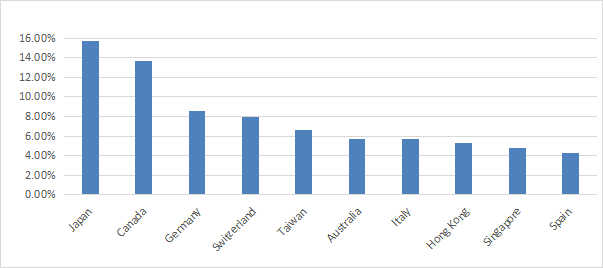
The top two sectors are utilities (21.1%) and real estate (19.6%), then come financials (15.3%) and communication (11%). Other sectors don’t exceed 8% individually and 33% in aggregate.
DWX sectors (Chart: author: data: SSGA)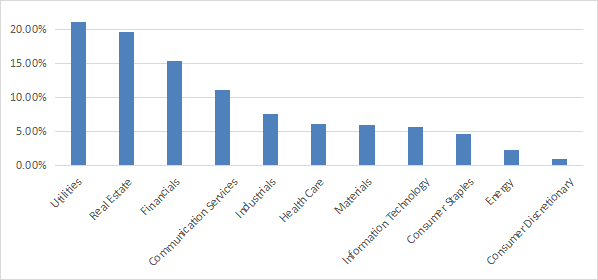
The portfolio is mostly in large-cap companies (63.8%).
Size segmentation (Chart: author with Fidelity data)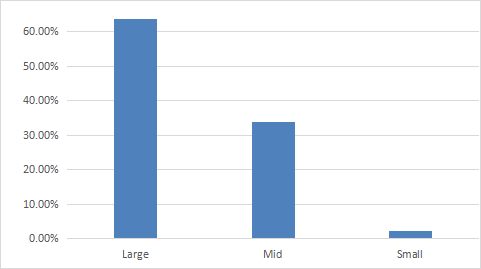
The top 10 holdings, listed below, represent 15.8% of asset value. No holding weighs more than 2% as of writing, so risks related to individual stocks are low.
|
Name |
Ticker |
Weight% |
Sector |
Currency |
|
Enel SpA |
ENEL-IT |
1.82 |
Utilities |
EUR |
|
Enagas SA |
ENG-ES |
1.68 |
Utilities |
EUR |
|
E.ON SE |
EOAN-DE |
1.64 |
Utilities |
EUR |
|
Telenor ASA |
TEL-NO |
1.60 |
Communication Services |
NOK |
|
Bouygues SA |
EN-FR |
1.60 |
Industrials |
EUR |
|
China Construction Bank Corp |
939-HK |
1.54 |
Financials |
HKD |
|
Castellum AB |
CAST-SE |
1.52 |
Real Estate |
SEK |
|
Allianz SE |
ALV-DE |
1.49 |
Financials |
EUR |
|
Red Electrica Corp. SA |
RED-ES |
1.46 |
Utilities |
EUR |
|
Holcim Ltd |
HOLN-CH |
1.46 |
Materials |
CHF |
Past performance compared to competitors
The next table compares DWX performance since March 2008 with four international dividend ETFs:
- The WisdomTree Global ex-U.S. Quality Dividend Growth Fund (DNL). reviewed here.
- The iShares International Select Dividend ETF (IDV), reviewed here.
- The First Trust Dow Jones Global Select Dividend ETF (FGD), reviewed here.
- The Invesco International Dividend Achievers ETF (PID), reviewed here.
|
since 3/1/2008 |
Total Return |
Annual Return |
Drawdown |
Sharpe |
Volatility |
|
DWX |
0.46% |
0.03% |
-67.03% |
0.08 |
21.35% |
|
DNL |
94.79% |
4.72% |
-37.60% |
0.32 |
17.56% |
|
IDV |
44.46% |
2.58% |
-65.17% |
0.2 |
21.59% |
|
FGD |
64.48% |
3.51% |
-65.29% |
0.24 |
21.21% |
|
PID |
59.71% |
3.30% |
-63.18% |
0.24 |
19.68% |
Data calculated with Portfolio123, reinvesting dividends.
International funds have underperformed the U.S. market: SPY has returned 320% in the same time (10.4% annualized). DWX has lagged these four competitors in total return by a wide margin. Its total return and Sharpe ratio (risk-adjusted performance) are close to zero. DNL, with the lowest yield of this group, is the best performer in total return by far. It also shows a lower risk measured in drawdown and standard deviation of monthly returns (volatility).
In fact, DWX has suffered a capital decay of 53% since inception, as shown on the next chart. Distributions have just offset the loss in share price. This is before accounting for tax on distributions and inflation.
DWX share price (TradingView on Seeking Alpha)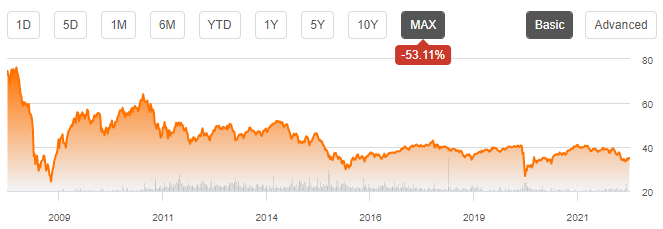
Moreover, the annual sum of distributions went down from $1.89 in 2009 to $1.51 in 2021. This is a 20% cut in income stream (source: SSGA).
Takeaway
DWX holds 100 international dividend stocks, mostly from developed countries outside the U.S. Europe represents about half of asset value, and the three major sectors are utilities, real estate, and financials. Exposure to geopolitical and regulatory risks related to China is about 15%. The yield is quite attractive for income-seeking investors, but it has been erased by capital decay. The fund has lost 53% in share price and 20% in annual distribution since inception.
I prefer the WisdomTree Global ex-U.S. Quality Dividend Growth (DNL). It is more balanced in sectors and countries, has better quality filters, a higher total return in the past and a lower risk measured in maximum drawdown and historical volatility. For transparency, a dividend-oriented part of my equity investments is split between a passive ETF allocation (DWX is not a part of it) and my actively managed Stability portfolio (14 stocks), disclosed and updated in Quantitative Risk & Value.
Be the first to comment