

hapabapa
Just over two months ago, I wrote on Dutch Bros (NYSE:BROS), noting that while Dutch Bros was one of the sector’s best buy-the-dip candidates, given its industry-leading growth and exceptional AUVs relative to box size, it made little sense to chase the stock above $40.30. This is because the stock was up over 80% in less than 30 trading days, hugging a potential resistance level at $43.70. While the stock pulled back 25% from the $41.00 level in June to relieve its overbought condition, it has continued on a tear, helped by the view that the Federal Reserve has shot enough arrows into the inflation monster to bring it to its knees finally.
BROS Weekly Chart – June 7th (TC2000)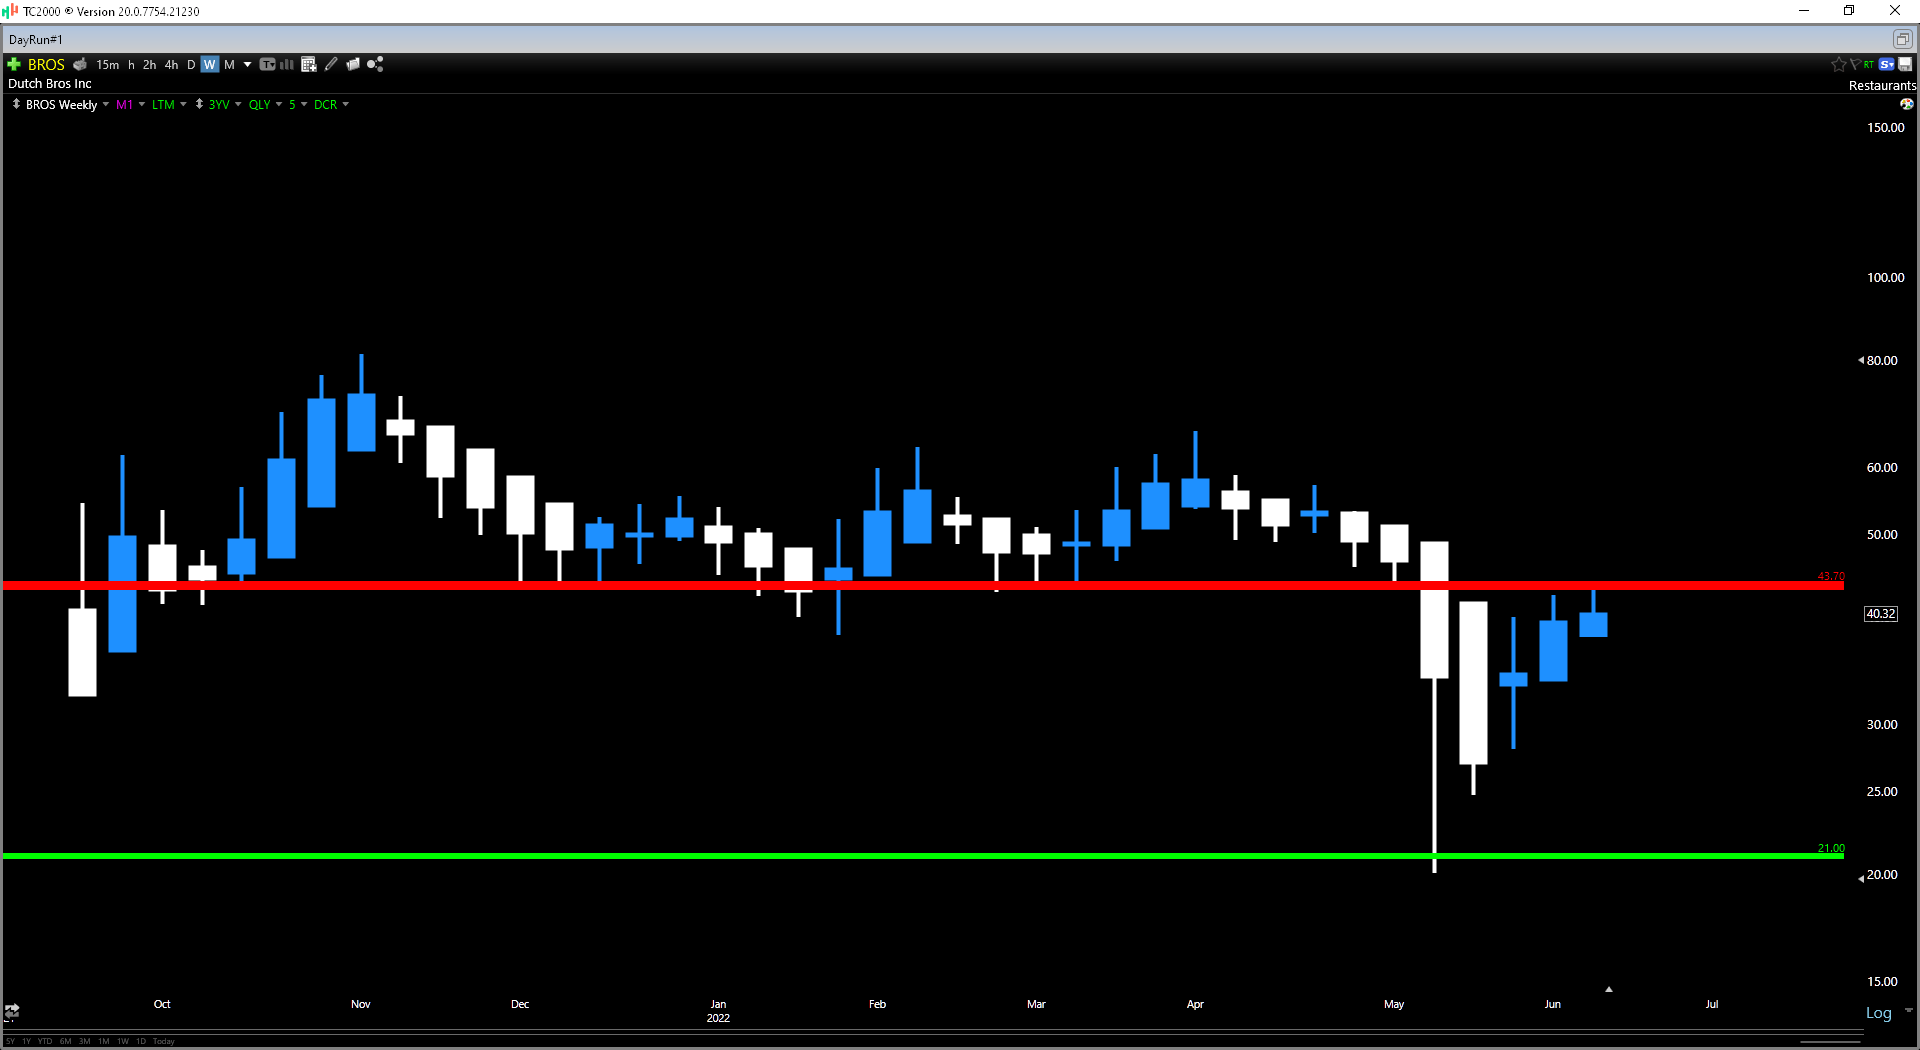
While peak inflation would certainly help restaurant stocks that have seen their margins chipped away by inflationary pressures, the Federal Reserve remains on the offensive, an unfavorable backdrop as higher discount rates are used to calculate future cash flows. So, while Dutch Bros has doubled from its lows, and investors are enthusiastically rushing back into growth names, I still don’t see growth stocks being out of the woods, suggesting the best course of action is buying sharp pullbacks, not chasing rallies. Let’s take a look at Dutch Bros Q2 results to see whether this is an exception where paying up for the stock might make sense:
Rising Active Manager Equity Exposure (NAAIM Index, Author’s Chart)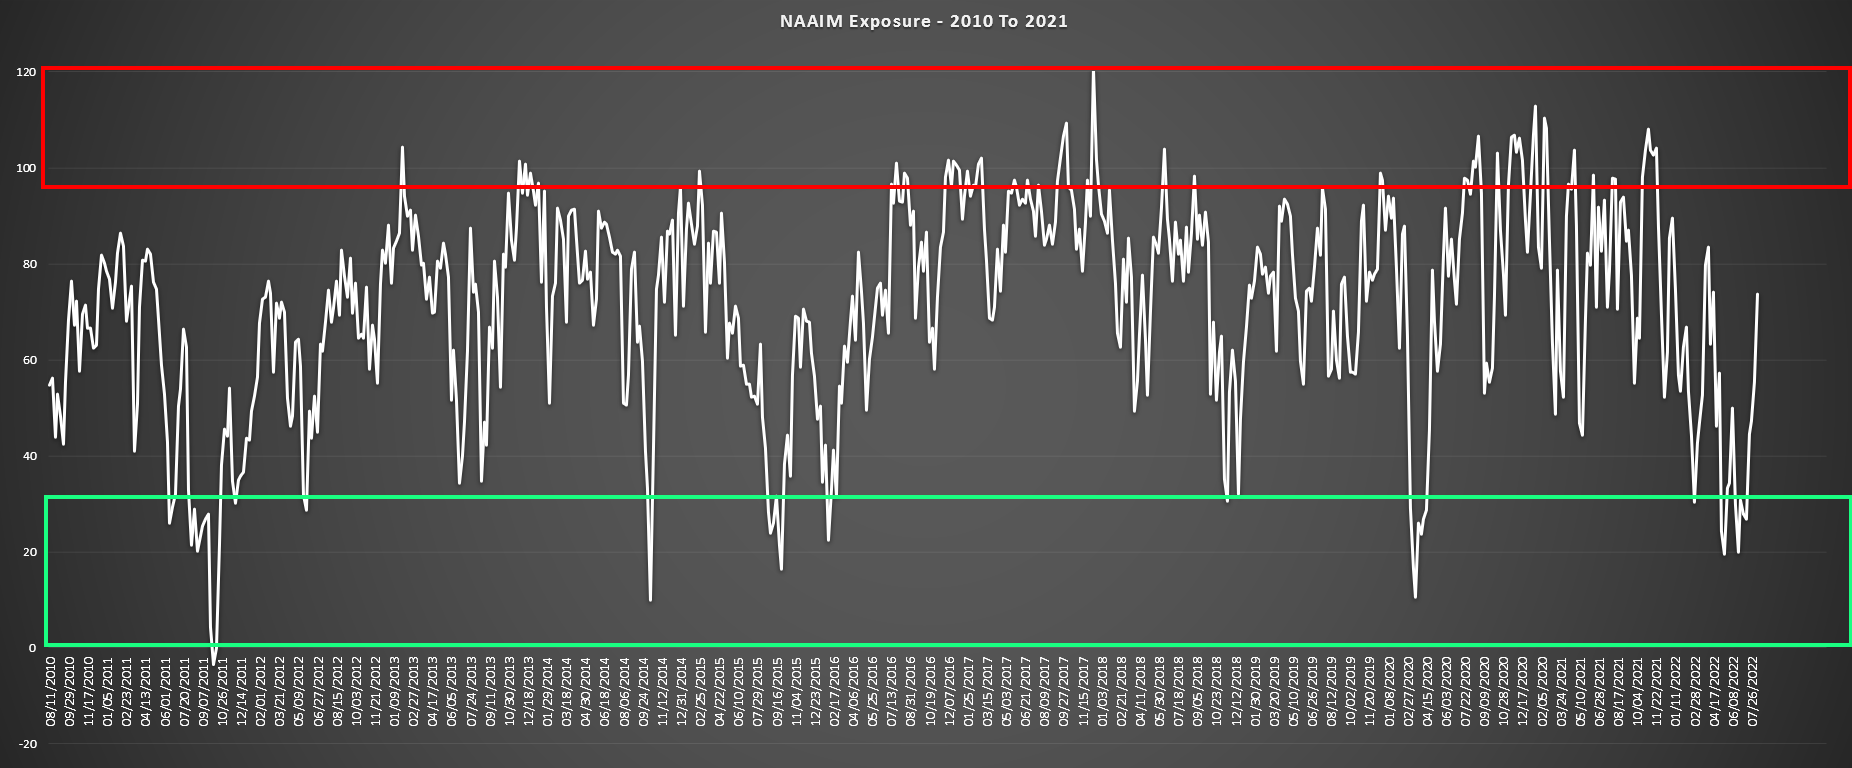
Q2 Sales Performance
Dutch Bros released its Q2 results last week, reporting quarterly revenue of $186.4 million, a 44% increase from the year-ago period. This was driven by a 56% increase in company-owned shop revenue, partially offset by a nearly 2% decline in franchising/other revenue in the period. Digging into the results a little closer, the main driver for the revenue growth was the 28% increase in shops in the period (603 at quarter-end vs. 471), combined with mid-single-digit pricing as of Q2 with a 3% price increase taken in Q2.
Dutch Bros – Quarterly Revenue (Company Filings, Author’s Chart)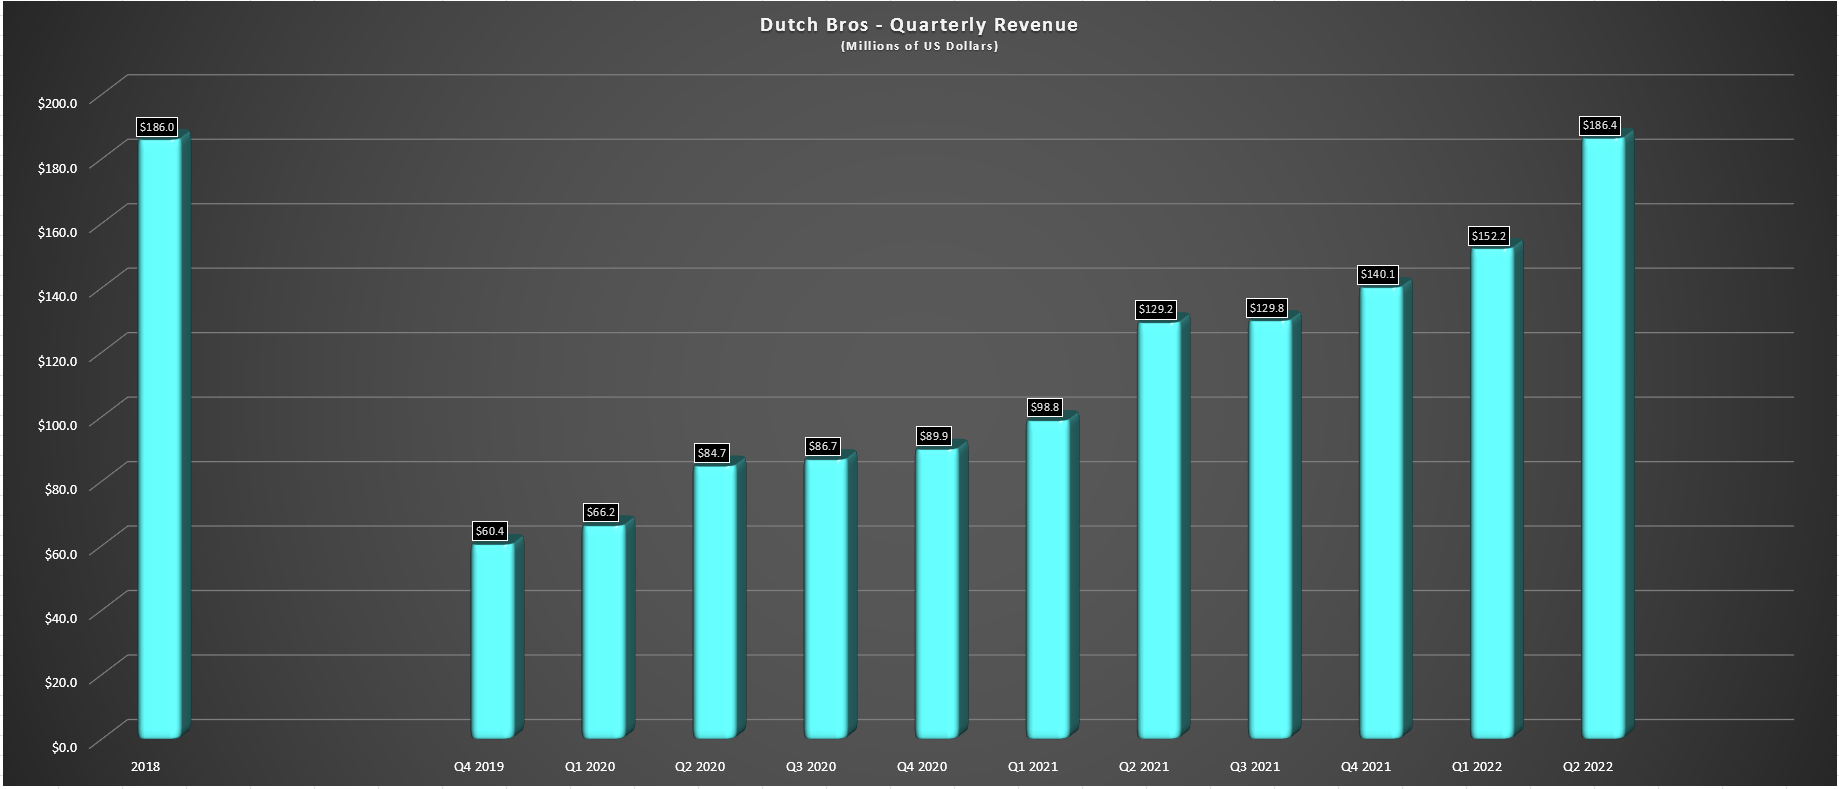
Notably, the company is tracking above its full-year unit growth plans, guiding for 130 new openings and sitting at 65 at the end of Q2, highlighting impressive development performance. Just as importantly, the 2020/2021 class continues to enjoy higher AUVs than the system (~$1.9 million), and the new class of 2021 shops is also performing very well ($2.1 million annualized). This strong performance helped the company surpass the $1.0 billion system-side sales mark on a trailing-twelve-month basis.
National Gas Prices (AAA Gas Prices)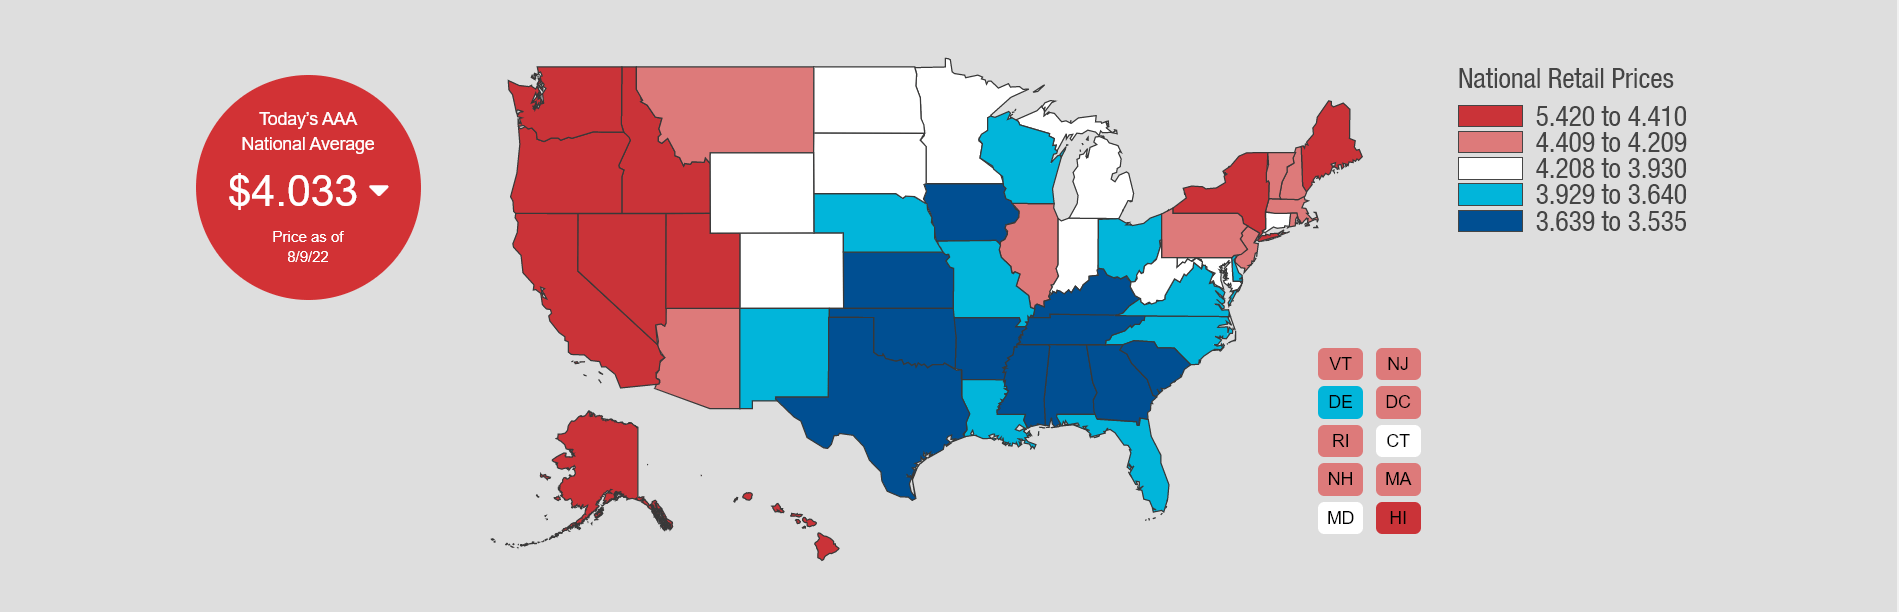
However, while unit growth has been strong and ahead of my expectations, same-shop sales disappointed in Q2, dipping 3.3% year-over-year despite meaningful pricing. On a two-year stacked basis, this translated to 6.1% same-shop growth. The company noted that it began to see a traffic slowdown in March which impacted same-shop sales, but that same-shop sales began to improve in June and July, which could be somewhat attributed to the pullback in gas prices. The company also noted that despite pricing taken on June 1st (3%), it didn’t see a moderation in sales.
While encouraging, this is a relatively small sample size. Besides, Dutch Bros continues to suffer from gas prices being well above the national average, with ~20% of its shops and its second-largest footprint next to Oregon. So, while menu pricing will help boost sales and margins, I think it’s early to conclude that there won’t be any resistance to price increases, especially with another one being considered in Q3. In fact, the company disclosed that it estimates a 40% decline in traffic if household income is below $40,000.
Age/Gender Breakdown – Dutch Bros Customers (Company S-1)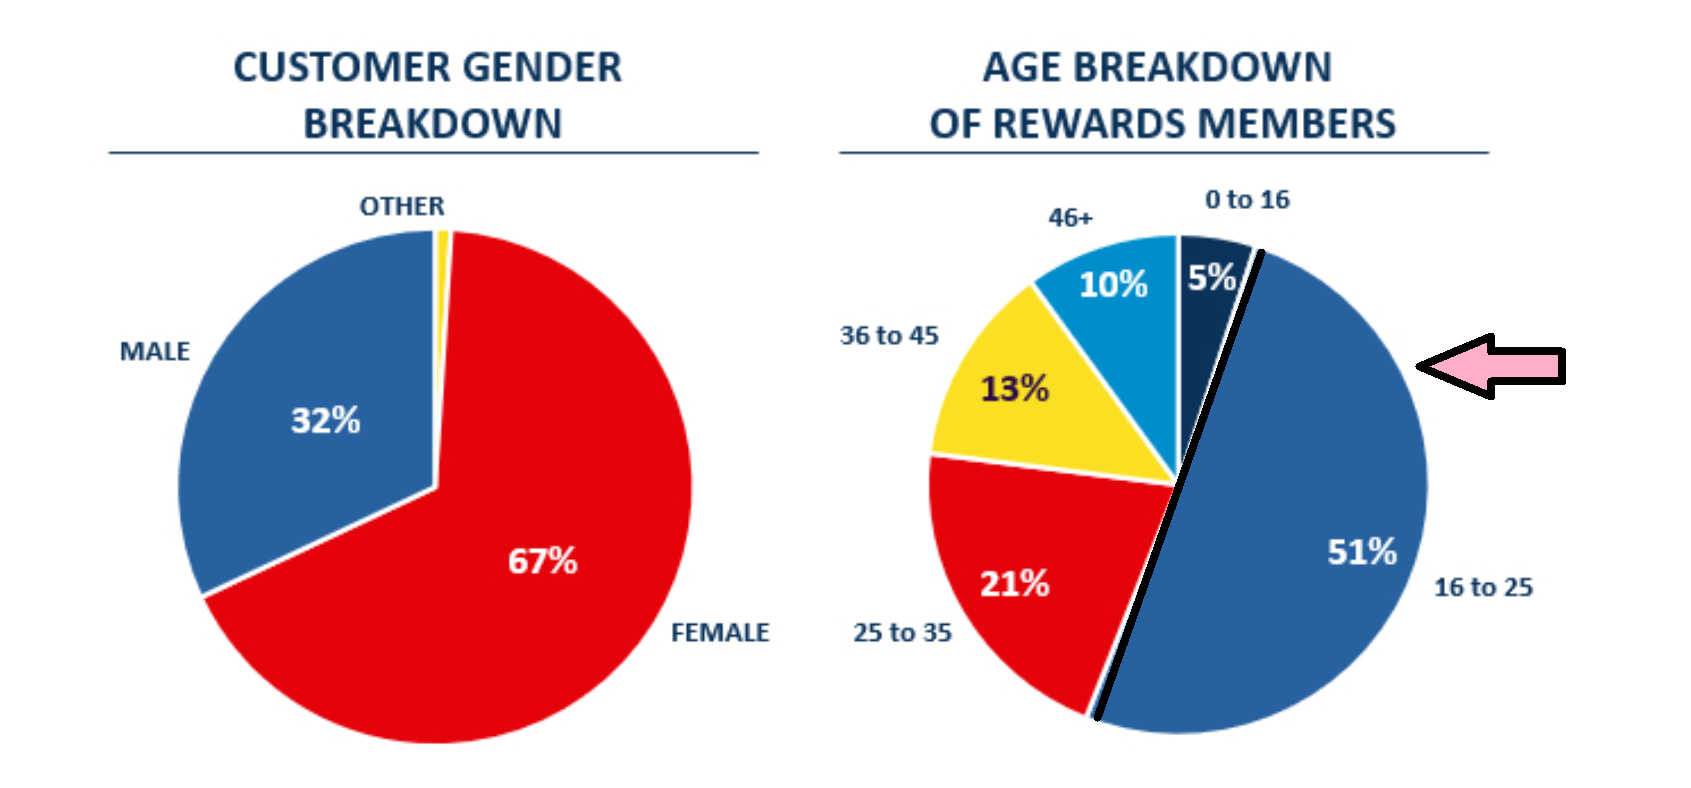
As disclosed in the company’s S-1, its age breakdown looks to skew quite young (even if this is influenced by the younger generation’s likelihood of using apps vs. older). This suggests that Dutch Bros could be more susceptible to a more difficult economic environment, which seems to be confirmed by the massive drop-off in sales performance among its less affluent customers. This could potentially significantly impact the 16-23 group, which has lower incomes and, in many cases, high student debt (19+). Another potential minor headwind is the crash we’ve seen in crypto, which could have a reverse wealth effect, with Gen-Z and Millennials much more likely to own crypto, and certainly not pleased with their investments here vs. the boom times of 2021.
Cryptocurrency Investments (Investopedia Financial Literacy Study)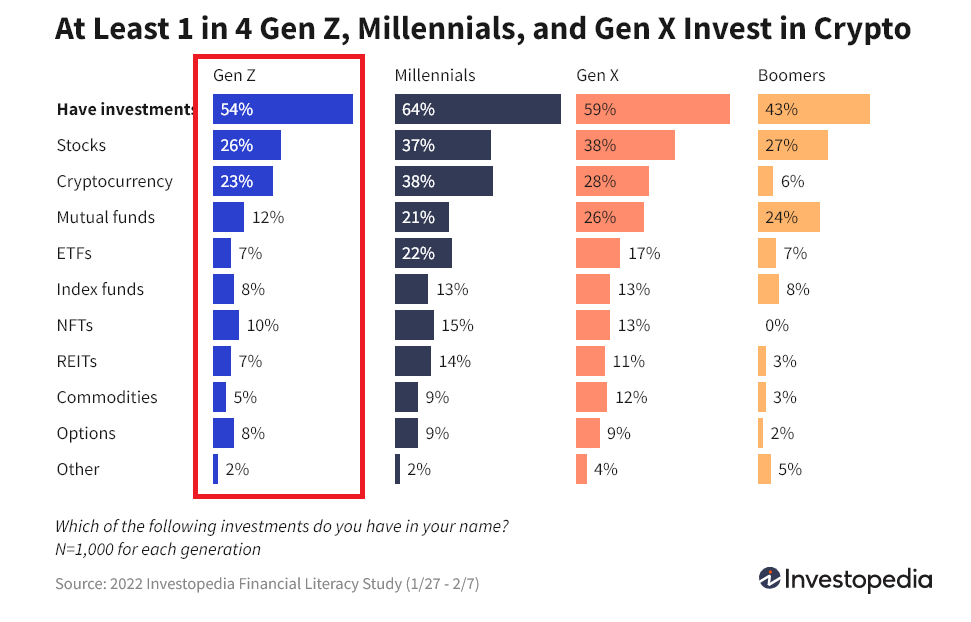
To summarize, while development progress was phenomenal, this was mostly overshadowed by the weaker sales performance. Plus, with the possibility of a further menu price increase on deck, it’s possible we could see some trading down. There is a possibility, given the softness in smoothies, cold brew, frost, and iced tea, that we could see a trade-down for convenience store options like 7-Eleven if inflation levels remain elevated, pinching discretionary budgets. So, while this wasn’t a bad quarter by any means, it’s tough to be overly bullish on H2 with the impact of higher pricing, what are still elevated grocery prices, and Dutch Bros now out of its strongest seasonal period (Q2).
Margins & Industry Headwinds
While the sales performance was satisfactory but below my expectations, margin performance was even less attractive. While Dutch Bros did point out that its company-shop contribution margin increased over 600 basis points on a sequential basis to 24.6% in Q2, it fell by 740 basis points year-over-year (Q2 2021: 32.0%). This was related to inflationary pressures, with food, beverage & packaging costs up 230 basis points year-over-year and labor costs up 120 basis points as well. The silver lining is that retention remains strong, turnover is low, and applicant flow is also robust (~64,000 applicants in Q2 vs. 3,500 hired).
Given these inflationary pressures and Dutch Bros’ less franchised model than its peers, we saw a sharp decline in adjusted EBITDA to $23.9 million vs. $30.7 million in the year-ago period. So, while the company did reiterate annual adjusted EBITDA of $90 million and is tracking well against this figure, this is still well below previous estimates ($115 million to $120 million). Under the new estimates outlook, Dutch Bros has seen a slight positive revision in EBITDA estimates for FY2023 and FY2024, with annual EBITDA expected to come in at $150 million and $203 million, respectively.
Dutch Bros – Annual Revenue/EBITDA & Forward Estimates (Company Filings, Author’s Chart, FactSet Estimates)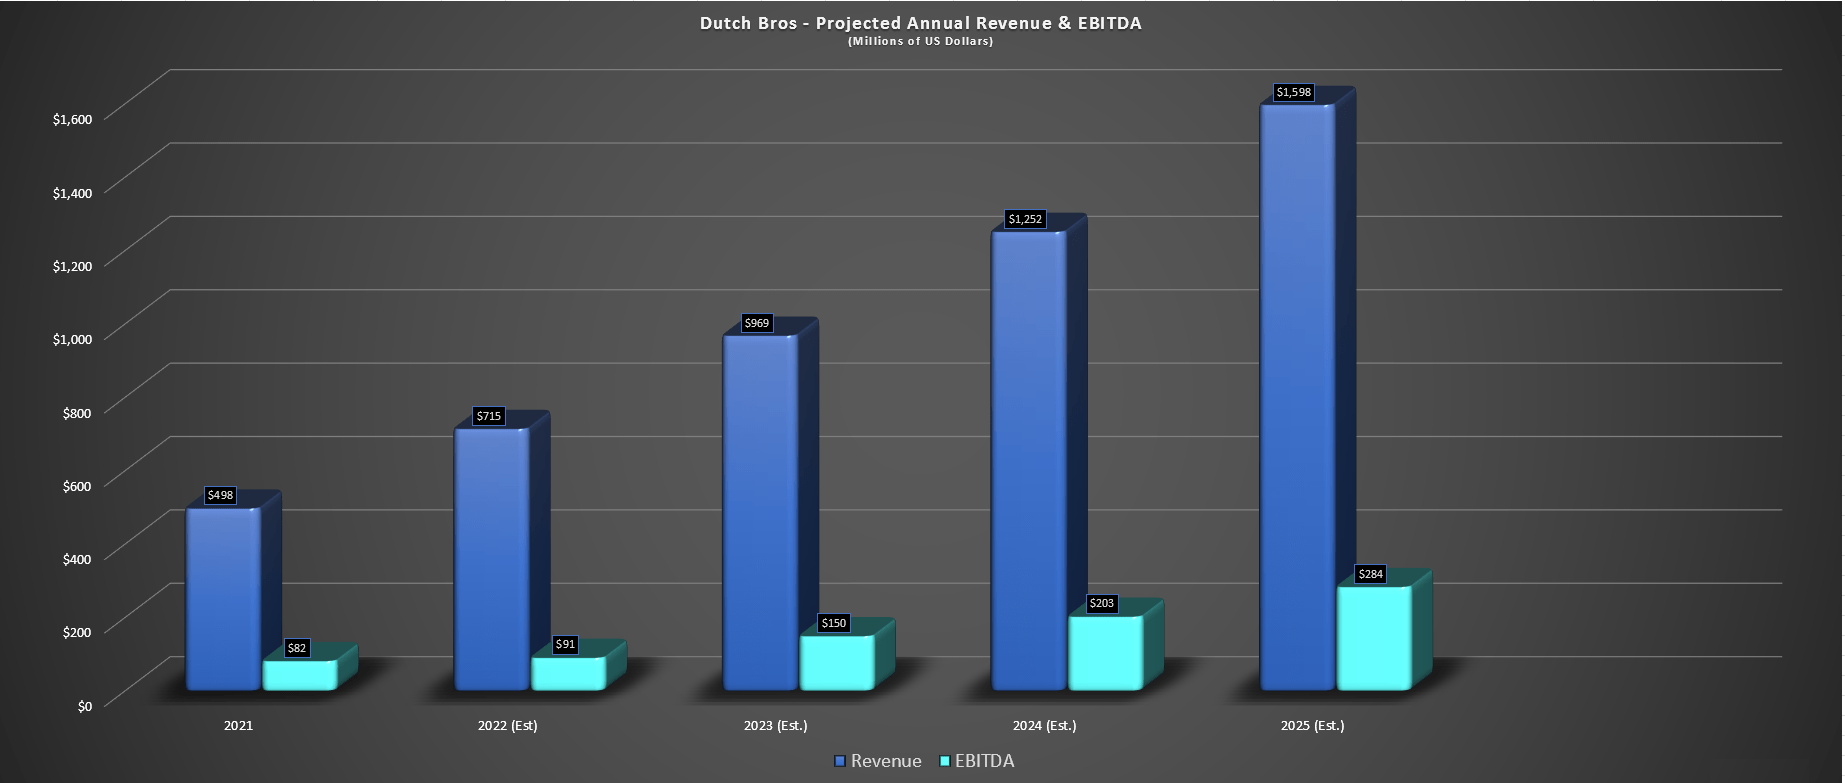
Assuming Dutch Bros meets these forecasts, this would translate to 125% growth vs. 2022 estimates ($203 million vs. $150 million), a phenomenal figure. Meanwhile, on a longer-term basis, Dutch Bros believes it has the potential to more than quintuple its year-end estimated store count (~660) to 4,000 stores, making this a very attractive long-term growth story if it can continue to grow same-shop sales. However, while the growth story here remains intact, the valuation is unpalatable, and I don’t see any way to justify paying up for the stock at these prices after a mediocre quarter. Let’s take a look below:
Valuation
Based on ~163 million shares and a share price of $46.70, Dutch Bros has a market cap of ~$7.61 billion. Let’s compare this figure to updated FY2023 adjusted EBITDA estimates of ~$152 million. Compared to these metrics, BROS trades at 50.0x forward EBITDA, a very lofty valuation, even when it comes to the highest growth company in the restaurant industry. From a P/E standpoint, the valuation is even more unpalatable, with BROS trading at ~47x FY2025 earnings estimates.
Some investors might argue that this premium is more than justified, and investors will always pay up for unrivaled growth stories. However, BROS now trades at a 3-year forward earnings multiple above where Chipotle (CMG) traded during its high growth phase (~40x earnings) on a trailing-twelve-month basis, with an accommodative Federal Reserve. So, with a considerably less accommodative Federal Reserve and the S&P 500 in a cyclical bear market, a massive premium to industry peers during their high growth phases makes little sense.
Chipotle Historical Earnings Multiple (FAST Graphs)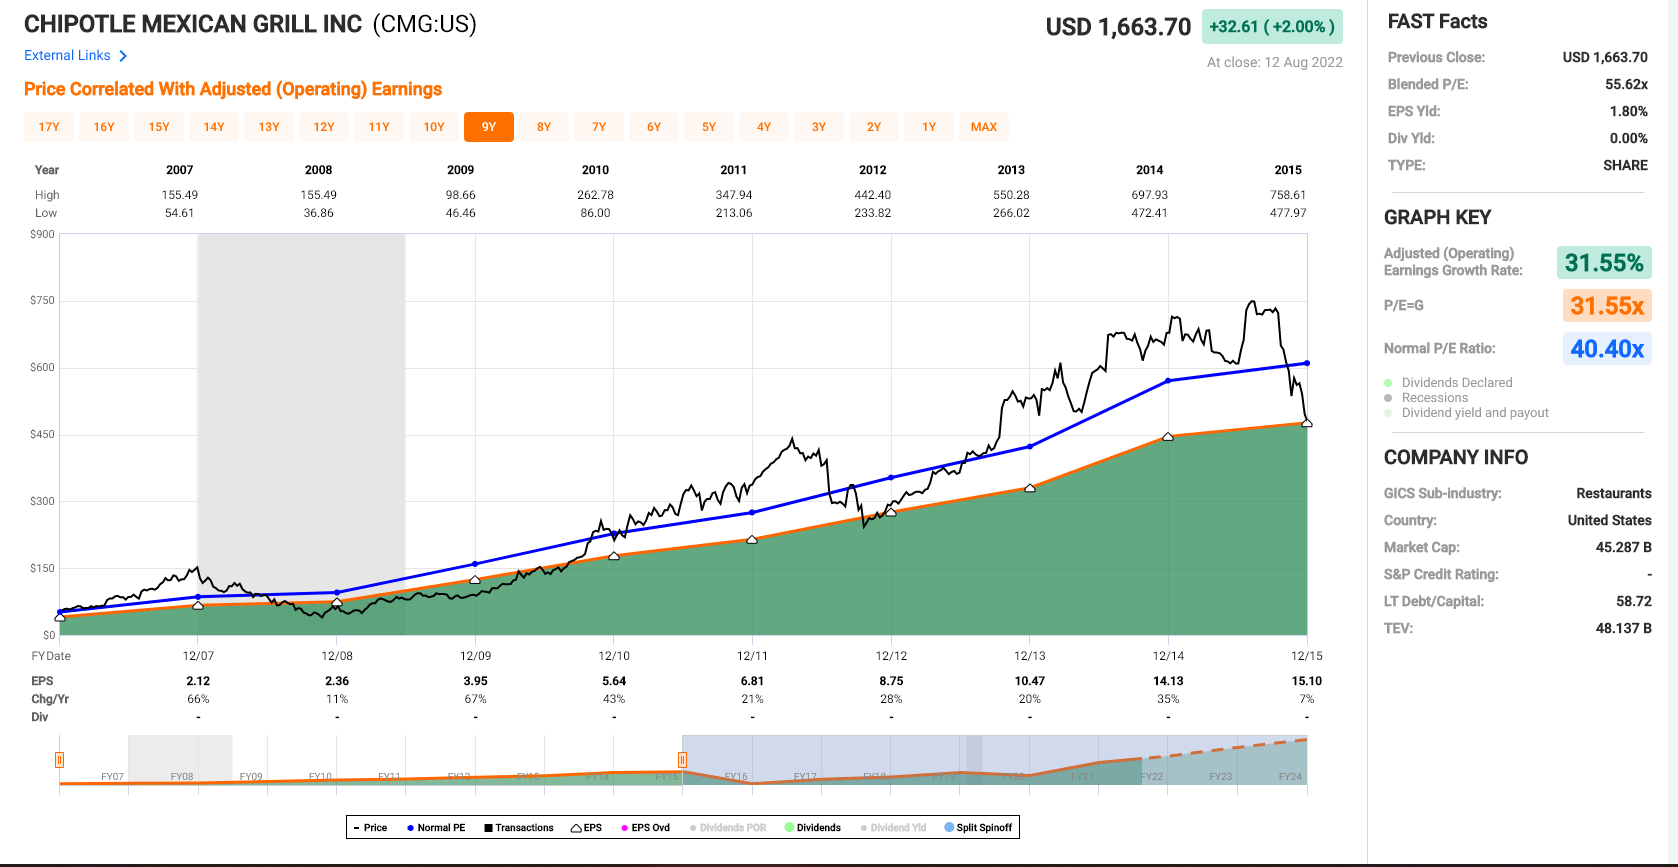
Given that the backdrop for restaurants has rarely been this bad (weak consumer, multi-decade high inflation, tight labor market in retail space), I don’t see any way to justify paying 40x forward EBITDA for Dutch Bros, and even 30x forward EBITDA is a generous multiple. However, even using a multiple of 30x forward EBITDA to value Dutch Bros and giving the benefit of FY2023 adjusted EBITDA (vs. 12-month forward), I see a fair value for the stock of ~$4.56 billion or $27.80 per share. Therefore, not only do I see the stock as an Avoid at current levels, but I would view this as an attractive short idea if this rally continues.
When putting on short positions, I prefer to only short at a minimum 100% premium to fair value to ensure I bake in a safety margin to protect against the stock getting bid up to unreasonable levels on momentum and extreme optimism. Hence, I am not short the stock yet – the level of interest would come in at $56.00.
Technical Picture
Moving to the technical picture, this confirms we’re nowhere near a low-risk buy zone, with BROS trading more than 33% above its upper support level at $31.30 and within 22% of strong resistance at $56.90. Based on $10.20 in potential upside to resistance and $15.40 in potential downside to support, this translates to a reward/risk ratio of 0.66 to 1.0, well below the 5 to 1 reward/risk ratio I prefer to justify entering new positions. Therefore, if I were long the stock, I would view rallies above $50.00 (where the reward/risk ratio would deteriorate to just 0.36 to 1.0) as profit-taking opportunities.
BROS Daily Chart (TC2000)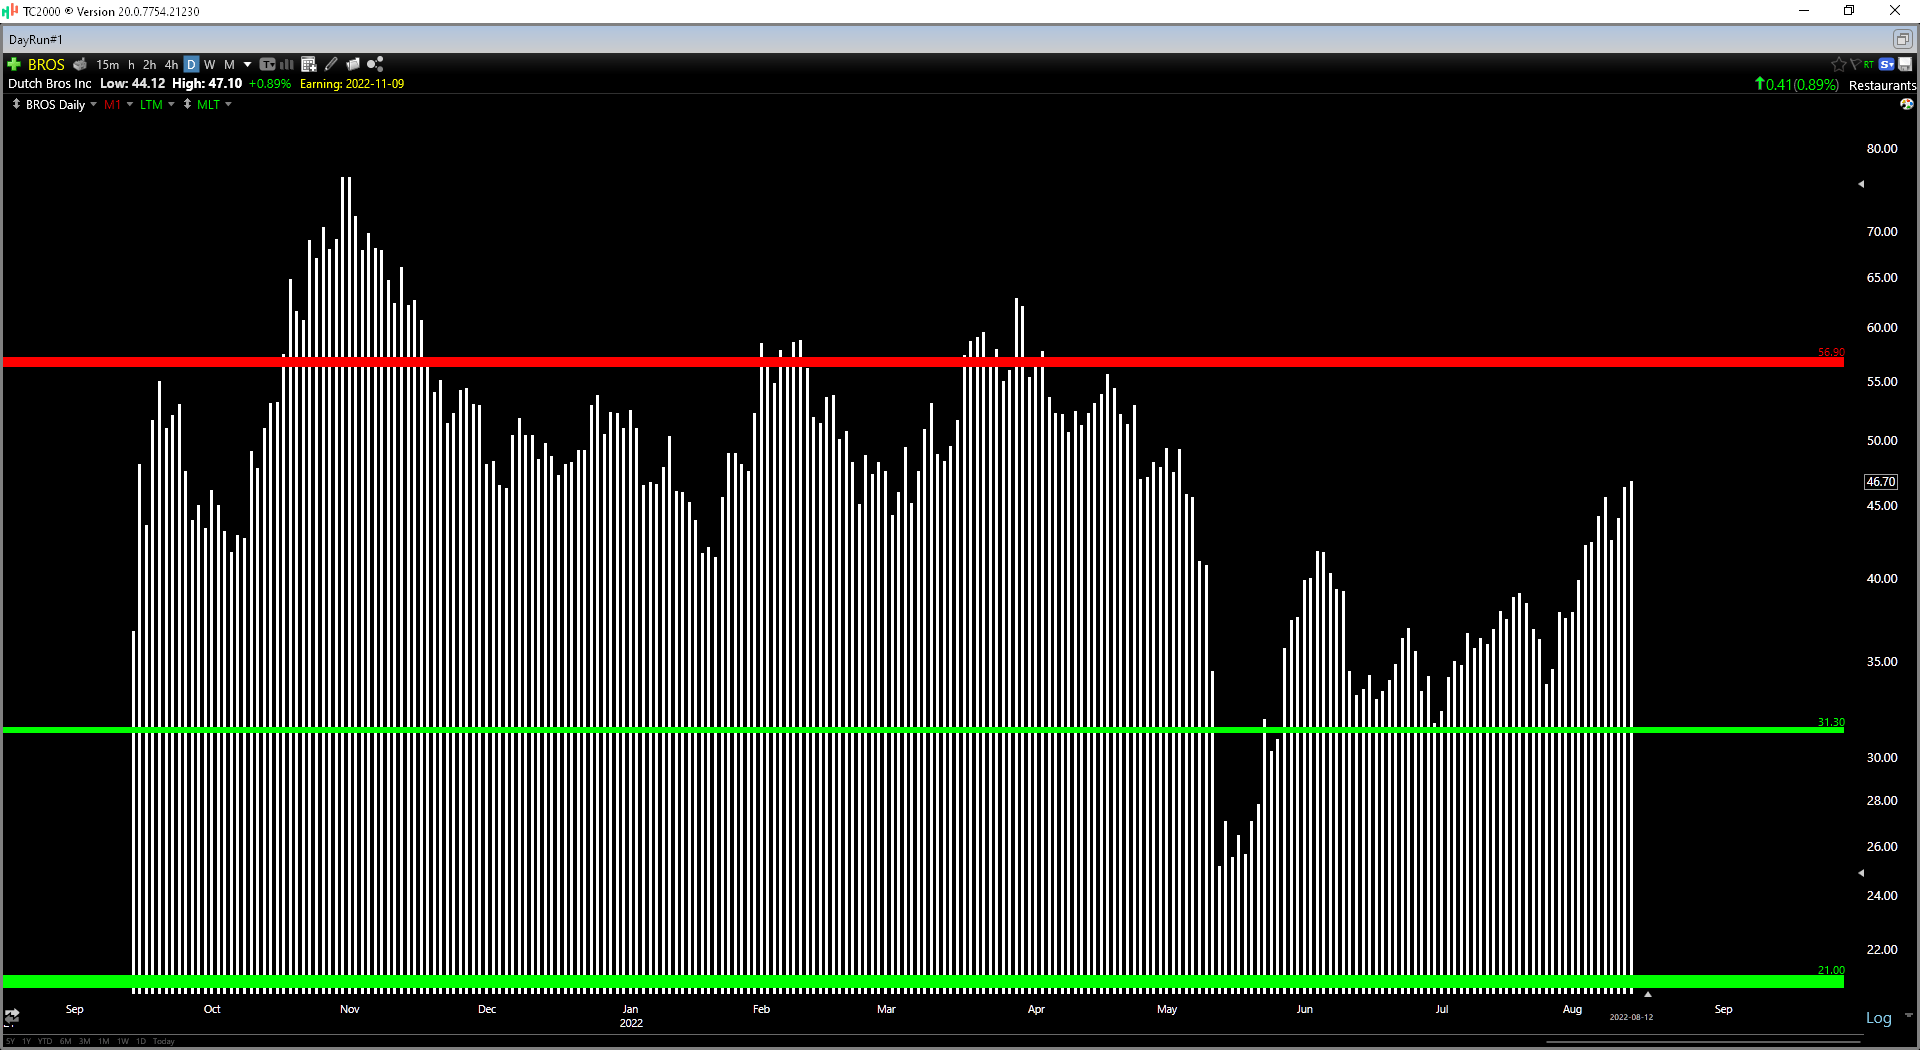
It’s important to note that this unfavorable reward/risk profile doesn’t mean that the stock can’t go higher short-term, and as we saw following its IPO debut, growth stocks can run much further than many expected with the wind at their back (momentum). That said, we are in a different market environment; the margin profile has deteriorated meaningfully vs. 2021 levels, and in 2021, the stock did not have any overhead supply. This time around, there is considerable supply from those that overpaid for the stock, and I would expect many buyers above $55.00 to become sellers if this rally continues. In fact, insiders are also selling and continue to sell even at lower prices than last week’s levels.
Dutch Bros Insider Selling (Nasdaq)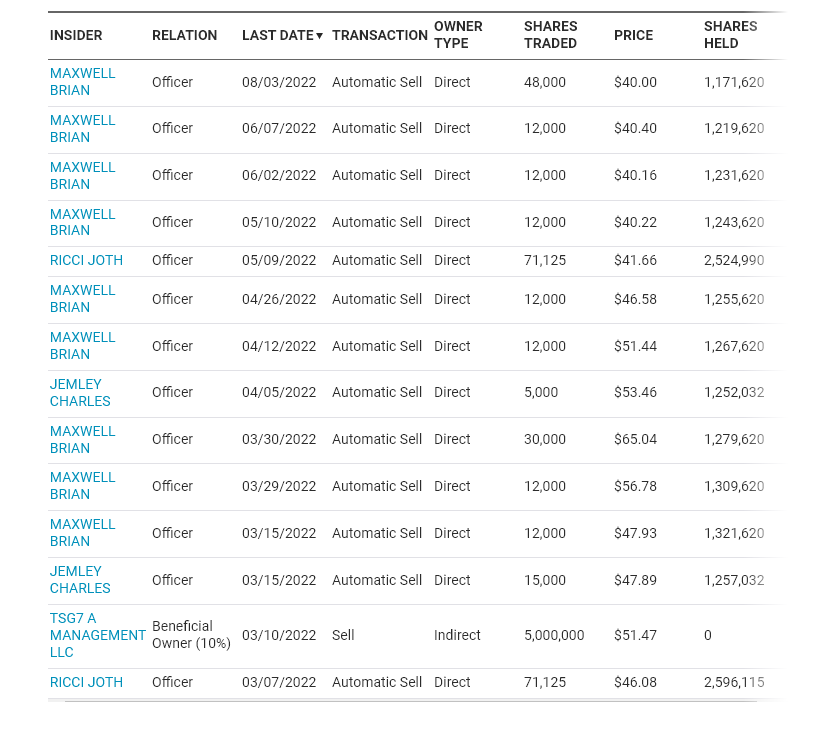
Summary
Dutch Bros saw a meaningful margin improvement on a sequential basis, and unit growth exceeded my expectations (65 new shops), tracking ahead of full-year guidance despite the tight labor market and supply chain headwinds. However, margins were down sharply year-over-year, personal savings rates are at multi-year lows (July: 5.4%), and inflation could be stickier than expected, even if we have seen the peak.
Based on this, I don’t see any way to justify paying up for a company with a discretionary tilt that is not a trade-down beneficiary, like more defensive names such as Restaurant Brands (QSR) and Yum! Brands (YUM). This is especially true when that stock is trading at triple the EV/EBITDA multiple than more established companies in the space. To summarize, if BROS were to trade above $50.00, I would view this as a profit-taking opportunity, and if it were to trade above $56.00 before October, I would view this as an opportunity to short the stock to hedge long exposure elsewhere in my portfolio.
Be the first to comment