

Artur/iStock via Getty Images
Should REITs trade in a tight correlation to bonds?
Should there be some level of connection?
We’re diving into those questions today. We won’t be doing a deep dive on accounting either. I’ve been spending a large chunk of my time on some deep fundamental research, so it’s nice to take a quick break. To be clear, this is absolutely a break. Readers who get upset over a little snark may want to navigate to another article.
When investors hear rates are going up, they often say it is a bad sign for REITs. However, REITs can be dramatically different from each other. I promise to readers right now that I won’t include another sentence so blatantly obvious and worthless.
Focus
We’re talking about equity REITs. No mortgage REITs today. Maybe tomorrow?
Let’s look at the evidence for a connection between REITs and bonds. Investors who believe interest rates and REITs are tightly connected will pull out a chart like this:
A dumb chart for 19 days Ycharts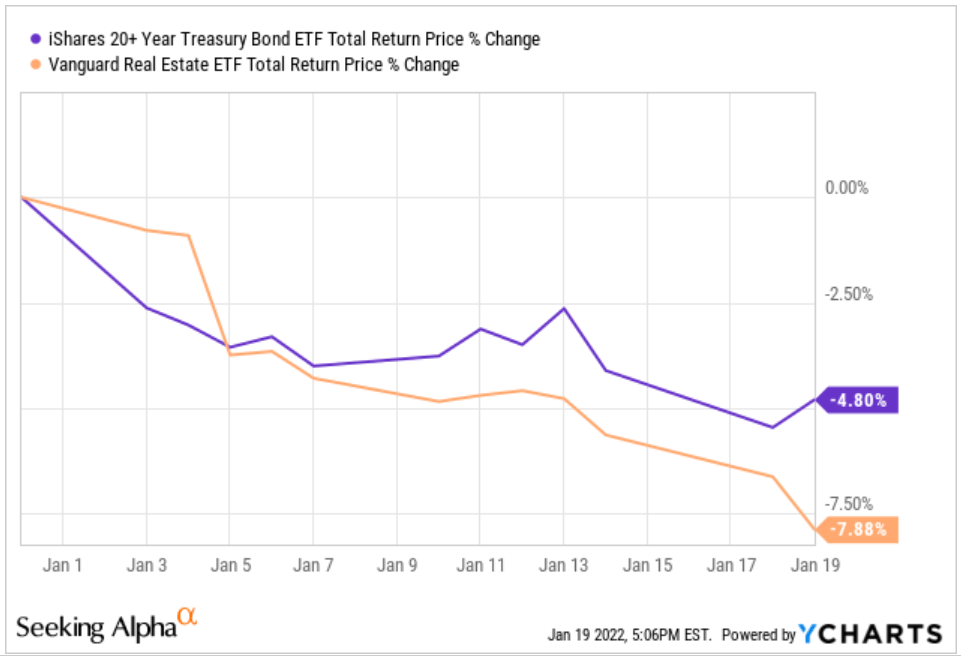
The Vanguard Real Estate ETF (VNQ) and the iShares 20+ Year Treasury Bond ETF (TLT) fell in a pretty tight correlation. Guess that means REITs are really just bonds and we can throw out the rest of human history. Great, article done.
I hope the next chart doesn’t undermine that point before I can skip to a conclusion.
What About 2021?
Prior to 2022, there was a different year. Most people call it 2021. Let’s just verify that the correlation holds there:
This chart just ruined my brief article. Ycharts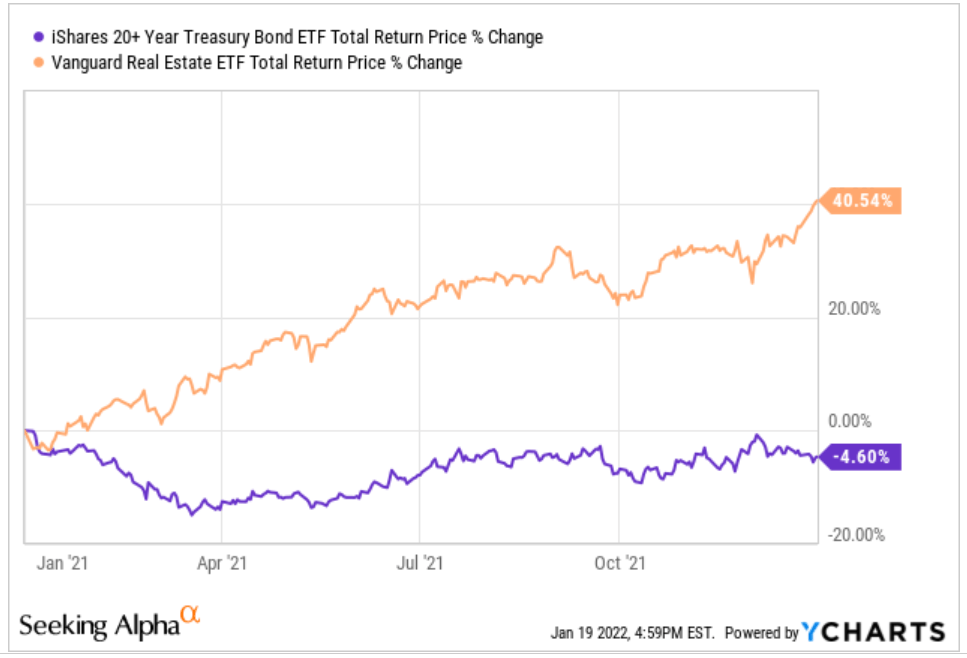
Well, so much for ending the article in 200 words. It looks like 2021 disagrees with the first 19 days of 2022. If only we had a way to tell which sample size was larger. Let’s try a chart:
Sadly, this probably isn’t even the dumbest chart you’ve seen this week. The REIT Forum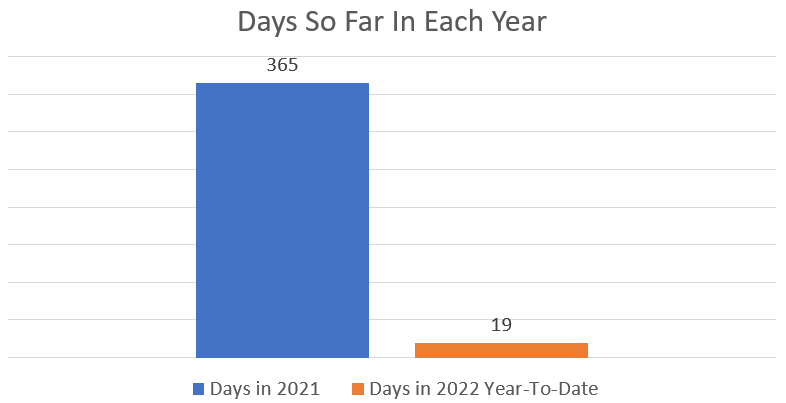
Brilliant! To be clear, I promised to avoid useless redundant sentences, not that every chart would be useful.
Differences Exist
Using VNQ as the REIT measuring stick is a bit too simplistic. We’ll do it anyway when I feel like it, but you should know it’s too simplistic.
Here’s a comparison adding the Sucker Yield REIT ETF into the mix for 2021. Sorry, that’s supposed to say Invesco KBW Premium Yield Equity REIT ETF (KBWY). Somehow it just keeps coming out as the Sucker Yield REIT ETF.
REITs are not Treasuries. Stop it. Ycharts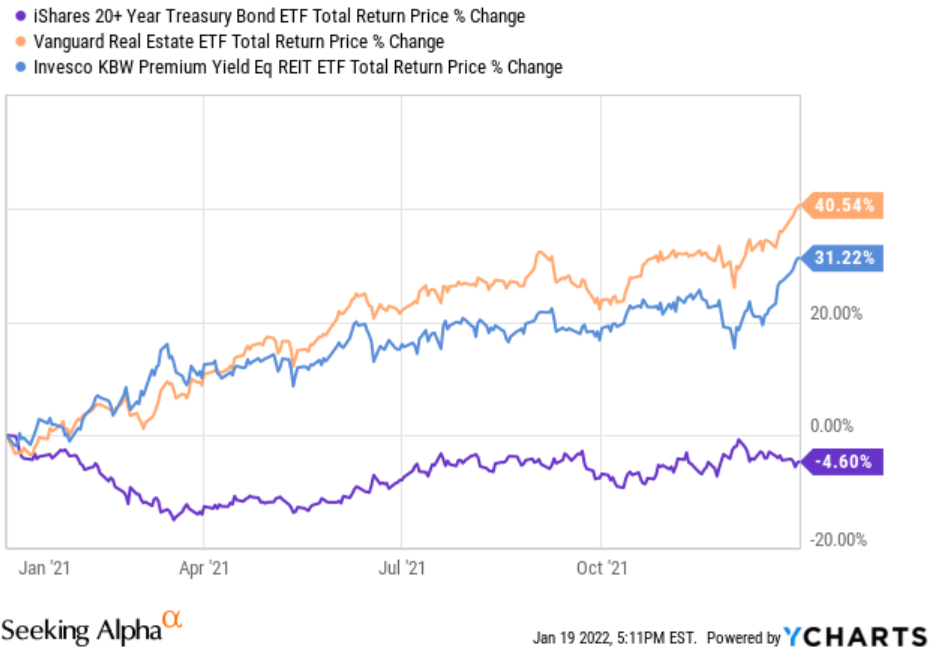
It appears that REIT ETFs generally correlate with each other better than they do with interest rates.
What happens if we zoom out further? Let’s break it down by scribbling on the chart. Here’s a five-year chart:
A chart I scribbled on in paint Ycharts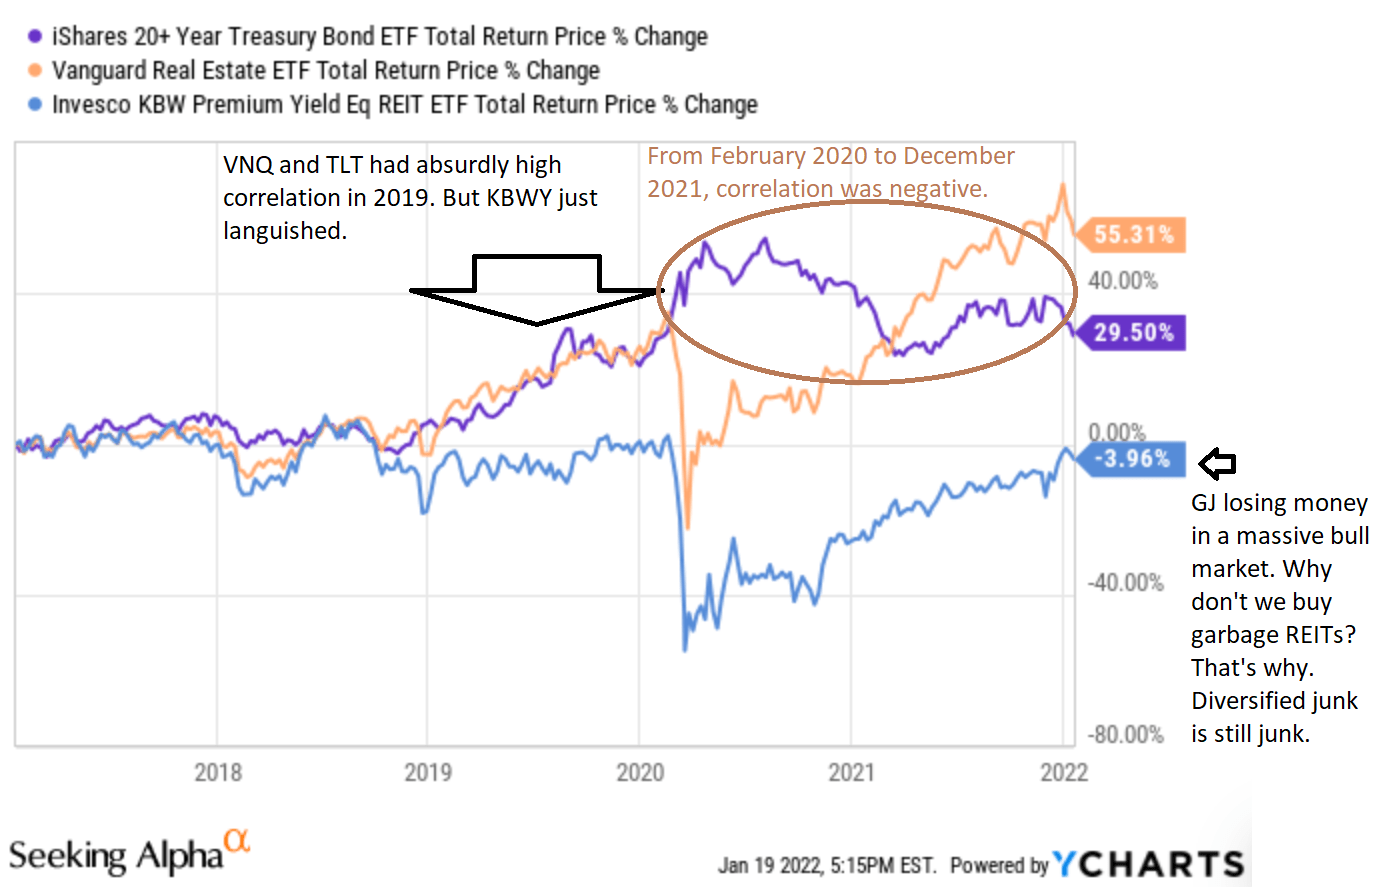
Pretty clear? In 2017 and 2018 returns were mediocre so correlation didn’t really matter. In 2019, the correlation was insanely strong. However, for nearly two years the correlation turned negative.
Congrats to investors in KBWY who held through the pandemic. They’re almost back to even if they reinvested all dividends! If returns go up a bit more they could afford a happy meal. Not bad for 5 years…
A Better Correlation
So what actually has a better correlation for REITs? You’d be better off comparing REITs to a high-yield bond fund like the iShares iBoxx High Yield Corporate Bond ETF (HYG):
Junk bonds generally correlated better because they respond to economic uncertainty. Ycharts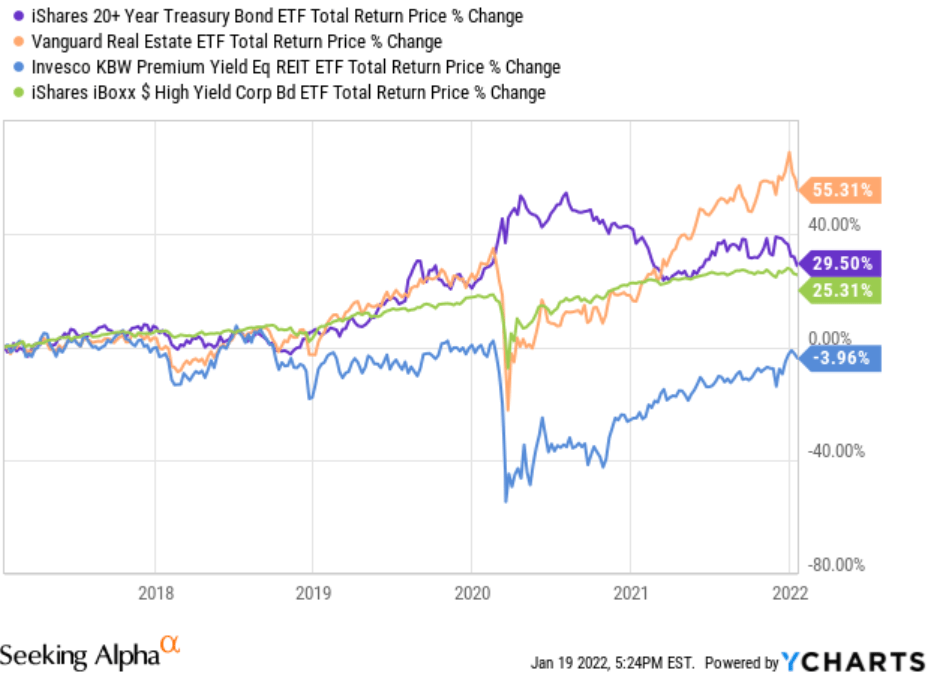
During 2019 the correlation wasn’t as strong, but at least it fell and recovered from the pandemic. That’s not much, but it’s something.
There’s something else funny going on though.
Which kind of equity REIT should have the highest correlation with Treasuries? The net lease REITs. They typically have an average remaining contract length of around 10 years. That means the most relevant portion of their future rental income is already under contract. Sometimes these contracts have escalators that tie in changes in CPI (the Consumer Price Index).
Yes, CPI has severe flaws. I know, you know, and it doesn’t get a section in this article.
Reliability
Let’s be realistic. Realty Income (O) has a dividend more reliable than bonds issued by junk REITs. It’s not just Realty Income though. National Retail Properties (NNN) and W.P. Carey (WPC) also have over 25 years of consecutive dividend growth.
It’s a perk of the net lease strategy. It works very well for generating long-term dividend growth. Since the REITs already know their future cash flows (due to long contracts), they should be more heavily impacted by interest rates.
However, when we look at the net lease REIT sector, you’ll notice that they are all outperforming VNQ year-to-date:
Net lease REITs are actually outperforming most types of REITs. Seeking Alpha’s Portfolio Tool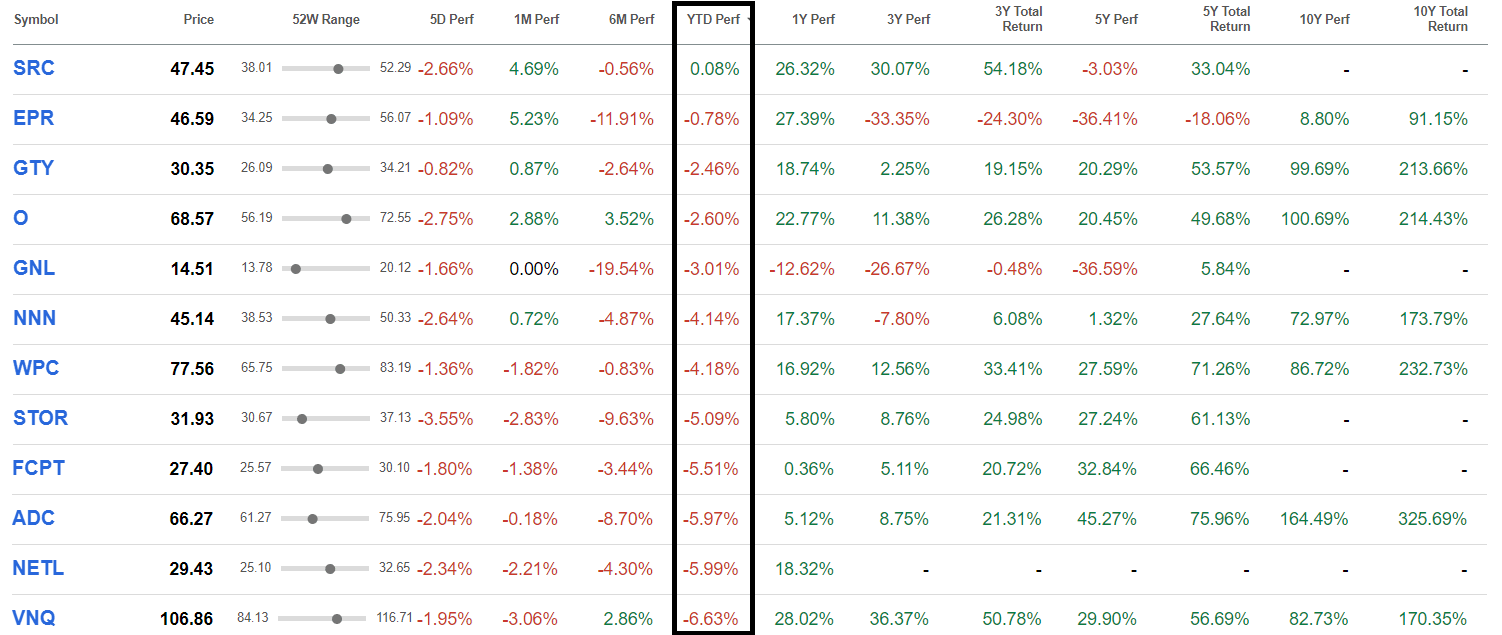
I should probably point out that I haven’t placed every net lease REIT into that “portfolio”. It’s just a quick tool for checking sector momentum. Perhaps the most impressive thing is that the NETLease Corporate Real Estate ETF (NETL) had the second-worst performance. Sorry about the fund choosing to have part of their name capitalized, I don’t find it creative either.
More Words
We’ve clarified at least a few points already:
- REITs are not bonds.
- Negative returns for KBWY are funny.
- Net lease REITs fundamentally should have the most correlation with bonds.
If we were to look at the REITs with the best returns year-to-date (using my list of most REITs), the result doesn’t give us a strong correlation. Someone will probably pull out a random REIT that isn’t the list. Doesn’t matter. The points will stand.
The best performer is InnSuites Hospitality Trust (IHT). The equity market cap is less than $100 million. Toss that up to volatility. Whether investors have a huge gain or a huge loss depends on their entry price:
The price went up, way up. Then it cratered. But hey, it’s back up. Sort of. Seeking Alpha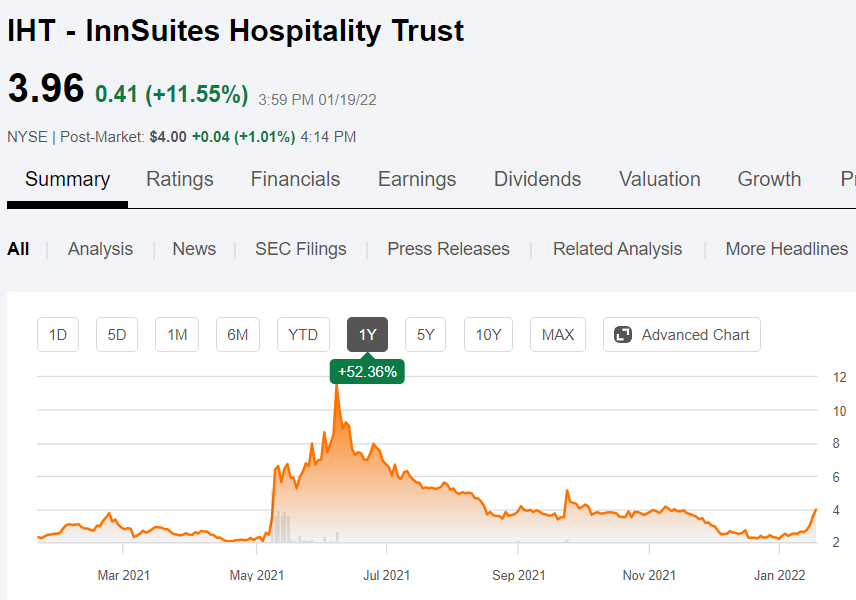
That’s special. Okay, so technically they are up big year-to-date, but we like to gamble. What comes next?
CorEnergy Infrastructure Trust (CORR) is up around 30% year-to-date. Sounds like a monster:
This image needs a caption also but I’m tired of writing captions. Seeking Alpha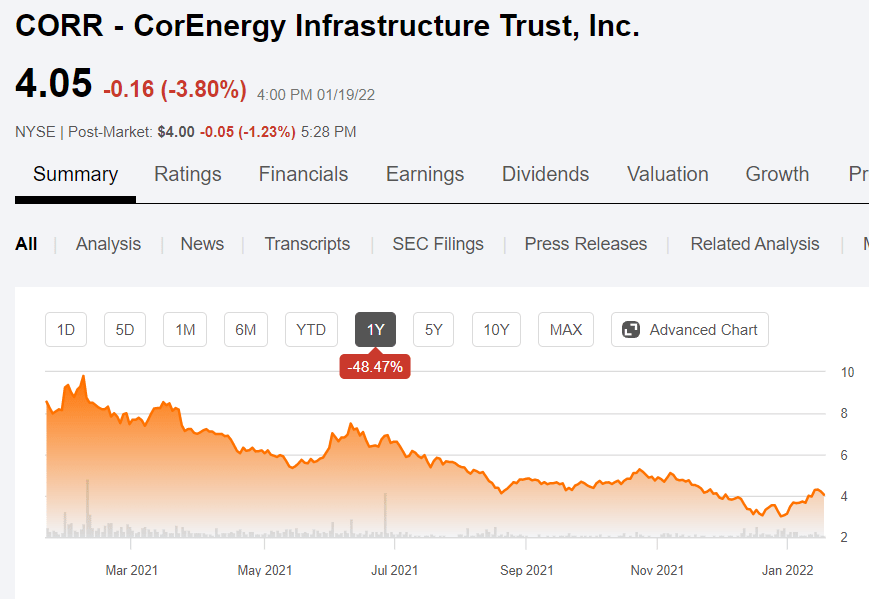
Well, technically it’s still up 30% year-to-date.
So which REITs are down year-to-date? Generally, it’s your pick of REITs that delivered monstrous growth in AFFO per share for several years. It’s REITs with stronger balance sheets. The kind of REITs who won’t need to refinance a bunch of debt at higher rates over the next year or two. Those are the ones getting pummeled. Tower REITs, data center REITs, industrial REITs, and storage REITs are getting pummeled.
Some investors are probably already yelling:
“TheY haVe LoW YieLds DumMy!”
Who am I kidding? Most of those “investors” left after they got confused by the abundance of complete sentences.
If short-term rates increase, as the yield curve is screaming they will, does that really favor weaker high-yielding REITs? The ones whose dividends will be under greater pressure over the coming years from rising rates? No, it doesn’t.
Conclusion
We can review our starting questions now along with some others I made up along the way:
- Should REITs trade in a tight correlation to bonds? No.
- Should there be some level of connection? Sure.
- What does the last 19 days prove? Some investors like sucker yields.
- Is the market being intelligent today? No.
Anyone who assumes today’s prices are perfectly efficient would have to also believe all prior prices were perfectly efficient. But that would imply that there was a huge fundamental shift over the last few weeks. There wasn’t.
Rates are higher. That’s true. Anyone who was holding one of the dividend growth machines for the current yield didn’t understand their own investment. The reason to own those high-growth REITs is because of the reliable growth in AFFO per share driving total returns higher. In the meantime, they provide a nice stream of additional income to the shareholder.
Sound off in the comments. Let’s see who writes a comment without even skimming the article.
Be the first to comment