

Epiximages
Investment Thesis
On January 16, 2006, WisdomTree launched five ETFs aimed at investors wanting exposure to small-cap, mid-cap, large-cap, total-cap, and high-yield dividend-paying companies. Today, I want to compare two of the best performers: the WisdomTree LargeCap Dividend ETF (NYSEARCA:DLN) and the WisdomTree Total Dividend ETF (NYSEARCA:DTD). I believe that while the differences are slight, one has the edge in this environment. This article will take you through their fundamentals and help you decide which one better suit your needs.
ETF Overview
DTD Strategy and Exposures
WisdomTree lists three reasons to invest in DTD:
- Gain exposure to U.S. dividend-paying stocks from all size segments
- Complement or replace all-cap or dividend-oriented strategies
- Satisfy demand for growth potential and income focus
DTD tracks the WisdomTree U.S. Dividend Index, a fundamentally-weighted Index that aims to define the entire U.S. dividend-paying universe. Constituents are weighted based on total cash dividends expected to be paid over the next year based on the most recent dividend payment, with annual reconstitutions occurring in December. To be eligible, a company must meet the following criteria:
- be listed on a U.S. stock exchange
- be incorporated and headquartered in the U.S.
- pay regular cash dividends on shares of its common stock
- have a market capitalization of at least $100 million on the screening date
- have an average daily dollar volume of at least $100K in the last three months
REITs and holding companies are eligible, but limited partnerships, limited liability companies, royalty trusts, and BDCs are not. In addition, WisdomTree excludes securities that fall in the bottom 10% of a composite risk factor score that measures quality and momentum, as described below.
- Quality: determined by trends on ROE, ROA, gross profits over assets, and cash flow over assets
- Momentum: determined by risk-adjusted total returns over the last six and twelve months
I think these screens are reasonable and not overly strict to ensure a well-diversified “core” portfolio. DTD holds 637 securities, has a 0.28% expense ratio, has $510 million in assets under management, and yields 2.30%. In addition, DTD has grown dividends at an annualized rate of 6.08% and 7.39% over the last five and ten years. While these growth rates are lower than you could get with other ETFs like the iShares Core Dividend Growth ETF (DGRO), dividend growth isn’t the focus.
One of the strengths of DTD is that no sector makes up much more than 15% of the portfolio. The Index has a 25% sector capping rule (10% for Real Estate), but I think passive investors will appreciate this level of diversification. Financials, Health Care, Technology, and Consumer Staples are all near the 15% mark, so it sounds like a nice mix of safe and riskier stocks.
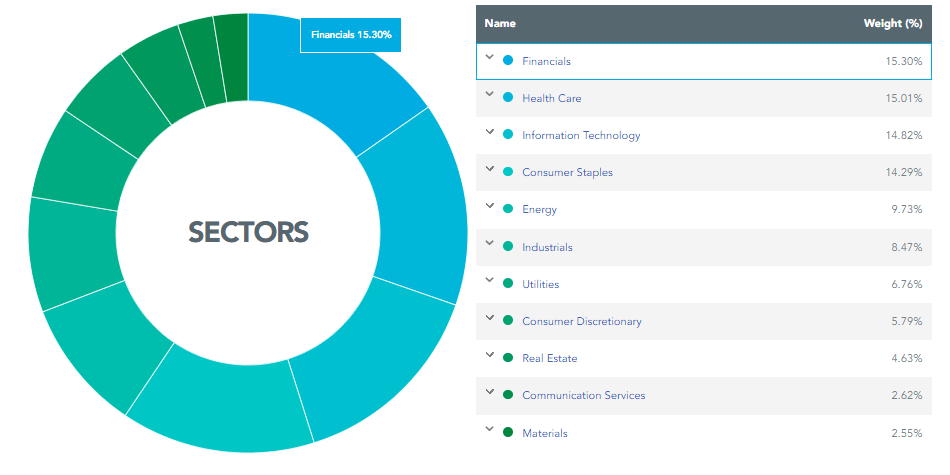
WisdomTree
The top ten holdings total 25.86% of the total portfolio and include Microsoft (MSFT), Apple (AAPL), Exxon Mobil (XOM), and Johnson & Johnson (JNJ). Microsoft and Apple’s yields are small (0.82% and 0.52%), but they still receive a high Index weighting because of the large number of outstanding shares. For this reason, I view DTD’s dividend-dollar-weighting scheme as similar to a market-cap-weighting method. Despite their small yields, big companies are still likely to be dominant.
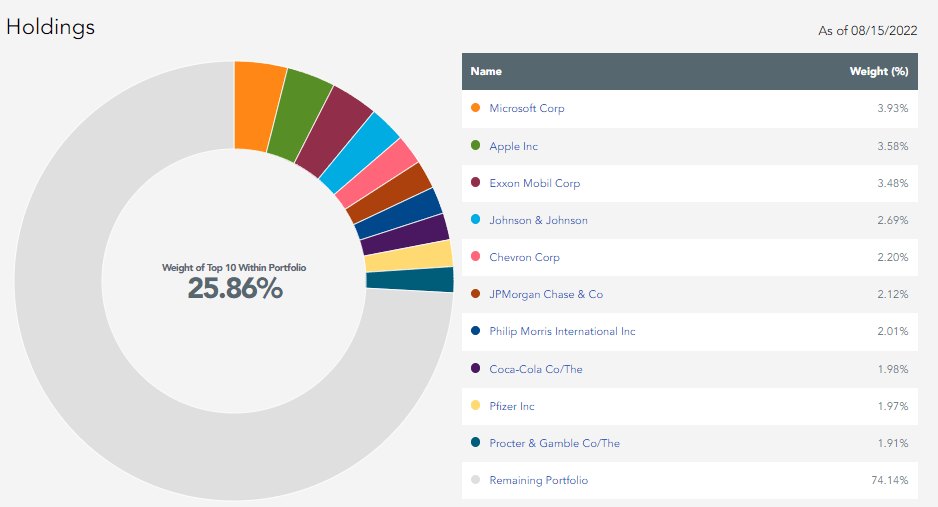
WisdomTree
DLN Strategy and Exposures
WisdomTree lists three reasons to invest in DLN:
- Gain exposure to U.S. large-cap dividend-paying stocks
- Complement or replace large-cap value or dividend-oriented strategies
- Satisfy demand for growth potential and income focus
The language is the same, except that WisdomTree references only large-cap dividend-paying stocks. DLN is merely a cutout of DTD that includes the top 300 largest securities by market capitalization. All other rules apply, and shareholders end up with these sector exposures:

WisdomTree
As shown, DLN’s top sectors are the same as DTD’s, but it has slightly more exposure to Health Care and Technology and less in Financials. The primary source is the higher allocation to mega-cap stocks like Apple and Microsoft. DLN is simply a more concentrated version of DTD, and although it holds 340 fewer securities, they only combine to total 13.23% of DTD’s weight.
DLN’s top ten holdings total 28.88% or 3.02% more than DTD. The list is the same, but it’s worth noting that all but three of DLN’s top 25 holdings have market capitalizations above $150 billion. The three exceptions are Altria Group (MO), Devon Energy (DVN), and Gilead Sciences (GILD), chosen for their forward yields of 7.95%, 9.75%, and 4.41%, respectively. Devon Energy recently made headlines after increasing its quarterly dividends by 22% over the previous quarter. Still, their fixed plus variable dividend policy means dividend consistency may be an issue.
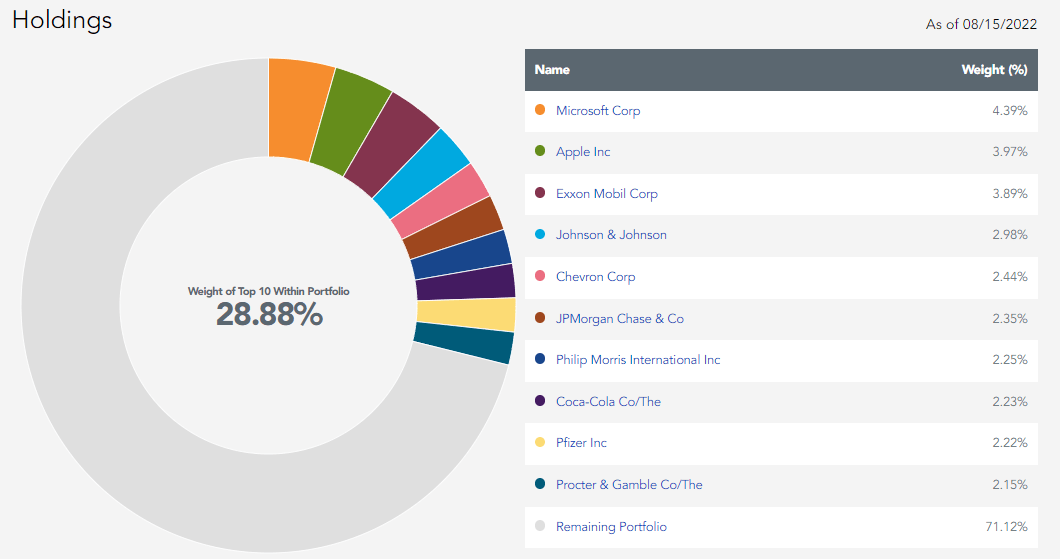
WisdomTree
Performance Analysis
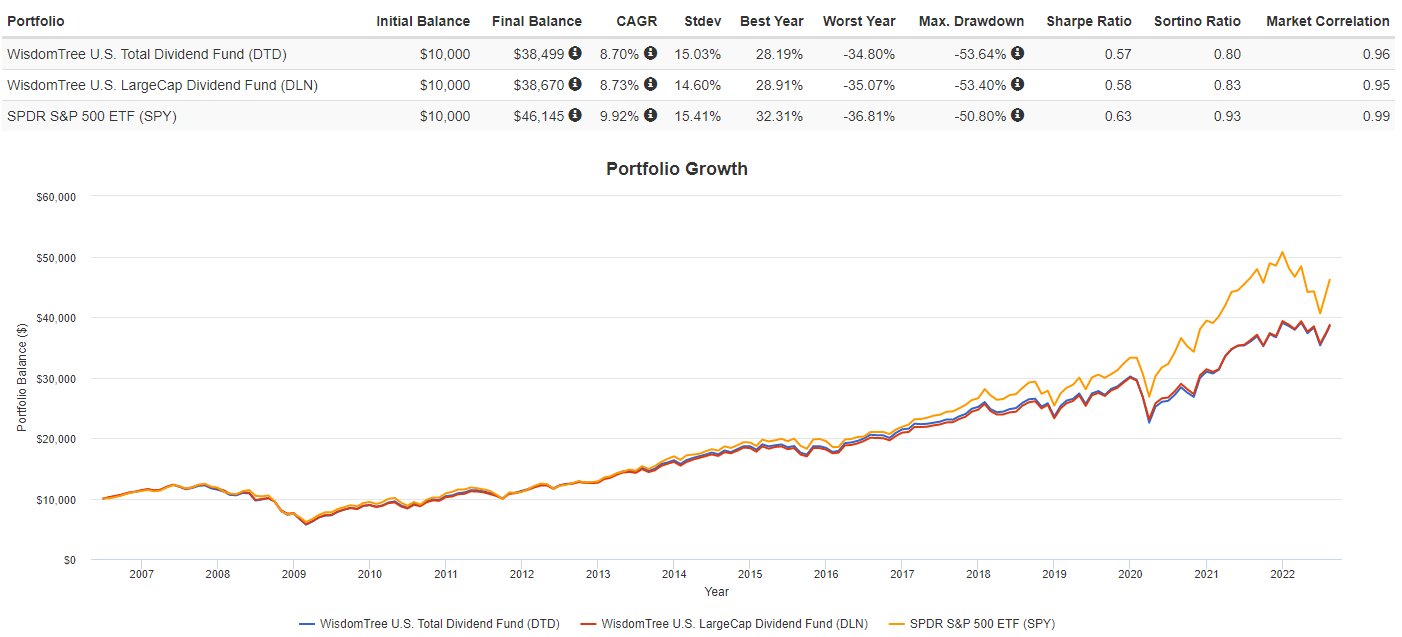
The graph below compares the performance of DTD and DLN against the SPDR S&P 500 ETF (SPY) since July 2016. DTD and DLN have gained an annualized 8.70% and 8.73% compared to 9.92% for SPY but experienced slightly less volatility as measured by standard deviation. DTD and DLN’s drawdowns were worse during the Subprime Crisis from November 2007 to March 2009 (53.40% and 53.40% vs. 50.80%), which goes against what some may assume to be a conservative strategy.
Portfolio Visualizer
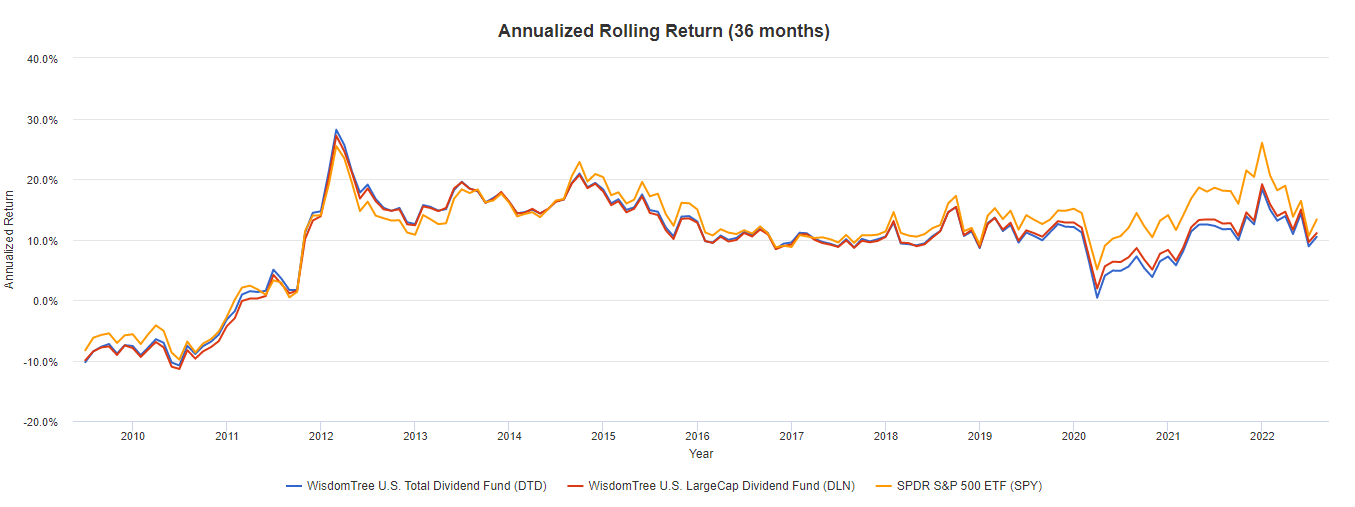
However, there have been many peaks and valleys over 16 years, so I think it’s more beneficial to view performance on a rolling basis. As shown below, there are several periods where DTD and DLN were better choices, but performance significantly diverged and peaked at the end of last year. Since then, a normalization has occurred as inflated valuations caught up with the growth stocks in SPY. Some may view this as a missed opportunity, but that would require a regular evaluation of market sentiment, for which many investors have no desire. I think dividend investing is more suited to passive investors, and since the rest of the chart looks reasonably good, I don’t think either are poor “core” ETFs.
Portfolio Visualizer
What’s also important is that DTD and DLN have performed almost identically over time. The 0.28% expense ratio is the same, so readers are seeing the impact of the 13.23% mid-and small-cap stocks added to DTD. It’s obviously small, and there were only five months (out of 194) where returns diverged more than one percent. In May 2009 and March 2020, DLN outperformed DTD by 2.09%, highlighting investors’ preference for large-cap stocks they deemed safer investments.
Fundamental Analysis
There isn’t much separating DTD and DLN from a historical performance perspective, but there are some minor details I want to highlight from a fundamental perspective. This section will compare metrics for each fund’s top 20 industries, focusing on size, growth, dividends, and valuation.
DTD vs. DLN
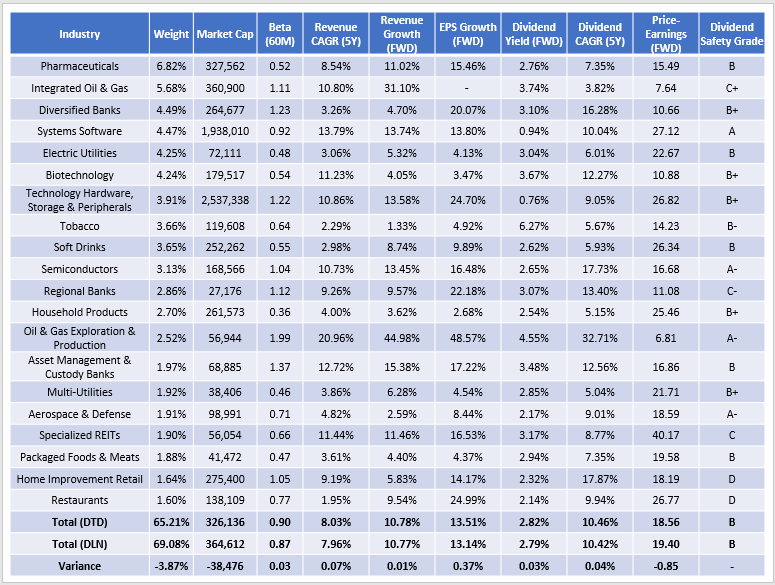
DTD’s top 20 industries are listed below, showing how Pharmaceuticals (6.82%), Integrated Oil & Gas (5.68%), Diversified Banks (4.49%), and Systems Software (4.47%) are dominant. As mentioned before, it’s a nice mix of safe, low-volatility stocks in the Pharmaceuticals industry with riskier oil and bank stocks. Next on the list are Electric Utilities which have a weighted-average 0.48 beta and are excellent in recessions. This table also highlights how the ETF’s yield is weighed down by high allocations to Tech industries like Systems Software (0.94%) and Technology Hardware, Storage & Peripherals (0.76%). These additions promote diversification and growth at the expense of yield. Other ETFs, like the Vanguard High Dividend Yield ETF (VYM), are worth looking into if income is your primary objective.
The Sunday Investor
We see that DTD has 65.21% of assets in its top 20 industries, making it one of the more diversified dividend ETFs I’ve come across. Most are in the 70-80% range, and the more concentrated ones, like the WisdomTree U.S. High Dividend ETF (DHS), approach 90%. These strategies can produce exceptional returns for investors watching the markets closely. However, I think they’re better used to complement core ETFs like DTD and DLN.
DTD’s five-year beta of 0.90 is below the 0.91 average for the U.S. dividend equity ETF space. High dividend ETFs like the Legg Mason Low Volatility High Dividend ETF (LVHD) have betas as low as 0.68, while small- and mid-cap focused dividend ETFs like the First Trust SMID Cap Rising Dividend Achievers ETF (SDVY) reach as high as 1.20. As you add more small- and mid-cap stocks to your portfolio, expect the risk level to increase accordingly. Since DTD includes about 13% of these stocks, it’s no surprise to see its beta slightly higher than DLN.
DTD has a forward price-earnings ratio of 18.56 compared to 19.40. The difference is that DTD holds several small and cheap Regional Banks and Oil & Gas E&P stocks that you’re unlikely to spot when scanning the holdings list. Examples include M&T Bank (MTB) and Continental Resources (CLR), with forward price-earnings ratios of 12.70 and 5.81. It’s important to remember that these stocks are in volatile industries, so if you’re looking to reduce your risk, DLN may be the better option.
Apart from volatility and valuation, DTD and DLN look remarkably similar, with DTD having a slight edge on revenue and earnings growth. DTD has a weighted-average 2.82% gross dividend yield; after subtracting the 0.28% expense ratio, a net yield of 2.54% is expected.
DLN vs. DTD
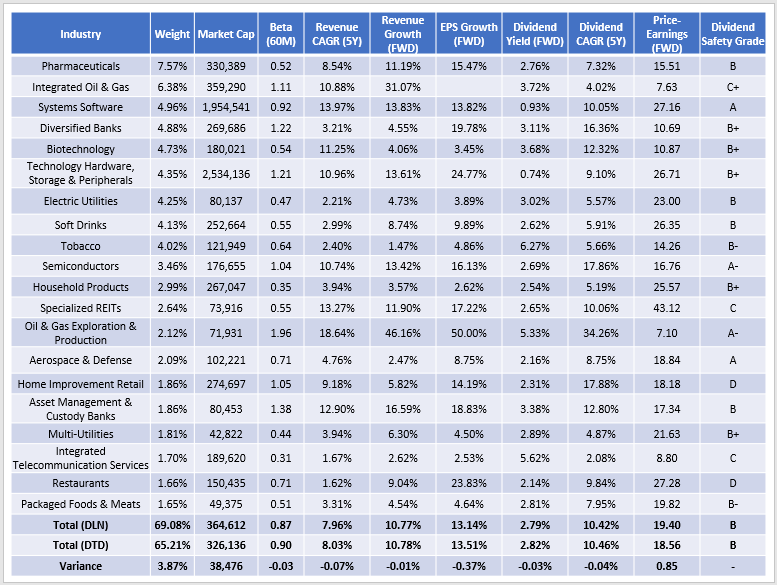
When considering DLN’s top 20 industries, Regional Banks are eliminated in favor of Verizon Communications (VZ), part of the Integrated Telecommunication Services industry. You’ll also notice a 0.75% higher weight given to Pharmaceuticals stocks and an increase in total market capitalization from $326 billion to $365 billion.
The Sunday Investor
DLN and DTD both have a weighted-average “B” Dividend Safety Grade. Twenty dividend funds score better, the best being the Vanguard Dividend Appreciation ETF (VIG). Unfortunately, in nearly all these cases, you’ll have to either pay more in fees or receive less in dividends.
Investment Recommendation
DTD and DLN are two ETFs with very similar track records and fundamentals, but I would give the edge to DTD based on its slightly higher growth potential and lower valuation. I don’t mind the extra volatility, as its 0.90 beta is around what I’m targeting. However, it all depends on what else is in your portfolio. DLN is a new addition to the Active Equity ETF Model Portfolio that I manage at Hoya Capital, so as long as you’re using it to balance out your other holdings, I think either can work well. Thank you for reading, and I look forward to your thoughts in the comments section below.
Be the first to comment