

Editor’s note: Seeking Alpha is proud to welcome Sparrow Research as a new contributor. It’s easy to become a Seeking Alpha contributor and earn money for your best investment ideas. Active contributors also get free access to SA Premium. Click here to find out more »
dusanpetkovic/iStock via Getty Images
It’s been over a year since someone last wrote a piece on DS Smith (OTCPK:DITHF). I figure I can give it a try. The author of the last article rated DS Smith a “strong buy” at £3.66 per share. Recently, shares have plunged to £2.66. What has happened between then and now, and is DS Smith still a buy?
In my view the market is mistaken about DS Smith, and I believe it is a strong buy. In this article, I will briefly describe the company profile, set forth the reasons why I believe shares are undervalued, and provide several potential downside risks.
Company profile
DS Smith operates three lines of businesses: paper, packaging and recycling. Roughly speaking, in terms of paper they produce corrugated case material, which is used to make packaging. With regard to packaging they package items for consumers, e-commerce and industrials – i.e., by putting them into cardboard boxes. And for recycling, they recycle used cardboard boxes and turn them into raw materials to make new cardboard boxes.
They have substantial minority stakes in “associate” companies: four in Spain, two in the U.S., and one in Ukraine.
Their main competitors are Smurfit Kappa (OTCPK:SMFKY) and Stora Enso (OTCPK:SEOJF). On a trailing twelve months basis, in FY 2022 DS Smith earned £7.2 billion in revenues, Smurfit Kappa £10.0 billion, and Stora Enso £9.4 billion. These three can be considered the triumvirate of the European paper-packaging industry.
Some statistics at a glance, as of close of business on Aug. 26, 2022:
- Share price: £2.66
- Market cap: £3.66 billion
- P/E ratio: 13.1
- Debt to equity: 0.36
- Operating margin: 6.09%
- Profit margin: 3.87%
Upside case
In this section I describe why I believe DS Smith shares are undervalued. For the avoidance of doubt, the fiscal year (FY) for DS Smith is from April 30 of the previous year to April 29 of the current year. When I write, for example, FY 2022, the reader should understand this to mean between April 30, 2021, to April 29, 2022.
DCF Valuation
I use the discounted cash flow method to estimate a fair value for DS Smith, and I find that the fair value of a DS Smith share is between 13% to 41% above its current price. I consider DCF appropriate to use for the valuation because in the last 10 years DS Smith has been profitable every year, and has paid dividends in every year but one (2020, when they wanted to conserve cash because of the pandemic).
Moreover, the amount of dividends paid has increased steadily over time. In FY 2022, each share paid £0.129 in dividends; in FY 2012 that was £0.073. This implies a CAGR of 5.9% for historical dividend payouts.
The DCF method gives the fair present value of a share as:
V0 = D1 / (r – g)
Calculating D1
DS Smith pays dividends twice a year. Therefore, I set D1 as the sum of the two dividend payments in the next twelve months, which will occur in October 2022 and April 2023.
DS Smith has already declared a dividend of £0.102 in October 2022. I assume, conservatively, that the dividend payment in April 2023 will be the same as the dividend in April 2022 – i.e., £0.048. (I would note that it’s conservative to assume no growth for the April dividend. The payment in October 2021 was £0.081, which means the year-on-year growth rate for the October dividend was 25%.)
In this case, I set D1 as £0.15.
Calculating g
I estimate g, the sustainable growth rate for DS Smith, as:
g = RR x ROE
My review of sell-side analyst reports suggests that the median forward-looking return on equity for DS Smith is slightly below 15%. For simplicity, I round this down and set ROE as 14%.
In FY 2022, DS Smith has earnings per share of £0.204, and paid a dividend of £0.129. The retention ratio is calculated as retained earnings divided by earnings per share. In this case, I set the retention ratio as 36.8%.
This yields a sustainable dividend growth rate of 5.1%. For simplicity, I round this down to 5%. (I note that on average we expect real GDP growth and inflation to both be around 2.5% per year. This means the DCF method predicts DS Smith dividends to grow around the same rate as nominal GDP, which is entirely reasonable.)
Calculating r
The annualized total return of the FTSE 100 index, of which DS Smith is a constituent since its establishment in 1984, is 7.75%, and I use the Bank of England rate of 1.75% as the risk free rate.
I note that the company’s 1-year daily equity beta is around 1.39 (2-year: 1.16; 5-year: 1.14). Placing more weight on the 5-year beta, which is less sensitive to disruption from extraordinary events (the pandemic and the Russia-Ukraine war), I set the equity beta to be 1.2.
I estimate r, my required rate of return for DS Smith, as:
r = RFR + beta * (TMR – RFR) = 1.75% + 1.2 * (7.75% – 1.75%) = 8.95%.
For simplicity, I round up my required rate of return to 9%.
Calculating V0
In this case, the estimated fair value of an DS Smith share is (£0.15) / (9% – 5%) = £3.75. This is 41% above its current price of £2.66 as of 26 August 2022: a substantial margin of safety.
To be still more conservative, I increase my required rate of return to 10%, the annualized total return of the S&P 500 index. In this case, the estimated fair value of an SMDS share is £3.00, around 13% higher – still not bad.
| Input | Unit | Formula | Value (Base case) | Value (Sensitivity) |
| EPS | £ | [a] | 0.204 | 0.204 |
| Dividend in Year 0 | £ | [b] | 0.129 | 0.129 |
| Retention ratio | % | [c] = 1- [a]/[b] | 36.8 | 36.8 |
| ROE | % | [d] | 14 | 14 |
| Sustainable growth | % | [e] = [c]*[d] | 5 | 5 |
| Required rate of return | % | [f] | 9 | 10 |
| Dividend in Year 1 | £ | [g] | 0.150 | 0.150 |
| Fair value in Year 0 | £ | [h] = [g]/([f]-[e]) | 3.75 | 3.00 |
DS Smith is consistently and increasingly making profits
DS Smith has been expanding steadily over the last 10 years. They have been consistently profitable, and their profits have been growing. For me, this is one of the main selling points for the company.
Track record
DS Smith recorded a net income of £280 million in FY 2022. In FY 2012, it was £75.3 million. That’s a CAGR of 14.0%, which is substantially above the historical dividend growth rate, and above my assumption for the forward-looking dividend growth rate. Revenue CAGR in the last 10 years is 13.9%, which is about the same as net income CAGR, and revenue has increased in all but three of the last 20 years.
In 19 out of the last 20 years, DS Smith has recorded positive net incomes. The exception was in 2009, when the company incurred around £23 million in extraordinary losses and impairments on an associate, Ukrainian paper-producer Rubezhansk, due to the impact of sharp depreciation of the Ukrainian hryvnia against the U.S. dollar on Rubezhansk’s dollar-denominated bonds.
Though Rubezhansk had since returned to profitability, DS Smith has once again wholly impaired its value this year because of the Russian invasion of Ukraine. Apart from the minority stake in Rubezhansk, which has already been written off in entirety, DS Smith has no other known exposure in either Russia or Ukraine.
Sources of growth
Like most firms, DS Smith grows its revenues through acquisitions (by acquiring other companies) and organically (by growing its own existing operations). Acquisitions form the bulk of DS Smith’s revenue growth, but there has also been some, albeit sluggish, organic revenue growth.
DS Smith made two major acquisitions of above £500 million in value over the last five years, in the US and in Spain, to break into those markets. Its financial statements do not disclose the profitability of its geographical segments, but they do disclose annual revenues. Let’s take a look.
In August 2017, the company acquired Interstate Resources, thereby gaining entry into the U.S. market. At the point of acquisition, Interstate Resources generated £509 million in sales. In FY 2022, DS Smith recorded £606 million in sales from its U.S. operations. I estimate around 3% annualized organic growth rate for its U.S. acquisitions.
In the 2022 annual report, the CEO remarked he was “extremely pleased to see the continued strong performance in the U.S.” and of the “excellent momentum in our new box plant in Indiana.” While a CEO’s praise for his own company should be taken with a grain of salt, that their U.S. acquisitions was singled out for praise is likely a positive signal.
In September 2018, the company acquired Europac, thereby gaining entry into the Spanish and Portuguese markets. At the point of acquisition, Interstate Resources generated £760 million in sales. In FY 2022, DS Smith recorded £841 million in sales from its Iberian operations. I estimate around 2% annualized organic growth rate for its Iberian acquisitions.
The flagship segment of the company is the UK, where it is headquartered. Its UK sales increased from £0.93 billion in FY 2017 to £1.11 billion in FY 2022, which implies a 4.5% annualized organic growth rate. (I have not reviewed any acquisition by DS Smith of a UK company over the last five years.)
Its French segment is the second-most important by revenue, and grew at a somewhat faster annualized rate of 11.0% over the same period, from £0.70 billion to £1.07 billion. Over the last five years, DS Smith acquired a single French company in 2017. As the French company had only 80 employees when it was acquired, it is unlikely to account for a material proportion of the sales increase.
Putting the picture together, we see that DS Smith has relied mainly on acquisitions to grow its revenues, but it has managed to generate some, albeit sluggish, organic growth on its acquisitions. It has managed to generate somewhat better organic growth on its existing businesses. While it would have been great to see DS Smith more successful at expanding its Iberian and American acquisitions, a measure of comfort can be taken from the appearance that it has not been running them to the ground.
DS Smith stands to benefit from industry and regulatory tailwinds
If you are considering DS Smith, as you likely are since you’re reading this, this may be obvious to you. But the obvious still needs to be stated, and I’ll try to be brief.
Tailwinds overview
DS Smith is one of the three industry leaders of the paper and packaging industry, which stands to benefit from material industry (e-commerce) and regulatory (ESG) tailwinds. Their 2021 annual report notes that the company is “at the intersection of powerful trends – sustainability, e-commerce and digital – which result in compelling opportunities.”
The growth of e-commerce will likely benefit packaging companies. Online retailers need to package their products in cardboard boxes for delivery, and DS Smith sells this increasingly popular and widespread service. The company has also appeared to achieve some success in using renewable alternative material, such as seaweed, for manufacturing boxes, claiming that 90% of its material inputs come from recycled material, and it aims to achieve 100% recycled material by 2023.
I find there is some evidence to suggest that DS Smith is benefiting from these tailwinds.
Industry analysis
One of their key performance indicators, the demand for their product as measured by corrugated box volumes, appears to be accelerating. The company aims for their corrugated box volumes to grow at a target of GDP + 1% rate, and they have exceeded this target, on an annualized basis, over the 10 years.
However, they have exceeded this target considerably more in the last 5 years (box volumes CAGR 3.4%, vs KPI target 1.9%) than in the last 10 years (box volumes CAGR 2.9%, vs KPI target 2.7%). That this is so is almost completely due to the strong growth of the last five years, when the KPI target was exceeded in three out of five years. In the preceding five years, the KPI target was never exceeded.
Box volume growth vs KPI target (My analysis based on DS Smith financial statements and ONS chained GDP measures)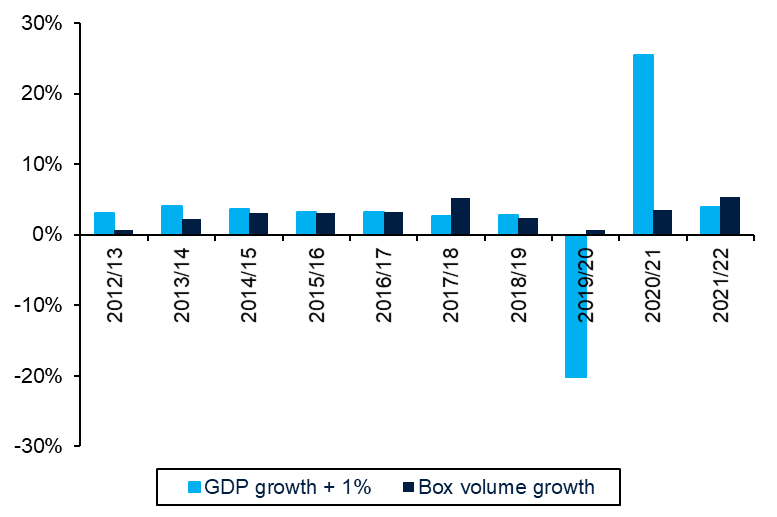
My analysis differs from the calculations presented in DS Smith’s annual reports. I use the ONS chained GDP measures to calculate real GDP index, and calculate the growth on a year-on-year basis in Q2. I do not know how DS Smith calculates real GDP growth, which is why I use my own calculations, which are based on publicly available and trusted data.
Benevolent regulatory neglect
Unlike tech, tobacco or big oil, the paper and packaging industry does not often draw the ire of regulators. Which is not to say it never happens: In 2019, DS Smith was subject, along with Smurfit Kappa, to an alleged unsightly price-fixing antitrust investigation by the Italian regulator.
But by and large, the paper and packaging industry is too boring to merit attention. Normal people do not notice it; and precisely because it is overlooked that no one complains about it. Compared to the hostile legislation aimed at big tech and tobacco companies in the U.S., and the windfall tax threatening energy companies in the UK, the paper and packaging industry looks enviably peaceful.
DS Smith may be less vulnerable to adverse macroeconomic shocks than other companies
Investors who are worried about the fallout from the Russian invasion of Ukraine can take comfort from the fact the DS Smith may be less likely to be impacted than other firms. First, DS Smith has limited exposure to Ukraine through a minority stake in a local packaging company, which has already been fully impaired; and it has no exposure to Russia.
Second, DS Smith benefits from a three-year rolling hedging program with regard to energy, principally gas, for which its energy needs are “predominantly” hedged. This is substantially more than its competitors (for example, Smurfit Kappa’s CFO notes that around half its gas needs are hedged this year), and is normally a drag on returns. But for this year it is likely a material competitive advantage. In the FY 2022 financial statement, DS Smith recorded a £1.07 billion income from the fair value of cash flow hedges.
Third, DS Smith appears to have relatively strong price-making power, which helps it to pass on higher input costs, due to inflation, to its customers. The FY 2022 annual report (linked earlier) mentions “recovery through increased sales pricing (with a lag) of the significant increases in input costs during 2021 and 2022.” This is unsurprising: economic theory predicts that goods which constitute a small proportion of income, or deemed to be necessities, have low price elasticity of demand. Since cardboard boxes meet both criteria, companies that sell them are likely to be less vulnerable to the impact of inflation (compared to, for example, companies that sell diamond watches or Rolls-Royce, which people can do without at a pinch).
Fourth, DS Smith’s revenue was resilient over the Great Recession, with sales increasing every year from FY 2006 to FY 2009. It recorded losses only in FY 2009, which were mostly accounted for by the impairment of its Ukrainian associate. Based on historical record, catastrophe seems less likely to happen to DS Smith than most other firms.
Downside case
In this section I describe some potential downside risks that DS Smith is subject to.
Liabilities
Acquisitions are not cheap, and a number of equity analysts have suggested that DS Smith overpaid for theirs. That’s entirely possible. I do not know anything about it, but I do note that in FY 2018 (when it bought Interstate Resources) and FY 2019 (when it bought Europac), its liabilities shot up from £3.1 million at the end of FY 2017, to £5.4 million at the end of FY 2019.
On the other hand, DS Smith has also increased its equity, such that both its debt to equity ratio, and its total liabilities to total equity ratio, have been decreasing steadily. The total liabilities to total equity ratio nevertheless substantially exceeds unity, which investors who are worried about a coming recession may be uncomfortable with.
Liabilities and equity (My analysis based on DS Smith financial statements)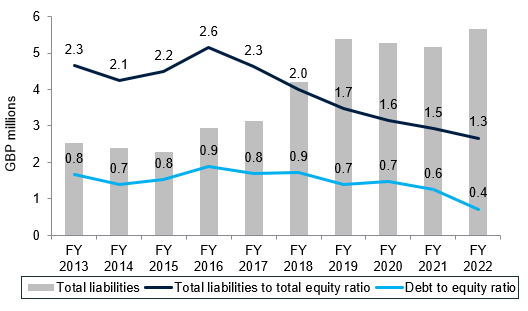
I note that the company faces £754 million in debt due next year, and a further £7 million in debt due the year after. This debt commitments seems to be well-covered by its cash balances (£819 million as of FY 2022) and free cash flow (£275 million as of FY 2022)
Low margins
It is entirely unsurprising that selling cardboard boxes should be a low-margin industry, but DS Smith’s margins are indeed wafer-thin, more so than its peers. It has a 3.87% net profit margin, and a 6.09% operating margin, both of which are in line with their 10-year averages (3.82% and 6.30%, respectively). Margins such as these, in the low single digits, appear vulnerable to adverse demand shocks.
Even though margins are low, I note that they are, at least, consistently positive. But it is a fact that DS Smith is a low-margin company in a low-margin industry. Investors may have to accept that for the foreseeable future.
Conclusion
On balance, I believe DS Smith is currently undervalued and stands to benefit from a number of significant tailwinds. My DCF valuation suggests the fair value of an SMDS share is 13% to 41% above the current price. DS Smith has been growing steadily, and it should – and indeed is – benefiting from growing demand driven by e-commerce and ESG trends. Thanks to its hedging program, the company is also better shielded from the fallout of the Russia-Ukraine war than most others.
As such, I rate DS Smith a strong buy.
Be the first to comment