

DjordjeDjurdjevic
With investors used to challenges faced by the energy sector due to the Ukrainian conflict, most of the talk has been about the supply side. At the same time, with the Organization of Petrol Exporting Countries (OPEC) putting in place production cuts during their meeting in Vienna on the 5th of October, the debate was again in favor of lower supply. Now, with demand remaining upbeat amid the flurry of post-Covid re-openings throughout the world, prices could only move up, resulting in the Direxion Daily S&P Oil & Gas Exp. & Prod. Bear 2x Shares ETF (NYSEARCA:DRIP) seeing an acceleration in its downtrend as pictured below.
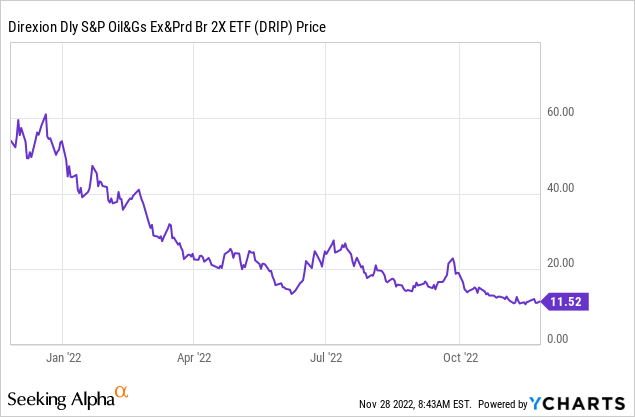
This trend saw a reversal on Monday amidst reports that the number of Covid infections in China is reaching new records. To make matters worse, lockdown-related protests erupted all over the country. This, together with the latest news about OPEC+, could lead to an upside in DRIP’s value. The aim of this thesis is to assess whether there is a window of opportunity for traders.
For this purpose, it is important to be knowledgeable about the variables which impact the price of crude oil, two of which are demand and supply.
Demand Vs Supply of Oil For the Long Term
According to data by the Chinese General Administration of Customs, published by SPG Global, the country’s crude oil imports increased slightly by 0.9% in July, to 8.83 million barrels per day (“bpd”) compared to June. However, due to the slow demand recovery, these figures are far from the approximately 13 million bpd seen back in April-May 2020, when the effects of the pandemic had not yet been felt.
Now, to address the new high number of Covid infections in China, the authorities have reacted with strict restrictions on the population, which goes to the extent of imposing lockdowns across whole cities for weeks. Looking at the past three years and over the course of the pandemic, research has shown that lockdowns have abruptly reduced demand for fuel, and, for this matter, China is considered the world’s largest oil importer since 2017.
Pursuing further, expectations of a global recession which was going to primarily impact Europe have now been contagious to the U.S. Thus, according to data from the Federal Reserve, the probability of a shrinking economy has risen to 50% in 2023 with the country’s central bank itself playing a role in this with its steep increases in key interest rates, intended to tame inflation. Thinking aloud, any recession in America would have a considerable impact on demand, as the country is the largest consumer globally at 19.7 million bpd.
Looking at the supply side, according to data by Statista, Russian crude oil production was 9.8 million bpd, which is only about 200K lower than the March 2022 high. Therefore, there has not been a big drop as many anticipated, but, the oil embargo to be imposed by the European Union against Russia and which will come into effect on December 5th could change things.
Furthermore, there has been another proposal coming from Europe to cap Russian oil at between $65 and $70 per barrel as I have explained in a recent thesis. However, since one barrel of Russia’s Urals crude cost just below $70, that measure would mean limited disruption to supply. Also, Russia’s resilience is also due to its exports to China and India, countries which in the name of energy security have not abided to import restrictions championed by the U.S. and its allies.
Another factor that could impact supply is the possibility of OPEC and its allies taking 2 million bpd off the market, but this action would require drastic production curbs among member states. This may be difficult, as global demand is increasing, but at a less rapid pace than expected, probably due to high inflation and economic slowdown concerns.
Summarizing the above details in the table below, it is seen that demand and supply are more or less balanced.
Table built by the author using data from (www.seekingalpha.com)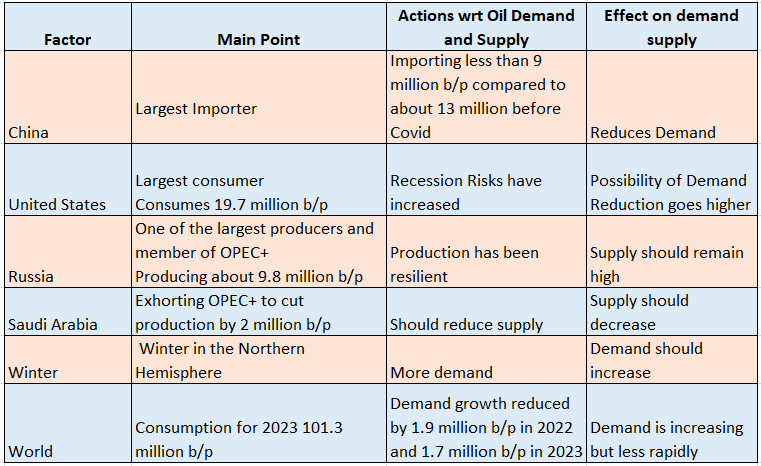
In these circumstances, it is preferable not to opt for a long-term position in oil and gas. Instead, there is DRIP, which provides an opportunity to trade short-term market moves.
Opportunities and Risks of Using DRIP for Trading
Now, DRIP tracks the S&P Oil & Gas Exploration & Production Select Industry Index (SPSIOPTR), but at an accelerated pace of 2 times its inverse daily investment results. Therefore, when the index is down by 10%, DRIP should be up by 20%, but this is only in theory.
In practice, there is the compounding effect whereby leveraged exchange-traded funds (“ETFs”) do not provide the gains that they are supposed to, as the share price has been highly volatile during the trading period. This is the reason why the fund managers at Direxion recommend traders take advantage of short-term trends only and refrain from adopting a buy-and-hold investment strategy.
Looking deeper into the composition of the index, 71.6% of its holdings come from the Oil and Gas (O&G) Exploration and Production sector as pictured below. Others come from Refining and Marketing, with others being integrated plays that are present across the whole energy value chain. One thing which all these companies have in common is their dependence on the price of O&G. Thus, the higher the price, the more their profitability as well as the cash flow from operations.
SPSIOPTR Index Top Holdings (www.direxion.com)
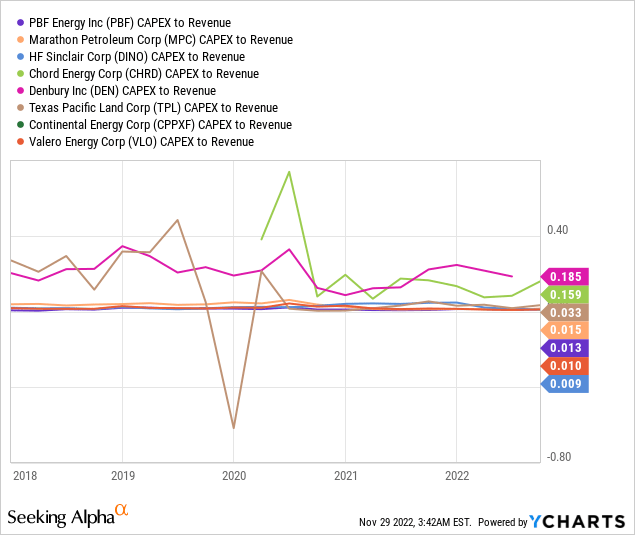
Now, energy companies are famous for their high dividend yields, implying that a large portion of the generated cash goes to shareholders. The rest goes towards capital expenses covering activities like drilling for new sources of energy.
Looking at the origins of the oil industry, oil was initially pumped from relatively shallow fields some 20 meters deep, but, the early 2010s saw the end of the era of cheap oil. This involved tapping unconventional sources like U.S. shale where extraction costs are much higher with deposits located more than 2 km beneath the surface of the earth.
The Short-Term Scenario
These have required massive investments which need to be sustained for production levels to be maintained, but, as evidenced by their lower Capex-to-Revenue ratios (compared to before 2019-2020) as per the chart below, companies have been investing less.
Thus, going ahead, there is likely to be lower production, which would in turn result in a lower supply of oil. Furthermore, with the advent of winter in the Northern Hemisphere, people will have to warm up their homes. Thus, demand for natural gas is likely to be high, especially after climate experts have predicted that this time around, it is likely to be colder.
Now, DRIP provides exposure to both oil and gas, and as I detailed in an earlier thesis, both commodities are linked, initially at the production stage and later for substitution purposes in the global energy mix. Therefore, colder weather not only means higher demand for gas but for energy in general. To make matters worse for oil bears, the forthcoming Christmas driving season is synonymous with sustained demand.
The above arguments are against a bearish stance on the energy sector for the short term, but, as I will show below, the window of opportunity for trading certainly exists.
The window of Opportunity for Trading DRIP
First, while it is not clear whether capping oil or natural gas prices will have any major impact on the overall supply, prices increased and this had a negative effect on DRIP’s value as of November 19, as pictured below. Therefore, in absence of capping talks, oil prices should logically move lower to the benefit of the ETF. The same effect can be induced by news pertaining to the economic slowdown in the U.S. when Fed Chairman Powell speaks on Wednesday or the deterioration in China’s Covid infection rates, with the country also facing economic growth concerns.
Chart built using data from (www.seekingalpha.com)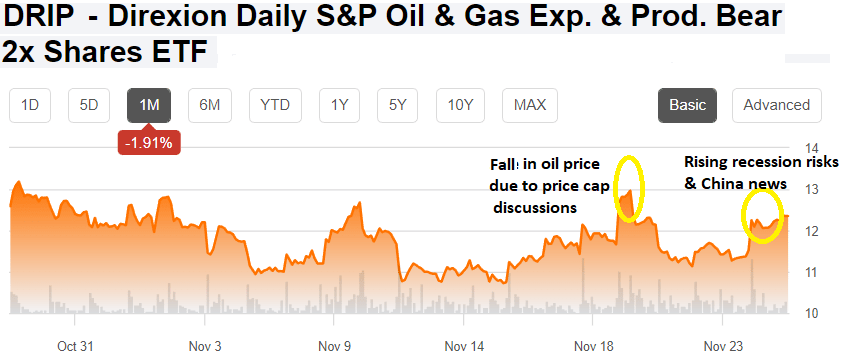
Moreover, due to its 2x inverse exposure to companies that depend on the price of energy, DRIP is prone to sudden and abrupt price movements, which means that it is important to get the timing right. Now, for those who missed the November 23 date (as shown in the above chart) to place their trade, when data from the Fed indicated a higher probability of the U.S. economy going into recession, it may still not be too late.
The reason is that more supply-favorable variables are likely to emerge following the recent news by Reuters, which essentially points to some dissension as to a possible agreement between members of OPEC and its allies as to production cuts when they meet on Sunday. This news coincided with crude oil paring earlier gains made on Tuesday.
In these circumstances, prices are likely to be volatile, and the ETF could again flirt with the $13 level, providing a 7.4% potential gain based on its current share price of $12.1.
However, it is important to be particularly careful when using this leveraged ETF, as its price movements can be quite brutal given that there are so many variables impacting the price of the commodity at the same time. Thus, make sure to constantly monitor your gains and do not hesitate to exit with a stop loss if losses mount.
Conclusion
By walking traders through the demand-supply equation, this thesis has shown that there is uncertainty over the long term while oil prices could rise over the short term, especially because of seasonal demand. This implies that the window of opportunity to trade DRIP is likely to be narrow as oil prices should eventually rise. For this matter, and for those who doubt the ability of the OPEC cartel to reach an agreement, look no further back than in the first half of 2020, when members reached a consensus to drastically reduce production.
Be the first to comment