

Editor’s note: Seeking Alpha is proud to welcome Trade Theory as a new contributor. It’s easy to become a Seeking Alpha contributor and earn money for your best investment ideas. Active contributors also get free access to SA Premium. Click here to find out more »
Scott Olson
DraftKings (NASDAQ:DKNG) has lost much of its luster following its SPAC based IPO where the stock rallied to a height of $72 in February of 2021 before eventually dissipating to a more paltry valuation of $12 today. However, much of the skepticism tied to the company stock is derived by an absence of profitability, heightened promotional activity, and the difficulty of maintaining a defensive business moat.
However, we believe that to understand the underlying sports betting thesis, or industry, it’s worth noting that the wave of de-regulatory steps that have affected the U.S. gaming industry creates a condition in which rapid deployment of services, and marketing activity is required in order to quickly satisfy customer demand. DraftKings has done exactly that. DKNG was quick to open gaming accounts as gaming markets opened across the USA over the past two to three years. It’s why DKNG posted such astronomical revenue growth of 88.9% per year. Sales grew from $323.4 million in FY’19 to $2.18 billion FY’22 (analyst estimates) with analysts expecting y/y sales growth of 68% for the current year.
Given the larger revenue base it’s difficult to sustain historical growth rates, and so the argument becomes how much growth deceleration can investors tolerate, and does this sum to a business trading at a discount or not? We wouldn’t put much credence to long-term forecasts implicit of further deceleration of revenue growth of 34.5% into FY ’23 (where consensus estimates are currently). It’s why we think expectations have reset to a point where management can deliver solid top line numbers and drive share price gains in the next year.
Eventually the house always wins…
DKNG operates without in-person gaming locations, but overcompensates with rather generous bonuses to gamers, and is broadly regarded as the leader in the segment by various gaming enthusiasts and videologgers on the internet. In other words, it’s possible that investors mistake that the lack of profitability is due to the company’s inability to generate a profit from gaming activities, but rather we believe that there’s some cost to acquiring users.
Given the recent series of cap raises, the bias is towards leveraging the existing cash pile of $2 billion to sustain user/account growth. Some investors are averse to the idea of leveraging public markets for the purposes of generating cash from secondary transactions, but given how growth is eventually rewarded… perhaps the bias is towards expanding the business even if cash burn continues for the foreseeable future.
Personally, we’d much rather keep our losses in our sports gaming accounts and acknowledge that a gaming operator is bound to win over time. It’s why we wouldn’t bet against the gaming company over the long haul because of solvency risk, or implied risk of solvency as the operator isn’t tied to expensive real estate assets like a conventional casino operator, and could use a combination of secondary funding via an equity issuance paired with a debt issuance if in the event liquidity was ever a material concern.
Furthermore, the rather Capex light model implies that the sportsbook operator could reduce some of its promotional activity, or reduce OpEx aggressively in an effort to reduce operating losses though it would impact account growth on its platform to address liquidity with less promotional activity.
Consider business fundamentals and work up to market assumptions
To understand the business we dive deeper into the financial statements and want to spotlight some factors to the industry and the definition of revenue. We think that understanding the core business of betting markets is critical in scoping the opportunity for more sophisticated investors.
DraftKings definition of revenue as per its 2022 10-K is as follows:
Sportsbook or sports betting involves a user wagering money on an outcome or series of outcomes occurring. When a user’s wager wins, the Company pays the user a predetermined amount known as fixed odds. Sportsbook revenue is generated by setting odds such that there is a built-in theoretical margin in each sports wagering opportunity offered to users. Sportsbook revenue is generated from users’ wagers net of payouts made on users’ winning wagers and incentives awarded to users.
We look at the revenue recognition accounting policies, as much of the risk tied to the growth thesis ties to whether or not DraftKings can sustain growth. Quite simply, DraftKings revenue figure is based on its net-take on wagers.
Figure 1. Standard Sportsbook betting line and margin
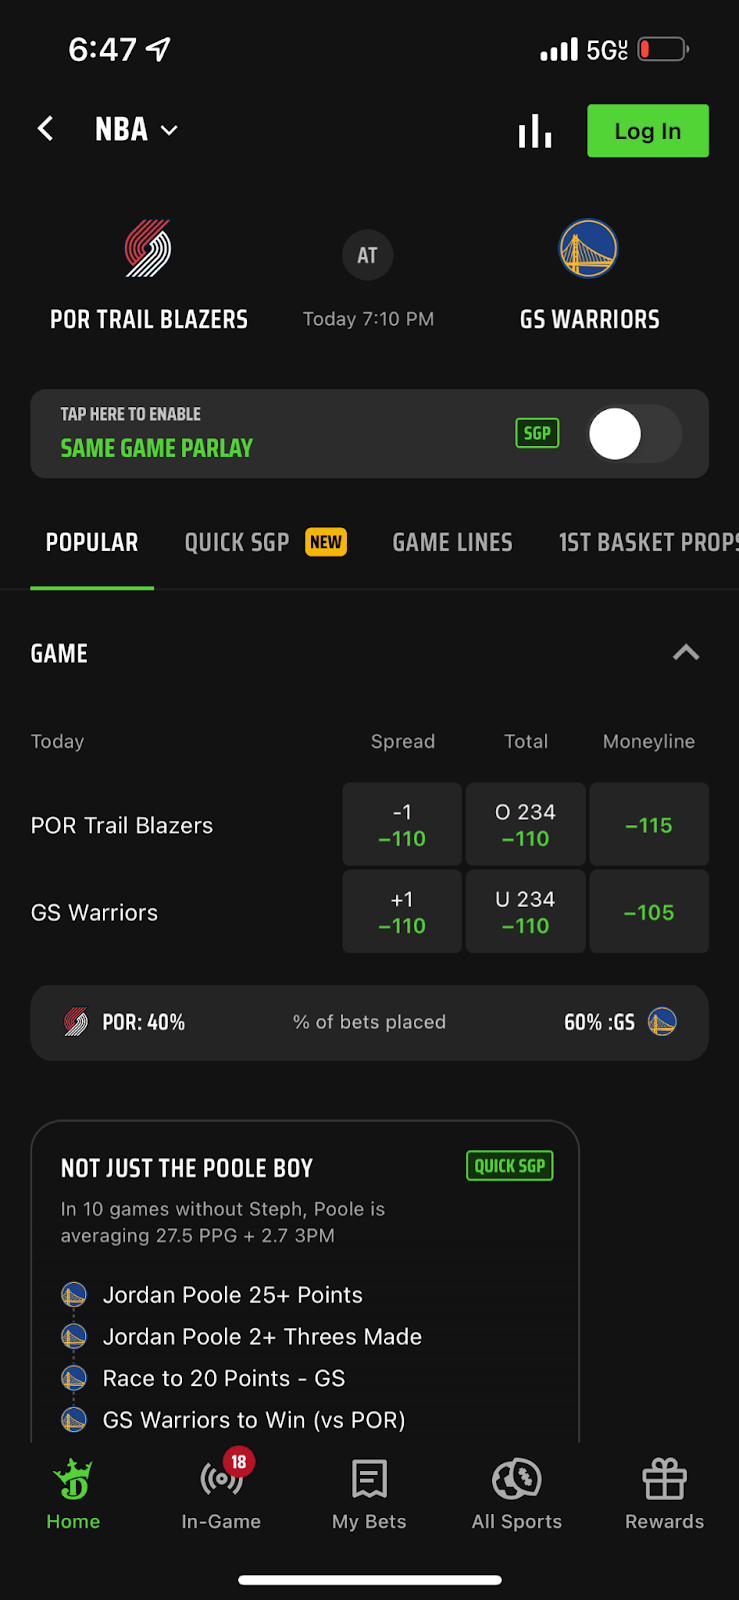
DraftKings (DraftKings)
In the above example, using the DraftKings app we can see that the standard wager spread is set at -110 payout for the Golden State Warriors, and also -110 payout for betting on the Portland TrailBlazers with a -1 spread favoring the TrailBlazers meaning that Portland would have to win by more than 1 point to payout, or if you bet Golden State Warriors, the Warriors would payout even if they lose by 1 point hence, the +1 point awarded to the slight underdog.
DraftKings will pay out -110 meaning $90 payout for every $100 wagered for either Portland or Golden State Warriors, which means that regardless of how the bet settles, Portland wins or Golden State Warriors wins by the spread, they’re making $10 on the net winners pay out after a $200 pay in from both sides. Upon the bet settling, the winner takes $190, and DKNG takes $10 in this case, so DKNG is guaranteed to take 5% of the total wager.
Typically, the DKNG Sportsbook hopes to earn 5% from wagers placed on the platform. So, when determining feasibility of results we have to anticipate the total amount of platform activity, and the prospective amount of wagers placed on the platform to determine whether or not DKNG can even achieve FY ’23 revenue of $2.93 Billion.
By that more simplified definition, DraftKings would have to generate $58.6 Billion in total wagers over the course of FY ’23 in order to generate enough payout commission, or “vig” (industry parlance) in order to reach consensus estimates. Of course, according to the accounting note on revenue, the company calculates its “vig” or revenue net of incentives awarded to users (which is usually noted in dollarized increments of free bet coupons and when those free bets are redeemed it counts against the net payout). But, for the sake of simplicity we think DKNG’s dealer spread on bets is around 5%, which makes hinging our assumptions on platform activity sound in determining whether or not they can exceed expectations priced into the stock.
Masked by sports terminology, confusion, and speculation investors miss the big picture
When we approach an investment we ask ourselves why does this opportunity even exist, and does a mispricing exist between the expected future value, and what’s priced into the stock currently?
We think there’s a disconnect between Wall Street and Main Street, as sports betting is difficult to understand, and value. But, when simplified and stripped down to its fundamentals it should be valued like a digital exchange, or P2P payment exchange, as it operates an electronic market for speculating on sports outcomes.
So, when we re-frame the argument for investing into sportsbooks we have to strip ourselves of the historical context behind why casinos are valued a certain way, and instead consider the total volume of transactions a market could generate. In this case, we examine sports wagering more carefully. Unlike making bids on an open bid exchange like Coinbase (COIN), or the NYSE for that matter, speculators in the sport market operate on a system of wager pay-ins and pay-outs with the casino operating as an intermediary. This category as a whole has the most potential for expansion, as conventional casino fundamentals were based on regional locks, and in-person experiences, whereas pure-play sportsbook operators provide a mobile gaming experience, or really access to a digital exchange, or marketplace where the provider earns a net commission rate whether you stay at a gaming resort or not.
When technology investors approach a company generating commission based revenues based on a market based model you arrive at companies more like eBay (EBAY), PayPal (PYPL), Square (SQ), Coinbase, Marqeta (MQ), Intercontinental Exchange (ICE), RobinHood (HOOD).
We think DraftKings isn’t too different from more conventional marketplace type apps but comes with the caveat of being tied to gaming (having peers for comparative valuation purposes), which makes it confusing for investors to value.
But, because the sports gaming market is more digitally native, it’s not tied to hotel operator fundamentals. So, when comparing to an established casino operator like MGM Resorts (MGM), or Las Vegas Sands (LVS), the value of these businesses is also tied to other “games” like Poker, and BlackJack, and also the projected value of hotel assets, and fixed gaming assets like slot machines and so forth. While we believe that there will always be a market for in-person gaming experiences, it’s hardly a useful exercise in comparing a pure-sports betting marketplace to a conventional hotel + gaming operator, and it’s why we don’t find much comfort in comparing a pure-play opportunity like DKNG to conventional gaming operators.
How do we value DKNG?
We think the truth is probably somewhere in the middle where it should be valued like a casino and a digital marketplace (which is how we derive our value estimate). We also look at internal metrics derived from investor meetings, and shareholder presentations to arrive at a more concrete expectation on what sales growth numbers should be based on more inputs, and because much of the argument tied to the stock is based on topline expansion we arrive at a price target based on sales multiple.
Therefore, we’re not valuing DKNG on the basis of earnings, and we don’t anticipate earnings over the next 2-3 years, so for sake of simplicity we focus on sales, and possible sales multiple expansion to define our upside scenario.
Figure 2. Public Revenue Multiples by Category
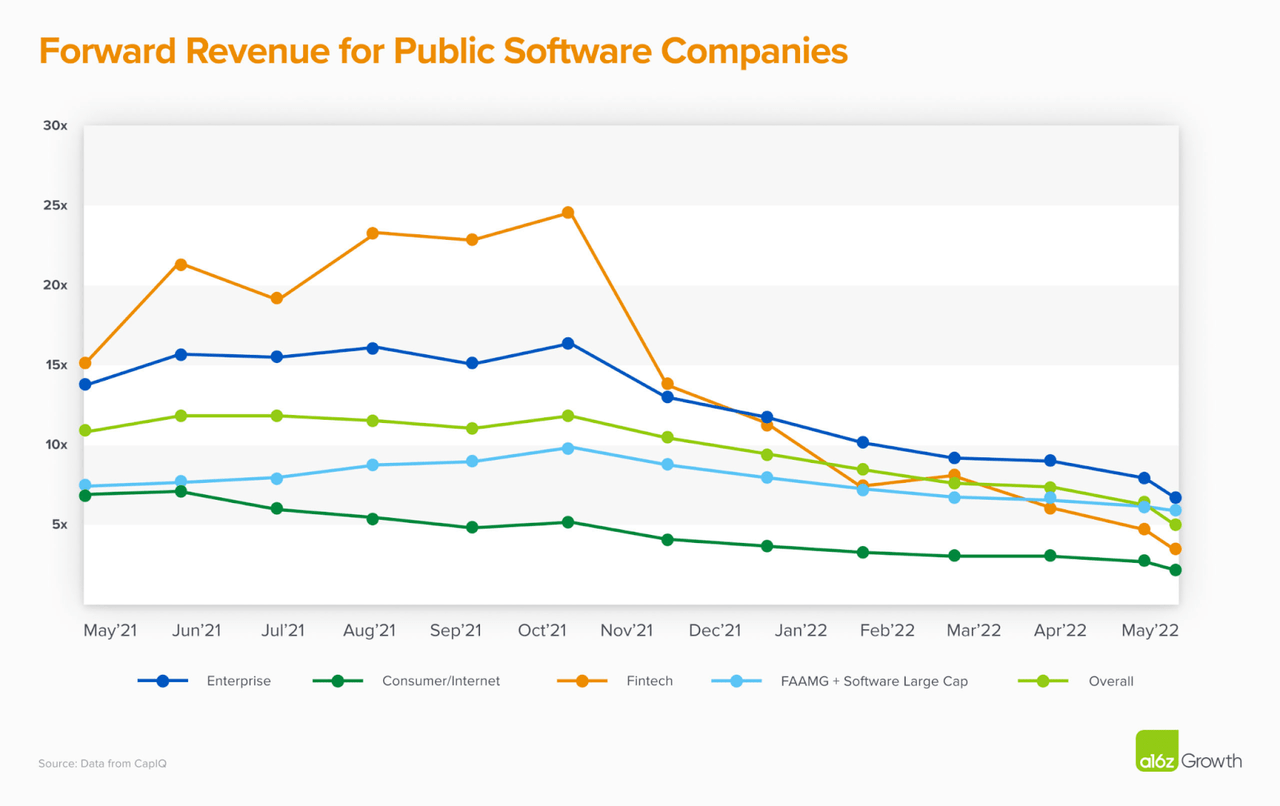
A16z Presentation on Sales Multiples in tech (A16z)
We use the fintech multiple of 3x sales (orange line), as described in the value compression slide above from a16z (Andreessen Horowitz) to help us define DKNG value from a present multiple context. Certainly there’s room for further value compression, but based on recent market conditions tech multiples have started to stabilize among big tech despite macro headwinds.
DraftKings valued at 3x forward FY ’22 sales implies a valuation of $6.54 billion or 28%+ upside if DKNG trends towards Fintech multiples, which have already compressed considerably given the recent rout in payment tech stocks. But, when taking into consideration the valuation of conventional peers: MGM 1.15x sales, Caesars Entertainment (CZR) 0.66x sales, PENN Entertainment (PENN) 0.79x sales, Wynn Resorts (WYNN) 1.8x sales, Boyd Gaming (BOYD) 1.73x sales, the average gaming sales multiple hovers at 1.23x sales.
What’s the downside scenario?
So, when we combine the average fintech multiple of 3x sales with the current gaming industry sales multiple of 1.23x we arrive at a blended forward sales multiple of 2.1x. So, based on that definition DKNG should be valued at $4.67 billion using FY ’22 estimates or roughly 26% downside if you factor in the weakness in valuations across gaming stocks. However, we find that our rationale at least gets us within the ballpark of estimating the sportsbook’s valuation.
What’s the upside scenario for the next 12 months?
Well, on one hand, if the company delivers exactly the consensus figure in FY ’22 it’s difficult to argue a material upside case from the earnings call. Management guidance for FY’22 $2.175 billion sales, versus consensus of $2.18 billion. There’s not a whole lot of expectation for the final reporting quarter. In other words we think the stock already trades within a reasonable range of near-term results, and so we turn our expectations towards the following 12-months.
We value the business on FY ’23 forward sales of $2.93 billion cons. And apply our 2.1x blended sales multiple on gaming and fintech to arrive at a $6.15 billion valuation or price target of $15. The stock currently hovers at $14 or so, basically an in-line guidance is already priced into the stock.
How we can estimate revenue growth
What could drive revenue expectations even higher? Combination of higher than expected volumes, perhaps appetite for wagers increases among the average aged cohort, and the number of new account openings translates to a surprise on top line revenue.
Figure 3. User level metrics Q3’22
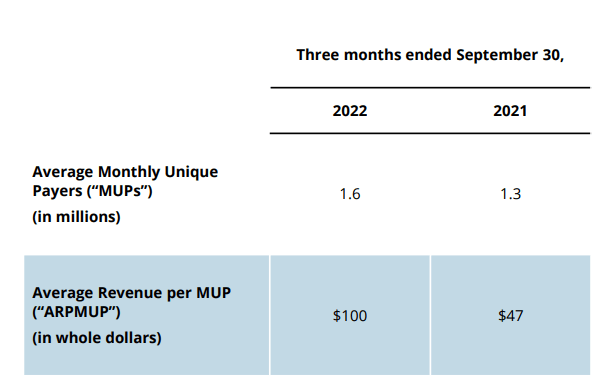
DraftKings Revenue Per User Metric (Monthly) (DraftKings)
Q3’ 22 average monthly unique users was 1.6 million versus 1.3 million in Q3′ 21 or 21% y/y account growth. Average revenue per user growth from $47 to $100 or 112% y/y. Taking the user level metrics even further, each user generated $300 for the quarter, and when multiplied by 1.6 million users, the total revenue for the quarter was $480 million, which compares to the companies reported $468 million online gaming revenue + 9 million in gaming software revenue = $477 million excluding “other” revenue.
We know the internal metrics on users and average revenue closely conforms with reported results absent “other revenue,” which “other revenue” contributed an extra $20 million to consolidated revenue and is a combination of income from interest bearing accounts, and deferred revenue recognition tied to other transactions. We can derive much of our revenue expectations from their definition of total users on the platform, and the expected take rate over time.
Investors are early in the growth story
Based on the amount of users on the platform, and the average betting volume, we don’t think DraftKings is really anywhere near market saturation. Keep in mind, DraftKings is operating in 20 states where sports betting is legal. There are 9 additional legal sports gaming states where DraftKings hasn’t opened its service yet such as Nevada, Nebraska and Ohio among 6 others.
So, achieving the embedded expectation of 20%+ user growth off of such a low monthly active user base seems highly plausible (in terms of tech industry norms), and it’s why we don’t take aggregated metrics on market share or penetration metrics too seriously as there’s a relatively small base of users when compared to the 100 million+ immediately addressable 21+ audience. Simply speaking, adoption among users could surprise on any given number of factors due to the low penetration rate and still high levels of promotional activity.
To put this in perspective, there’s tons of organic growth potential from the existing markets it services, as the amount of population penetration at just 1.6 million monthly active users is quite small when compared to the addressable population of the 20 states it’s licensed to operate in. We estimate that the 21+ figure is above 100 million+ based on census figures, and a third-party estimate from American Gaming Association puts the total figure at 111 million 21+ Americans can now legally place bets in their home state.
According to Nielsen data, roughly 106 million or roughly 46% of American adults have interest in sports betting. Meaning that there’s a humongous gap between the amount of interest, and the number of actual users actively gaming on the sportsbook. Put simply, 1.6 million DraftKings users amounts to roughly 1.5% penetration into the “interested” population segment, or 1.6 million active accounts represents 1.5% penetration into the addressable 21+ Americans who can now legally gamble.
In other words, there’s significant legs to just the user growth thesis, as people who make sports bets also own multiple accounts. It’s much like the cryptocurrency industry where users will opt to move wallets and bitcoins onto various exchanges and pull funds out and distribute those funds across exchanges due to centralization risk.
The reasons why gamblers have accounts spread across the sportsbooks has to do with line-shopping, or basically being able to secure better wager odds/payouts based on the different prices quoted across the different sportsbooks. Because there’s always pricing inefficiency, and because sports markets are decentralized, the active sports better also has multiple accounts, like a DraftKings account, FanDuel, Caesars Sportsbook. Meaning, there’s some overlap in the reported user metrics among all the sportsbooks, and it’s why the per user level metrics on a per company basis defines the opportunity more specifically than the aggregated measures on total market growth published by third-parties like Grandview Research.
We believe that all the operators are achieving greater numbers on average revenue per user metrics even when users are understood to have multiple accounts. It’s why when bears argue market share gain/loss amongst peers it makes absolutely no sense, because gaining share isn’t what’s defining success among peers. The customer lifecycle of adoption may start with a competitor’s app like Caesar’s (CZR) or FanDuel, but it’s only a matter of time before the gamer starts line shopping and eventually opens a DraftKings account among many other gaming apps.
We also find that gamers have a really long life expectancy, with a presentation showing 5-years of LTV or “lifetime value” on average. But, with the recency of sports gambling expanding so much even those historical measures sound kind of comical. If sports betting was only made legal recently in all these states, how do we actually know how long people might gamble for? Some might go onto get an addiction and stay glued for the rest of their lives, and others might snap out of a losing weekend and never attempt another sports gamble again.
Even so, we know that gaming is a sticky business and each user addition could amount to $1,200 in average revenue (based on today’s metrics). Meaning that the user generated $24,000 in total betting activity over the course of a year. Somebody could take $1,000 and turnover that amount 24x to achieve this figure, or somebody with $24,000 could make one bet and the sportsbook earned 5% of that amount or $1,200 to reach that revenue per user figure.
In either case scenario, it’s not impossible to think of a combination of betting volumes going up, and also the amount of user growth surprising to the upside, as the per user level activity could increase, as it’s strictly an average.
To put context to this, an avid gambler might make 3,000 sports bets in a year, and their average bet is $50 in size. They generated $150,000 in total sports betting volume over the course of a year, and based on the sportsbook 5% average spread, that customer generated the sportsbook $7,500 in net payouts… so if the $1,200 average sounds inflated, it’s probably not. We think avid gamblers skew the average per user revenue metric for sure, like the usual 80/20 principle where 20% of users probably account for 80% of total revenue. In other words, we could imagine more enthusiast gamers emerging, and so as a consequence the amount of revenue per user continuing to much higher levels… which is why we think there’s also room for monthly ARPU growth as well.
Baseline scenario rather conservative?
Well, the math is kinda simple at this point, we could imagine the sportsbook increasing the average amount earned from players by more than 35%+ as it would imply an increase in betting volume that’s well below the historical average growth rate. Meaning, even if DraftKings ended the year with the same number of monthly users, at 1.6 million to 1.7 million users, and managed to increase the average revenue per user from $1,200 to $1,723 it would meet analyst expectations representing 43% growth on per user monetization, which is well below the historical trend in user monetization growth. In other words, analysts and markets are mostly pricing-in the anticipated growth in activity per user, as opposed to any expectation of acceleration in active account growth, and the amount expected at the user level isn’t all that much.
Furthermore, we think that there’s a small possibility that user growth will return to 30% in FY’23 bucking the recent weakness in results implying that if DraftKings finished the year with 2.2 million monthly users, and ARPU (average revenue per user) for FY’23 comes in at $1,723 it would report revenue of $3.79 billion versus cons. Estimates of $2.9 billion in FY’23 representing a sales beat of 30%, which is extremely massive even by Wall Street standards.
The best case scenario isn’t all that improbable however, as expectations tied to per user monetization, and expected installs of the app have come down to a point where even 43%+ ARPU and 30%+ monthly user growth sounds aggressive, but by historical standards both numbers are actually quite achievable, it’s just that the two growth levers might be lumpy, and so over the course of the year, ARPU might surprise but account growth disappoints, or a combination of scenarios might average to a much lower revenue figure. It’s why we don’t offer a price target estimate based on the upside scenario.
Final takeaways on DraftKings
If we applied our 2.1x sales multiple on $3.79 billion in sales, the business is valued at $8 billion or $19.90 price target, which brings us to the mid-point consensus price target at $20. The notable difference is that the estimates from the sell-side imply a higher valuation multiple on FY’23 revenue results closer to $3 billion. Whereas we derive much of our optimism or achievability of price target on a combination of surprises in either ARPU or MAU metrics, which means our baseline scenario of $15 is still the most likely scenario assuming the company reports around $2.9 billion – $3.2 billion for FY’23 with a solid sequence of revenue beats causing the price to go parabolic and the stock reaching $20 or more, implying 40%+ upside from current levels.
We could see the stock trading at $15 with expectations beats on revenue easily taking the stock past $20 over the course of 2023. It’s why we think DraftKings is heavily undervalued, and while we acknowledge that there are some risks to investing into undefined, or unconventional markets.
We think there’s a strong bias for why valuation could improve, sales results could deliver above consensus, and it’s why we choose to bet in favor of the “house” today.
Hence we recommend DKNG at BUY, and find that concerns over saturation, or erosion of market share erroneous to the underlying user-level discussion driving the stock currently.
Be the first to comment